Superimposed Equilibrium Fractal Waves
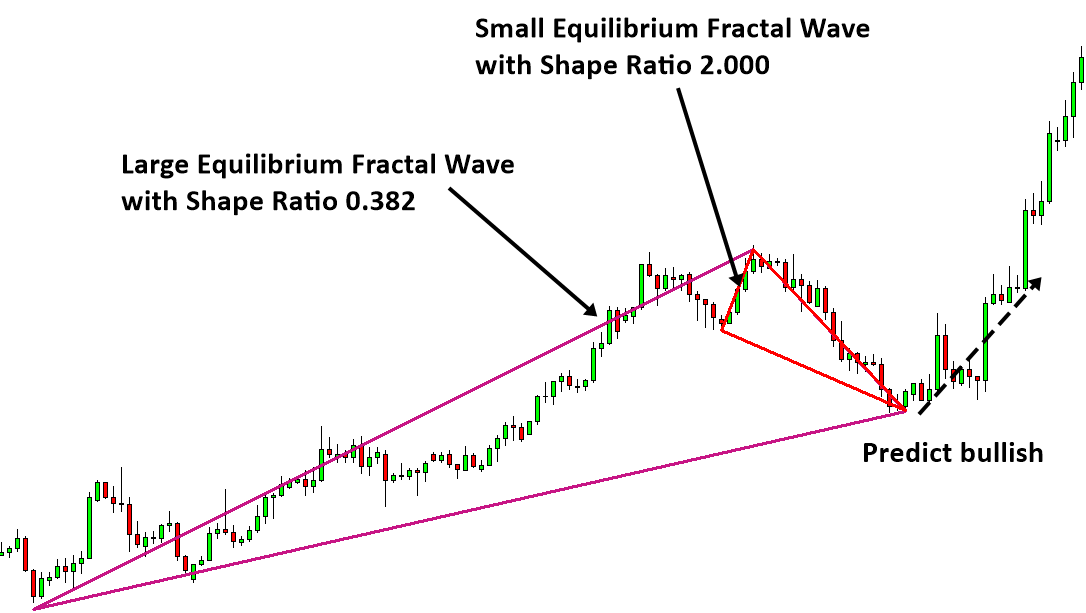
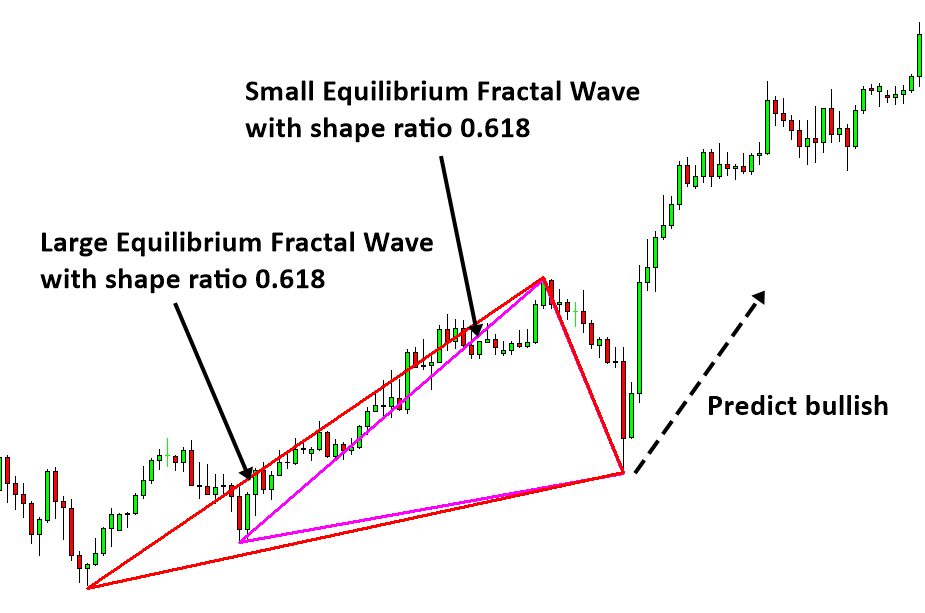
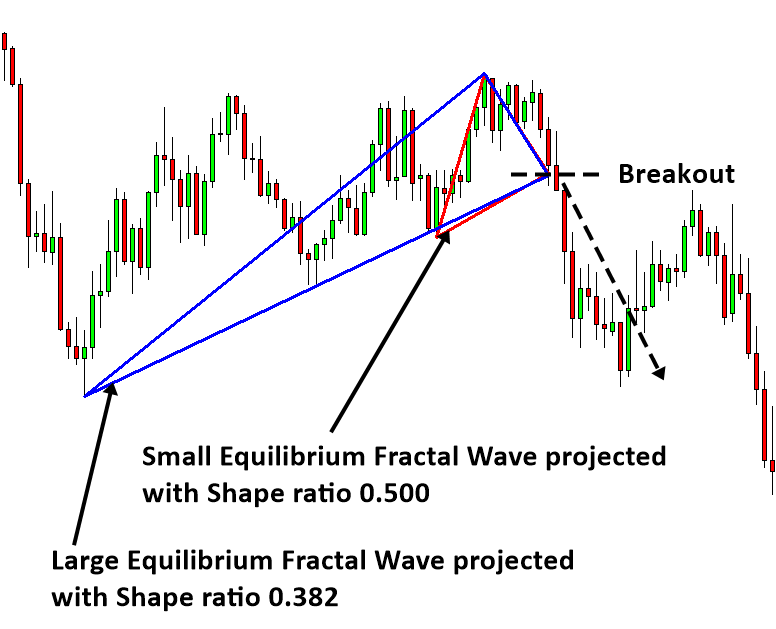
Third characteristic of equilibrium fractal wave is that smaller equilibrium fractal waves can combine to form a bigger equilibrium fractal wave (superimposed). This third characteristic is often used by a professional trader to improve the predictability of the financial market. For example, instead of puzzling with a set of small equilibrium fractal waves, it is much more accurate to puzzle with both small and big equilibrium fractal waves together to predict the market direction. Now we show some examples of our reversal prediction using this superimposed equilibrium fractal waves. In Figure 3-23 and Figure 3-24, a large Equilibrium fractal wave is overlapping with a small equilibrium fractal wave. We can make the bullish reversal prediction after the last candle is completed. Making the prediction based on the two Equilibrium fractal waves can increase the probability of winning marginally over just using one equilibrium fractal wave.
Figure 3-23: Superimposed Equilibrium fractal wave for bullish reversal trading setup (EURUSD D1).
Figure 3-24: Superimposed Equilibrium fractal wave for bullish reversal trading setup (EURUSD H1).
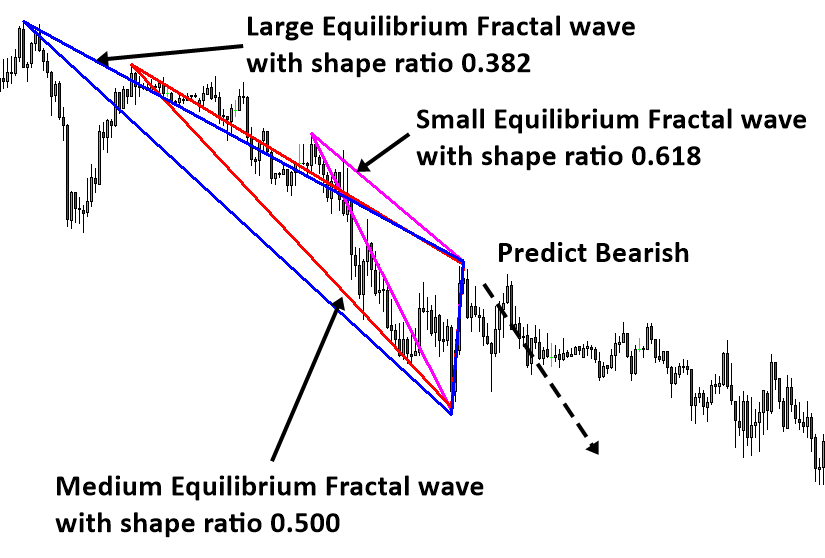
Likewise, we can use these superimposed equilibrium fractal waves to make the bearish reversal prediction too as shown in Figure 3-25 and Figure 3-26. You can even use three or four equilibrium fractal waves for your prediction. However, the superimposed patterns with three or four equilibrium fractal waves are rare. If they do appears then they can provide a good trading opportunity.
Figure 3-25: Superimposed Equilibrium fractal wave for bearish reversal trading setup (EURUSD H1).
Figure 3-26: Superimposed Equilibrium fractal wave for bearish reversal trading setup (EURUSD M15).
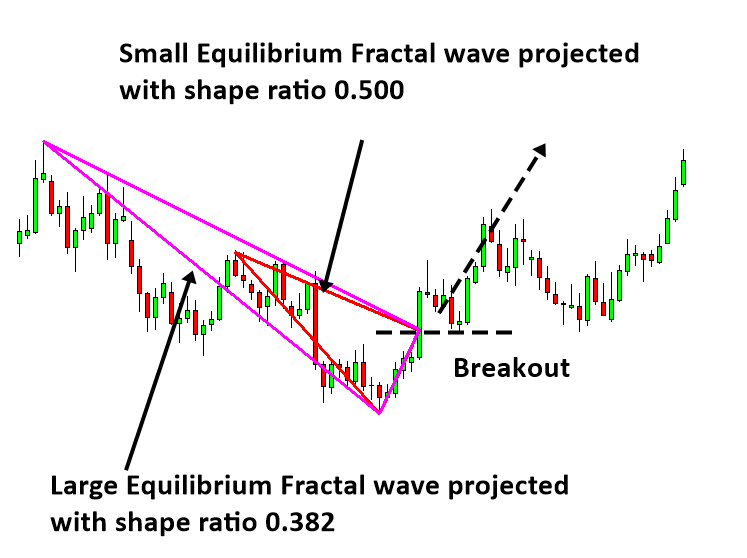
Trader should not assume that he could predict the reversal every time. Increased probability does not mean that you are guaranteed to be right every time. Based on the second characteristic of Equilibrium fractal wave, extension, the price can still penetrate these superimposed equilibrium fractal waves for the breakout opportunities. When they do, they can penetrate the superimposed level with even higher energy than the level projected by single equilibrium fractal wave. To trade with the superimposed level, you have to project the shape ratios from several equilibrium fractal waves in advance. Once you can identify the overlapping level between several Equilibrium fractal waves, you can trade for the breakout opportunity. When you trade the breakout opportunity, you can use the idea of trigger level we taught you before in the support and resistance trading.
Figure 3-27: Superimposed projection for bullish breakout trading setup (EURUSD D1).
Figure 3-28: Superimposed projection for bearish breakout trading setup (USDJPY H1).
Some More Tips about Superimposed Waves in Forex Trading
Superimposed waves in Forex trading refer to the concept where multiple waves of different scales or degrees interact with each other to form the overall price movement in a market. This concept is rooted in Elliott Wave Theory, where the price movements in a market are seen as a combination of waves of various sizes and timeframes, all overlapping and interacting with one another.
Key Concepts of Superimposed Waves
1. Wave Degrees
In Elliott Wave Theory, waves are classified into different degrees, each representing different timeframes or levels of market movement:
- Grand Supercycle: The largest wave, spanning several centuries.
- Supercycle: A wave lasting several decades.
- Cycle: A wave that can last from one year to several years.
- Primary: Typically lasts a few months to a couple of years.
- Intermediate: Can last a few weeks to several months.
- Minor, Minute, Minuette, Sub-Minuette: These are progressively smaller degrees that can last from weeks to just minutes.
2. Interaction of Waves
Superimposed waves occur when waves of different degrees interact simultaneously, influencing the market’s price movement:
- Constructive Interference: When waves of different degrees move in the same direction, they reinforce each other, leading to stronger price trends.
- Destructive Interference: When waves of different degrees move in opposite directions, they can cancel each other out or create more complex price movements, leading to consolidation or choppy market conditions.
3. Market Fractality
The concept of superimposed waves is closely related to the fractal nature of markets. Fractals are self-similar patterns that repeat across different scales. In Forex trading, this means that wave patterns observed on a daily chart might also be seen on hourly or minute charts, but on different scales.
4. Identifying Superimposed Waves
Traders analyze superimposed waves by:
- Multi-Timeframe Analysis: Examining charts of different timeframes to identify waves of varying degrees.
- Wave Counting: Labeling waves on different timeframes to understand how they interact and influence the overall market structure.
- Pattern Recognition: Identifying how smaller waves (like those on a 1-hour chart) fit into larger waves (like those on a daily chart).
5. Practical Application in Forex Trading
A. Identifying Trend Strength
When waves of different degrees align in the same direction, the trend is generally strong. For example, if a trader identifies an upward wave on the daily, weekly, and monthly charts, they can expect a strong bullish trend, with superimposed waves reinforcing each other.
B. Spotting Reversals
Reversals often occur when larger-degree waves are in the process of completing, while smaller-degree waves may start moving in the opposite direction. A trader might spot a potential reversal if a higher-degree wave is nearing completion and smaller-degree waves begin to diverge from the larger trend.
C. Complex Corrections
Superimposed waves often explain why some corrections in the market are more complex. For example, a simple ABC corrective pattern (on a smaller timeframe) might be part of a larger complex corrective structure on a higher timeframe.
6. Example of Superimposed Waves in Forex
Scenario: Analyzing EUR/USD
- Monthly Chart (Cycle Degree):
- Identify a large impulsive wave that has been trending upward for several years.
- Weekly Chart (Primary Degree):
- Notice the primary wave is in the final stages of its trend, showing a potential Wave 5.
- Daily Chart (Intermediate Degree):
- Spot the intermediate wave forming a corrective pattern within the primary Wave 5, indicating consolidation.
- 4-Hour Chart (Minor Degree):
- See a minor impulsive wave forming in the direction of the larger trend, suggesting a potential short-term trading opportunity.
Trading Strategy:
- Entry: Wait for the completion of the corrective pattern on the daily chart and enter a position in the direction of the larger trend once the minor wave aligns with it.
- Stop-Loss: Place a stop-loss below the corrective pattern’s low point on the daily chart.
- Target: Aim for the completion of the intermediate wave on the daily chart, taking into account the overall trend on the weekly and monthly charts.
Conclusion
Superimposed waves in Forex trading highlight the complex and multi-layered nature of market movements. By understanding and analyzing how waves of different degrees interact, traders can better anticipate market trends, spot potential reversals, and identify trading opportunities. This approach requires careful multi-timeframe analysis and a solid understanding of wave theory, but it can significantly enhance a trader’s ability to navigate the Forex market.
About this Article
This article is the part taken from the draft version of the Book: Scientific Guide to Price Action and Pattern Trading (Wisdom of Trend, Cycle, and Fractal Wave). Full version of the book can be found from the link below:
EFW Analytics provide the graphic rich and fully visual trading styles. In default trading strategy, you will be looking at the combined signal from Superimposed pattern + EFW Channel or Superimposed pattern + Superimposed Channel. In addition, you can perform many more trading strategies in a reversal and breakout mode. You can also run two different timeframes in one chart to enforce your trading decision. Sound alert, email and push notification are built inside the indicator.
Below is the link to the EFW Analytics:
https://algotrading-investment.com/portfolio-item/equilibrium-fractal-wave-analytics/
Related Products