Scientific Wave Counting with the Template and Pattern Approach
Elliott Wave theory can be beneficial to predict the market movement if they are used correctly. Junior traders are often fear to use Elliott Wave because their complexity. From my experience, Elliott wave is not a rocket science, anyone can probably learn how to use the technique with some commitment. However, not all the book and educational materials will teach them in the scientific way. If we are just looking at the three rules from the original Wave principle only, then there are definitely some rooms where subjective judgement can play in our wave counting. This makes starters to give up the Elliott Wave practice too quickly. Fortunately, there are some additional tools to overcome the subjectivity in our wave counting. First tool but the most important tool is definitely the three wave rules from the original Wave Principle. They can be used as the most important guideline for the wave counting. Below we describe the three rules:
Rule 1: Wave 2 can never retrace more than 100 percent of wave 1.
Rule 2: Wave 4 may never end in the price territory of wave 1.
Rule 3: Out of the three impulse waves (i.e. wave 1, 3 and 5), wave 3 can never the shortest.
Second tool is the Fibonacci ratio. As in the Harmonic pattern detection, Fibonacci ratio can play an important role in our wave counting because they describe the wavelength of each wave in regards to their neighbouring wave. For example, the following relationship is often found among the five wave of the impulse wave. Depending on which wave is extended among wave one, three and five, the Fibonacci ratios are different. Most of time, the extension of wave 3 is most frequently observed in the real world trading.
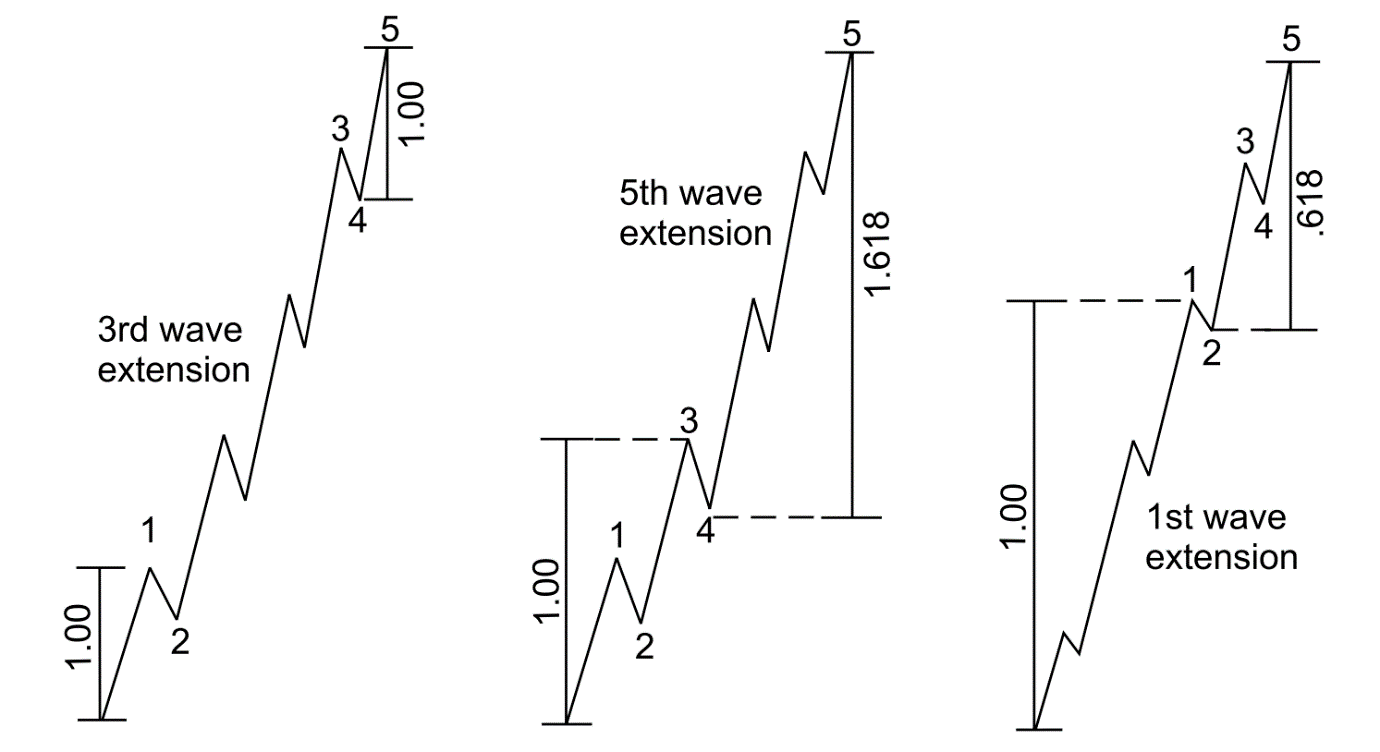
Figure 5-3: Fibonacci relationship of impulse wave structure.
Unless wave 1 is extended, wave 4 often divides five impulse waves into the Golden Section. If the wave 5 is not extended, the price range from the starting point of wave 1 to the ending point of wave 4 make up 61.8% of the overall height of the impulse wave. If wave 5 is extended, then the price range from the starting point of wave 1 to the ending point of wave 4 make up 38.2% of the overall height of the impulse wave. These two rules are rough guideline. Sometime, trader can observe some cases where these two rules are not hold true. Personally, I normally place the Fibonacci ratio relationship in Figure 5-3 before this Golden Section rule. However, the priority between these two rules might depend on the preference of traders.
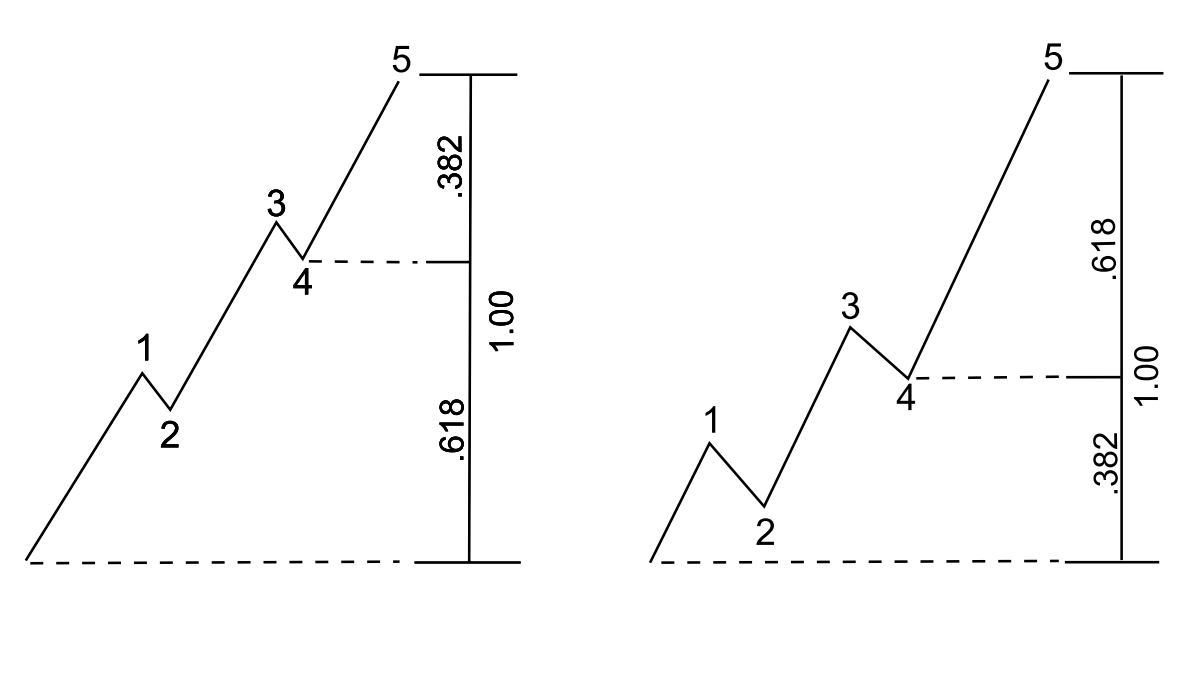
Figure 5-4: Golden Section division rule with wave 4.
For the case of the three waves in the corrective wave, typical Fibonacci ratios are shown in Figure 5-5. The corrective wave is often retrace 61.8% or 32.8% against the size of previous impulse wave. In general, Elliott suggested that corrective wave 2 and wave 4 have the alternating relationship. If wave 2 is simple, then wave 4 is complex. Likewise, if wave 2 is complex, then wave 4 is simple. A “Simple” correction means only one wave structure whereas a “Complex” correction means three corrective wave structures. Furthermore, if wave 2 is sharp correction, then wave 4 can be sideways correction. Likewise, if wave 2 is sideways correction, then wave 4 can be sharp correction.

Figure 5-5: Fibonacci relationship for wave 1 and wave 2 (left) and for wave 3 and wave 4 (right).
Third tool, which can be helpful in overcoming the subjectivity, is using template. Template is a rough wave counting drawn in your chart using some sort of very simple automatic algorithm. Even though, the template does not provide you the perfect counting, the template can be helpful in eliminating thousands of alternative possibilities in first place. We found that this makes the wave counting more accurate and easier. The Peak Trough analysis is one of the good templates to start with wave counting. You can always create your own alternative version of the template if you wish. However, we will stick with the Peak Trough analysis as our basic template in this book. Trader can use both Zig Zag and the modified Fractal indicator for wave counting task. The modified Fractal indicator can show more peaks and troughs for you to work with. However, it is still good approach for your wave counting.
When you combine the three wave rules, Fibonacci ratio and the template, you are not likely to get lost with your counting. Trader can make use of this approach for his daily trading decision too. When you want to count waves, the first thing you need to do is to select the right timeframe showing some countable peaks and troughs. Generally, the peaks and troughs of the larger timeframe must appear in the smaller timeframe. However, the peaks and troughs in the smaller timeframe does not have to appear in the larger timeframe. For example, if you had a peak on daily candle bar with the bar open time 00:00 21 June 2016, this peak must appear in the hourly timeframe or four hourly timeframe. However, the peak of the hourly bar with bar open time 14:00 10 March 2015 does not have to appear in the daily candle bar. In the daily candle bar, it can appear if the peak of the hourly bar with bar open time 14:00 10 March 2015 is the highest high in the day 10 March 2015, otherwise this peak will not appear in the daily candle bar. Larger timeframe tends to reduce the number of the peaks and troughs in your chart making. With long sight of larger timeframe, sometime, counting can be a lot easier. However, larger timeframe might remove some key peaks and troughs from your charts. Therefore, it is important for traders always check both smaller timeframe and larger timeframe. If you are a day trader, then you should at least scan hourly and four hourly and daily charts in your analysis. Sometime, 15 minutes chart can provide valuable trading entry for your day trading too. Adding some odd timeframes like three hourly timeframe in your analysis is optional.
To illustrate the wave counting process, consider the Peak Trough analysis in EURUSD H4 timeframe in Figure 5-6. We have selected H4 timeframe for demonstration purpose only. The Peak Trough analysis provide you some template which you can start your wave counting. In spite of the fact that Peak Trough analysis reveals the important peaks and troughs for your chart, we can see that it does not provide accurate wave counting. Remember that the template serve you to eliminate thousands of alternative possibility, but you still have to perfect your wave counting by yourself. Next step is to find either wave 123 structure or wave abc structure from our analysis. By Labelling the wave 1 and 2 first, we can find that wave 2 retraced back between 0.500 and 0.618 of wave 1. Since we know that next peak offer the multiple of price increase against wave 1, it is possible to guess next peak or the peak after the next peak might be wave 3 (Figure 5-7). As you can see, in the real world application, retracement of wave 2 can come near to the ideal Fibonacci ratio of 0.500 and 0.618. However, it will never be dead accurate most of time.
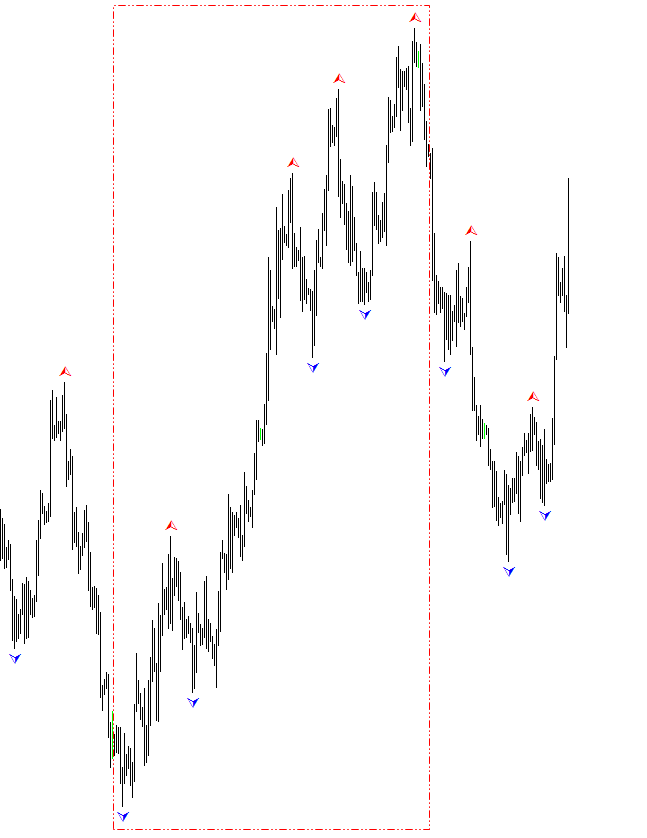
Figure 5-6: EURUSD H4 timeframe with the Peak Trough analysis.
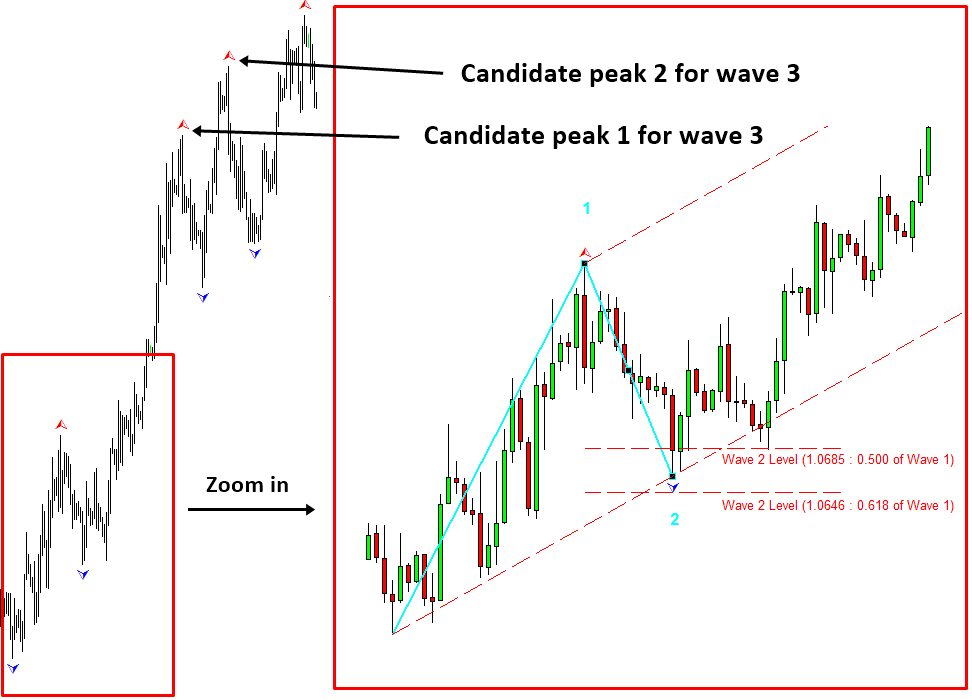
Figure 5-7: Counting wave 1 and 2 on EURUSD H4 timeframe.
To find the wave 3 between the two peaks (Figure 5-7), we have to exam both peaks in this case. When we exam the first candidate peak, we can find that our wave 3 ends near the 1.618 level of wave 1 (Figure 5-8). Our wave 3 ended near the ideal ratio of 1.618 but they are never dead accurate over 1.618. Let us exam the second candidate peak. With second candidate peak, the peak is in fact closer to 2.618 level of wave 1 (Figure 5-9). We cannot determine wave 3 just by comparing the Fibonacci ratios of these two peaks. We can inspect wave 4 and wave 5 in conjunction with wave 3 to support our final decision. With first candidate peak, wave 4 landed very near 0.382 level of wave 3. However, wave 5 is slightly off from 1.000 level of wave 1. With our second candidate peak, wave 4 landed very near to 0.382 level of wave 3. However, wave 5 also landed very close to 1.000 level of Wave 1.
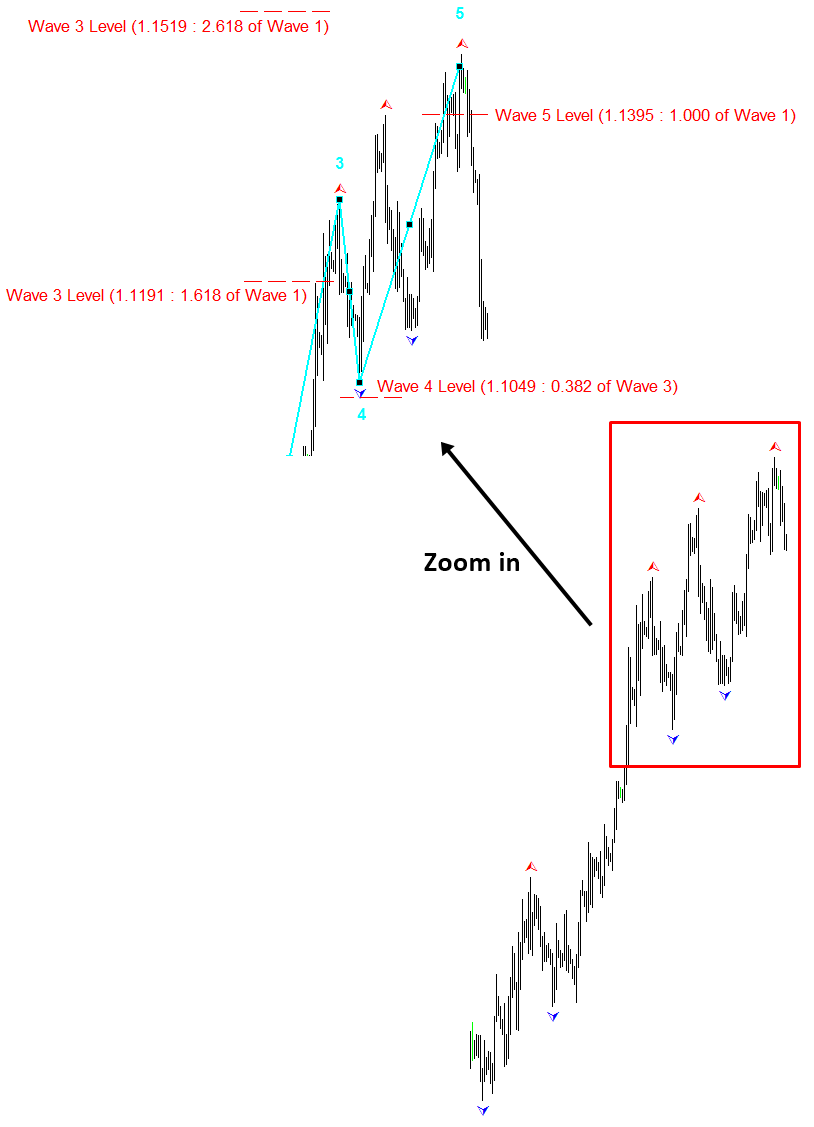
Figure 5-8: Locating wave 3 on first candidate peak on EURUSD H4 timeframe. Ideal level of wave 4 and wave 5 levels were calculated from candidate peak 1.
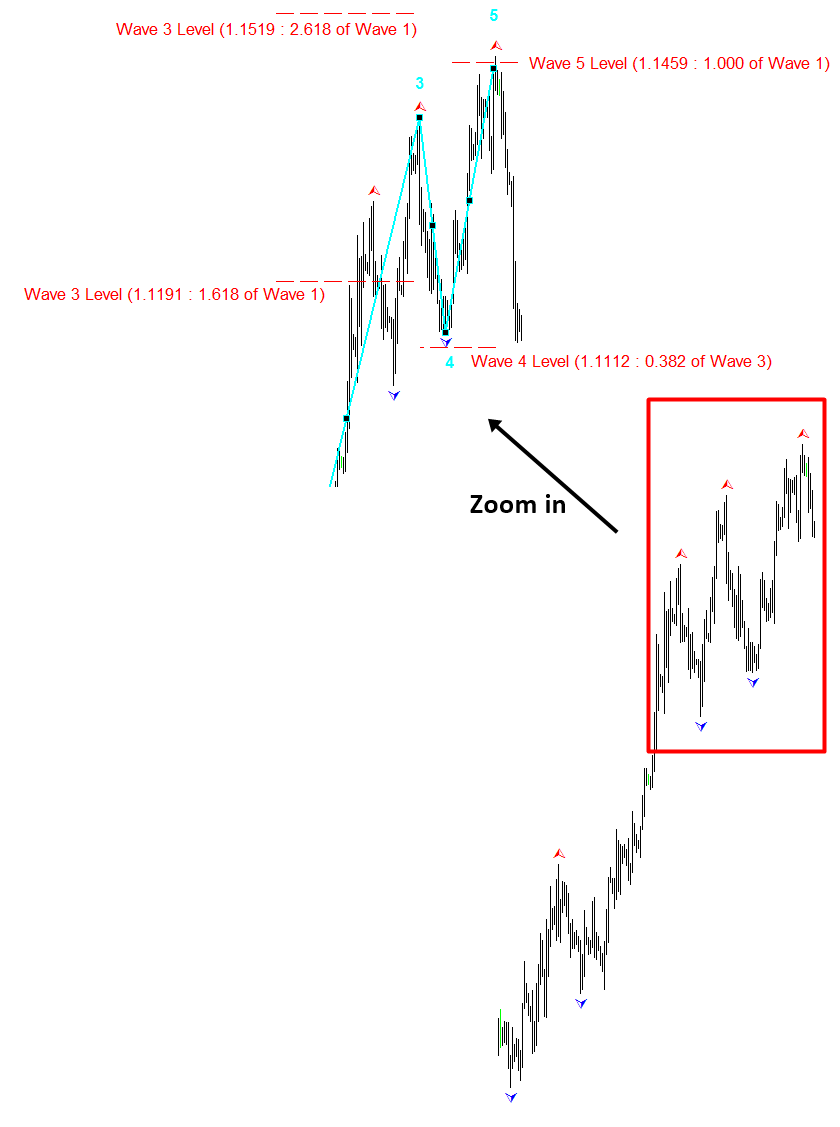
Figure 5-9: Locating wave 3 on second candidate peak on EURUSD H4 timeframe. Ideal level of wave 4 and wave 5 levels were calculated from candidate peak 2.

Figure 5-10: Final counting of five-impulse wave on EURUSD H4 timeframe.
Since the second candidate peak provide better evidence for wave 3, we can conclude this wave counting by labelling wave 3 on the second candidate peak. In addition, we can complete our labelling as shown in Figure 5-10. To sum up the process of wave counting, we list the six summary steps here for trader.
- Apply the Peak Trough analysis.
- Scan through different timeframe to look for key peaks and troughs and define your region of interest in your chart.
- Look for potential candidate peaks and troughs for either wave 123 structure or wave abc structure from your region of interest in your chart.
- Confirm wave 123 or wave abc from the evidences using Fibonacci ratio and three wave rules.
- For wave 123 structure, confirm wave 45 from the evidences using Fibonacci ratio and three wave rules.
- If your candidate peaks and troughs are not supported by the evidence, then reject the peaks and troughs. Move on to next candidate peak and trough and repeat the steps 4 and 5.
Some More Tips about Scientific Wave Counting in Elliott Wave Theory
About this Article
This article is the part taken from the draft version of the Book: Scientific Guide To Price Action and Pattern Trading (Wisdom of Trend, Cycle, and Fractal Wave). This article is only draft and it will be not updated to the completed version on the release of the book. However, this article will serve you to gather the important knowledge in financial trading. This article is also recommended to read before using Price Breakout Pattern Scanner, Advanced Price Pattern Scanner, Elliott Wave Trend, EFW Analytics and Harmonic Pattern Plus, which is available for MetaTrader 4 and MetaTrader 5 platform.
Below is the landing page for Price Breakout Pattern Scanner, Advanced Price Pattern Scanner, Elliott Wave Trend, EFW Analytics and Harmonic Pattern Plus. All these products are also available from www.mql5.com too.
https://algotrading-investment.com/portfolio-item/price-breakout-pattern-scanner/
https://algotrading-investment.com/portfolio-item/advanced-price-pattern-scanner/
https://algotrading-investment.com/portfolio-item/elliott-wave-trend/
https://algotrading-investment.com/portfolio-item/equilibrium-fractal-wave-analytics/
https://algotrading-investment.com/portfolio-item/harmonic-pattern-plus/
Related Products


