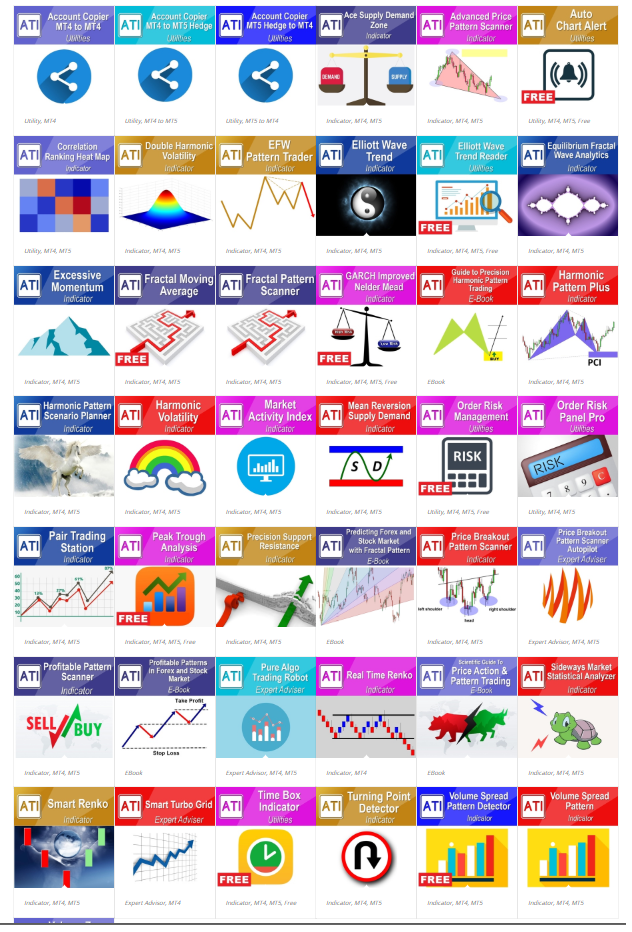
MetaTrader Indicators and Pattern Scanners
This article provides the some details about MetaTrader Indicators and Pattern Scanner that are popular to make buy and sell trading decision. First of all, we explain the concept of Technical Indicator and Pattern Scanner in MetaTrader.
MetaTrader is a popular trading platform used by many Forex traders worldwide. MetaTrader platform provides a wide range of tools and features to help traders analyze the market and make informed decisions. One of the most important tools in MetaTrader is the technical indicator in the form of technical analysis. A technical indicator is a mathematical calculation that uses the price and/or volume of a financial instrument to provide insight into its future direction. Technical indicators are used to identify trends, momentum, volatility, and other key aspects of the market. Technical indicators can be used to generate buy and sell signals, as well as to confirm or refute other technical analysis tools. There are many different types of technical indicators available in MetaTrader, including trend indicators, oscillators, volume indicators, and more. Some popular examples include Moving Average Convergence Divergence (MACD), Relative Strength Index (RSI), and Bollinger Bands.
A pattern scanner is a tool used in MetaTrader to identify specific patterns in the market. The pattern scanner is used to help traders analyze the market and make informed decisions. There are different types of pattern scanners available in MetaTrader, such as harmonic pattern scanners, chart pattern scanners, Fractal Pattern Scanner, and more. For example, a harmonic pattern scanner like Harmonic Pattern Plus and Harmonic Pattern Scenario Planner is an indicator that detects and plots potential harmonic patterns directly on the charts. A harmonic pattern scanner like Harmonic Pattern Plus and Harmonic Pattern Scenario Planner can identify patterns such as Gartley Pattern, Bat Pattern, Cypher Pattern, Butterfly Pattern, and Crab Pattern. Especially, X3 Chart Pattern Scanner is a special type of Harmonic Pattern and Elliott Wave Pattern Scanner that can detect both Harmonic Pattern and Elliott Wave pattern. A chart pattern scanner is another type of pattern scanner that helps traders automatically spot trading patterns and potential opportunities within the financial markets. Chart Pattern Scanner can typically detect symmetrical triangle pattern, rising wedge pattern, falling wedge patterns, double top, double bottom and more.
When you buy our products, you need to consider repainting or non-repainting products. Repainting patterns are only keep successful patterns in the chart. When there is price extension, the failed pattern or penetrated price level will not be kept in the chart. Some traders do not like this repainting behaviour. However, there are still millions of traders uses the repainting products without any problem. Therefore, repainting products are cheaper than non-repainting products. If you can afford, we recommend non-repainting products because they are easier to trade. These products in the table are the most essential MetaTrader Chart Pattern scanners. Depending on your preference, you can use one, two, or all of them. For example, say you want to go for non-repainting products and you want to use all of them. Then buy Ace Supply Demand, Advanced Price Pattern Scanner, and X3 Chart Pattern Scanner. From time to time, some customers mix and match any of our products even across repainting and non-repainting products.
| Type | Repainting | Non Repainting |
| Supply Demand
(Support and Resistance) |
Mean Reversion Supply Demand | Ace Supply Demand |
| Triangle, Wedge Pattern, Head and Shoulder, etc | Price Breakout Pattern Scanner | Advanced Price Pattern Scanner |
| Harmonic Pattern Scanner | Harmonic Pattern Plus
(Harmonic Pattern Scenario Planner) |
X3 Chart Pattern Scanner |
The table below shows the list of the functionality for our main products. We try to list their functionality in brief. However, this is not the exhaust list of functionality for these products. Refer to each product page for more details.
| Mean Reversion Supply Demand | Supply Demand Zone detection + Stop Loss and Take Profit Target + Market Profile + some other features |
| Ace Supply Demand | Supply Demand Zone detection + Stop Loss and Take Profit Target + Market Profile + some other features |
| Price Breakout Pattern Scanner | Detect Triangle, Falling Wedge, Rising Wedge, Double top, Double Bottom, Head and shoulder pattern + 52 Japanese candlestick patterns, + Smart Renko feature + some other features |
| Advanced Price Pattern Scanner | Detect Triangle, Falling Wedge, Rising Wedge, Double top, Double Bottom, Head and shoulder pattern + Multiple timeframe pattern detection + some other features |
| Harmonic Pattern Plus | Over 11 Harmonic Pattern detection + 52 Japanese candlestick pattern + Automatic Channel + Multiple timeframe pattern detection + many other features |
| Harmonic Pattern Scenario Planner | Over 11 Harmonic Pattern detection + Predict future Harmonic Pattern using simulation + Automatic Channel + Multiple timeframe pattern detection + many other features |
| X3 Chart Pattern Scanner | Over 15 Harmonic Pattern + Elliott Wave pattern detection + 52 Japanese candlestick pattern + Advanced Automatic Channel + multiple timeframe pattern detection + many other features |
Below we list other specialized Products which are not listed in our main product list. These are advanced tools too.
- EFW Analytics – Advanced Tool to trade Fractal Wave
- Elliott Wave Trend – Advanced Elliott Wave Pattern Analysis. This is a semi-automatic but exclusive Elliott Wave analysis tool.
- Sideways Market Analyser – Tool to trade Sideways Market.
- Fractal Pattern Scanner – provides the Turning Point Probability across all timeframe. Its trading style includes breakout trading + reversal trading.
- Excessive Momentum indicator – Tool to detect excessive momentum automatically
https://www.mql5.com/en/users/financeengineer/seller#products
https://algotrading-investment.com/technical-indicator-expert-advisor/
Related Products


