Trading Strategy Guide
To help your day trading, we provide the trading strategy guide to achieve good trading performance in Forex and Stock market. We will share the valuable tips to improve your trading performance. Many professional traders recommend combining different technical analysis to confirm your trading entry. To give you some idea on why, let us consider the concept of the perfect information in the context of decision-making. The price of the perfect information is priceless. For example, if we know that tomorrow the share price of Google will rise by 8%, say that this perfect information arrived from the future somehow. How much this information worth for you? With this information, you can invest your entire cash on Google today. Well, if you are smart, then you will even borrow money from your friends and family or even from bank to invest on Google share today because the information is perfect. If you are even smarter, then you will not only trade on the Google share but you will trade on the leveraged derivative products of Google share for even bigger jackpots. At the end of tomorrow, you will close all your positions from your trading. Even if you pay back the borrowed money to your family, friend and banks, you will be still making profits of 1 million US dollar from your investment in just one day.
The value of the perfect information is worthless in the financial market. However, such perfect information is not available to anyone in this world except God. In very few cases, we might encounter the near perfect information in the human world. That is insider trading. However, insider trading is illegal and therefore we will not discuss here. Generally, it is better to assume that the perfect information is not available to us. When we do not have the perfect information on our hands, what can we do for our trading? Well, we have to collect pieces of evidence to form the solid but imperfect information for our decision-making. With imperfect information, outcome of our decision will be subject to probability. Our decision can be correct but sometimes it can be wrong too. Each evidence would add some value towards our decision-making but one piece of evidence will not necessarily reveal the entire market dynamics for your trading. For this reason, we have to collect the multiple of evidences from many different angles for our trading. Technical or fundamental analyses are the evidence-collecting tool for traders. We have to remember that each technical analysis are designed to provide the evidence on the presence of the specific price patterns in the Price Table in the 1st training course.
For this reason, we have to be careful at how we mix and match these evidences to form the solid but imperfect information for our trading. For example, if you want to collect the evidence for the price patterns on the equilibrium process, then you should collect the evidences from the technical analysis designed to detect the price patterns on equilibrium process. Likewise, if you want to collect evidence for the price pattern on the equilibrium Fractal-Wave process, then you should collect the evidences from the technical analysis designed to detect the price patterns on the equilibrium Fractal-Wave process. If you blindly mix two different types of technical analysis, then they will provide you conflicting evidences only. Since this book focus on dealing with the price patterns made up from the equilibrium Fractal-Wave process, we provide some examples of combining different technical analysis to collect the evidence for the equilibrium Fractal-Wave process. In Table 2-1, we provide the list of some possible combination of technical analysis. Since Harmonic Pattern, Price Pattern, Supply Demand Zone and Elliott Wave theory are all designed to deal with the price patterns of Equilibrium Fractal-Wave process, these techniques are relatively easy to combine. The possible combinations are not limited to the list on Table 2-1 only. Trader can even combine three or more analysis together if they are highly confident on the individual techniques.
Trading Strategy Combined:
- Supply Demand Zone + Harmonic Pattern
- Price pattern + Harmonic Pattern
- Elliott Wave Theory + Harmonic Pattern
- Price pattern + Elliott Wave Theory
- Supply Demand Zone + Elliott Wave Theory
- EFW Channel + Harmonic Pattern
Table 2-1: List of the possible combination of different technical analysis where price patterns include Triangle, Wedge, Head and Shoulder, Double Top, Triple Top patterns.
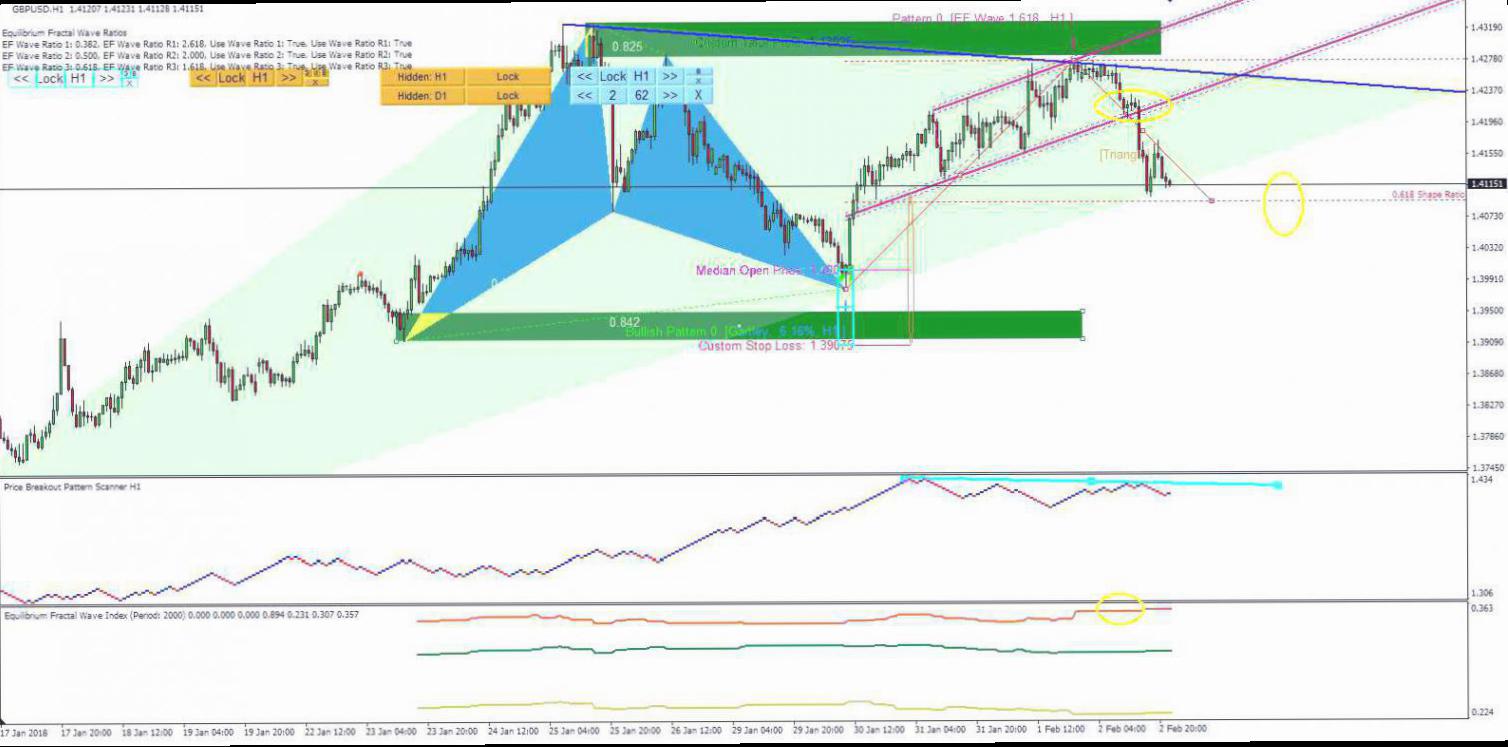
We provide some trading examples of the combined analysis on Table 2-1. For the combined analysis, two or three techniques should agree on the trading direction but they should also provide roughly same entry level. If the recommended entries from each technique are deviated too far, then we do not recommend taking the entry. Most of time, the combination are straightforward when you have mastered the individual trading techniques correctly. Therefore, it is better to stick with the technical analysis you are confident to use. From practical point of view, the combined analysis will increase your trading performance in general.
Forex and Stock Market chart shows always the mixture of rise and fall in price movement. This constant fighting between bull and bear accounts for the formation of small and large Fractal Waves. You will find that all the advanced trading strategies, developed last 100 years, are merely derived from the concept of Fractal Pattern and Fractal Wave. For example, these advanced trading strategies includes the works of R. N. Elliott, H. M. Gartley, R. Shabacker and W.D. Gann nearly 90 years ago. Hence, understanding the Fractal Pattern and Fractal Wave is the key to your successful trading.
Here is some tips to to advance your trading performance.
To use the Fractal Pattern and Fractal Wave, the first and essential step is to understand the concept of Peak Trough analysis. We provide free tools for everyone in MetaTrader and Excel version. All the tools below are free.
1) MetaTrader 4 Version of Peak Trough Analysis
www.mql5.com/en/market/product/23797
2) MetaTrader 5 Version of Peak Trough Analysis
www.mql5.com/en/market/product/22420
3) Peak Trough Analysis from Algotrading-Investment.com
https://www.algotrading-investment.com/portfolio-item/peak-trough-analysis-tool
4) Excel and VBA version of Peak Trough Analysis can be found here
After you understand the peak trough analysis, you will practice these trading techniques.
- Support and Resistance
- Fibonacci Price Pattern including Fibonacci Retracement and Fibonacci Expansion
- Harmonic Pattern
- Triangle, Falling Wedge and Rising Wedge Patterns
- Elliott Wave Pattern Analysis
- X3 Price Pattern
- Turning Point Probability to tackle stochastic cycles
The guide line for the automated and semi automated tools for above trading strategies can be found here.
https://algotrading-investment.com/2020/06/24/metatrader-indicators-and-pattern-scanners/
You can find the articles and Books to guide above trading strategies from here.
https://algotrading-investment.com/2019/07/23/trading-education/
Related Products


