Science Behind Fibonacci Analysis in Forex and Stock Market
In this article, we will focus on the science behind the Fibonacci Analysis in Forex and Stock market in terms of the technical analysis point of view. The Fibonacci sequence is a set of numbers that follow a specific pattern, where each number is equal to the sum of the preceding two numbers 1. Many things in nature have dimensional properties that adhere to the golden ratio of 1.618, a quotient derived from the Fibonacci sequence. Fibonacci analysis is a popular trading strategy used by forex and stock market investors. Fibonacci analysis is based on the mathematical ratios derived from the Fibonacci sequence. The idea behind this Fibonacci strategy is that after a significant price movement up or down, the new support and resistance levels are often at or near the Fibonacci levels. The science behind Fibonacci analysis is based on the mathematical ratios derived from the Fibonacci sequence. These ratios are used to identify potential support and resistance levels in trading. We will explain the Fibonacci Analsis in details here.
1. Introduction to Fibonacci Analysis
A Fibonacci analysis is a popular tool among technical traders. It is based on the Fibonacci sequence numbers identified by Leonardo Fibonacci, the Italian mathematician, in the 13th century. The Fibonacci sequence numbers are:
0, 1, 1, 2, 3, 5, 8, 13, 21, 34, 55, 89,144, 233, 377, 610, 987, 1597, 2584, 4181, 6765, …………………
As the Fibonacci number become large, the constant relationship is established between neighbouring numbers. For example, every time, when we divide the former number by latter: Fn-1/Fn, we will get nearly 0.618 ratio. Likewise, when we divide the latter number by former: Fn/Fn-1, we will get nearly 1.618. These two Fibonacci ratio 0.618 and 1.618 are considered as the Golden Ratio. We can use these Golden ratios to start our Fibonacci analysis. However, many technical traders use additional Fibonacci ratios derived from the Golden ratio.
In fact, Fibonacci pattern analysis in financial trading is extremely popular. As with support and resistance analysis, Fibonacci analysis is probably the most popular technical analysis among traders. There are two important techniques in Fibonacci analysis. First technique is Fibonacci retracement. Second technique is Fibonacci expansion. In fact, former is just one triangle pattern and latter is two triangle patterns. Hence, you can consider these two as Fibonacci price patterns. These two price patterns share the identical concept to the retracement ratio and expansion ratio introduced earlier.
There are two important points in regards to Fibonacci patterns. Firstly, you need to spot swing high and swing low in price series to identify Fibonacci price patterns. The easiest way of doing this is just to apply Peak Trough Transformation using either ZigZag indicator or Renko chart. Therefore, you start with predefined swing points in your chart. Secondly, Fibonacci retracement technique will concern one triangle that is two price swings. Fibonacci expansion technique will concern two triangles that are three price swings. Most importantly, calculation of Fibonacci retracement and expansion is identical to the retracement ratio and expansion ratio calculation in RECF definition. Sometimes, we might use percentage format instead of decimal format. However, two quantities are the same. For example, the Golden ratio 0.618 is the same as 61.8%.
Let us start with Fibonacci retracement example. For simple example, we use 61.8% Golden ratio. For retracement, we can have two cases including bullish (Trough-Peak) retracement and bearish (Peak-Trough) retracement. In bullish retracement, 61.8% retracement level will act as a support level. Price will reverse in the correction phase to follow the previous bullish movement. In RECF pattern definition, 61.8% bullish retracement can be expressed as below:
R0 = 0.618 = Right swing of first triangle / Left swing of first triangle
Likewise, in bearish retracement, 61.8% level will act as resistance. Price will reverse in the correction phase to follow the previous bearish movement. In both case, the 61.8% retracement will be measured by dividing price height of latest swing to price height of previous swing. We have used percentage in this example. Some technical traders prefer to use the ratios in decimal places like 0.618. It is just your preferences. Using ratio or percentage does not affect the accuracy of trading. In RECF pattern definition, 61.8% bearish retracement can be expressed as below:
R0 = 0.618 = Right swing of first triangle / Left swing of first triangle
You can use other Fibonacci ratios like 0.382 or 1.618 in the exactly same way as 0.618. Some traders use secondary Fibonacci ratios in addition to the primary ratios.
Fibonacci expansion is slightly more complicated than Fibonacci retracement because it concerns two triangle (i.e. three price swings). As in retracement technique, we can have two cases including bearish (Trough-Peak) expansion and bullish (Peak-Trough) expansion. In bearish expansion, we will measure the expansion from where the correction ends to next peak. In the next peak, we will expect the bearish reversal in the same direction to the correction. In fact, the 100% Expansion level is act as the resistance. Likewise, in bullish expansion, we will expect the bullish reversal in the same direction to the correction. 61.8% expansion level acts as the support. In RECF pattern definition, 61.8% bearish and bullish retracement can be expressed as below:
E0 = 0.618 = Right swing of first triangle / Left swing of second triangle
2. Structure of Fibonacci Price Patterns
Here we present two commonly used Retracement Patterns and Expansion Patterns. Retracement 0.618 (=61.8%) is the most common Retracement pattern used by trader. In RECF pattern definition, this can be described as single number like below.
R0: 0.618
Retracement 0.382 (=38.2%) is another common Retracement pattern used by trader. In RECF pattern definition, this can be described as single number like below.
R0: 0.382
Expansion 1.000 is the most common Expansion pattern used by trader. In RECF pattern definition, this can be described as single number like below.
E0: 1.000
Expansion 0.618 is another common Expansion pattern used by trader. In RECF pattern definition, this can be described as single number like below.
E0: 0.618
3. Detecting Fibonacci Price Patterns
Here we will present how to detect Fibonacci Price patterns manually. The purpose of this exercise is twofold. Firstly, we want you to be confident with detecting Fibonacci Price patterns. Manual detection of Fibonacci Price pattern is important because this exercise will provide the basis of detecting patterns that are more complex later. For example, if you are not able to detect Fibonacci Price patterns manually, then you cannot progress to the pattern detection for Harmonic patterns, Elliott Wave patterns and X3 patterns in next chapter. Hence, make sure that you attempt to detect Fibonacci Price patterns following the steps here. Secondly, we want you to develop the intuition behind the RECF pattern notation, where REFC stands for Retracement ratio (R), Expansion ratio (E), Closing Retracement ratio (C), and Factored expansion ratio (F). More you practice with Fibonacci Price pattern detection, you will get more intuitive connection between overall pattern shape and RECF pattern notation.
In practice, you do not have a lot of time to detect patterns. Hence, you can use an automated pattern scanner if you want to detect patterns that are more complex. However, the automated pattern scanner is not necessarily the magical tool for everyone. The automated pattern scanner is only profitable if you understand the process of pattern detection and the pattern structure.
Hence, you have to make some efforts of familiarizing yourself with the price patterns even before you are trying to use the automated pattern scanner. The confidence and familiarization on these patterns only comes from good training. Fibonacci Price patterns are the simplest form of the price patterns introduced in this book. It is much simpler in comparison to Harmonic Pattern, Elliott Wave pattern and X3 patterns. Therefore, we recommend you to keep practice with Fibonacci Price patterns before you want to use Harmonic Pattern, Elliott Wave patterns and X3 pattern. So let us start with simple Fibonacci Price pattern first. R0: 0.618 is the 61.8% Fibonacci Retracement.
R0: 0.618
In order to detect 61.8% Fibonacci Retracement (=R0: 0.618), we will need to apply peak trough analysis first in our chart. Use our Peak Trough Analysis provided for MetaTrader 4 and MetaTrader 5. Once, you have applied it, it will show you peaks and troughs in your chart. You can compare chart without and with Peak Trough Analysis. You would immediately notice that peak trough analysis improves readability of chart in terms of pattern detection. We need to pick three points to make our prediction. Once three points are detected, you need to measure the ratio of these three points. Simply speaking, what the Fibonacci Retracement 61.8% means that the height of P0 and P1 is 61.8 % shorter than the height of P1 and P2. For example, if the height of P1 and P2 is 200 pips in EURUSD, the height of P0 and P1 is 123.6 pips. Mathematically, you can express Fibonacci Retracement 61.8 like below:
R0: 0.618 = Abs (P0 – P1) / Abs (P1 – P2), where Abs stands for absolute value and P stands for Price (i.e. P0 = Price 0, P1 = Price 1, P2 = Price 2).
To check the ratio, you might need some calculator. However, the modern electronic trading platform provides the Fibonacci Retracement Chart Object. You can simply drag and drop the Fibonacci Retracement Chart Object to your chart after you have picked up three points. Then you can immediately notice if price is located on which Fibonacci Retracement. Hence, detecting Fibonacci Retracement is much simpler in modern trading platform. However, do not forget that the Chart Object is doing the calculation for you. It is not necessarily skipping the calculation. For simplicity, we used Fibonacci Retracement Chart Object provided from MetaTrader. We recommend you to check the two height with your own calculation as the part of exercise. For this purpose, use Excel Spreadsheet.
Here is the summary of steps of Detecting Fibonacci Retracement.
• Step 1. Applying Peak Trough Analysis in your chart
• Step 2. Pick three points P0, P1 and P2.
• Step 3. Calculate height of right swing = Abs (P0 – P1)
• Step 4. Calculate height of left swing = Abs (P1 – P2)
• Step 5. Check the Ratio = height of right swing / height of left swing
At step 5, the calculated ratio might not match with any known Fibonacci Retracement ratio like 0.382, 0.500, 0.618, or 1.618, etc. In such case, these three points are not qualified as the good Fibonacci Retracement pattern. Next, we will demonstrate how to detect Fibonacci Expansion pattern. E0: 1.000 is the 100% Fibonacci Expansion. They look like below in the schematic diagram.
E0: 1.000
Detection of Fibonacci Expansion patterns is similar to the detection of Fibonacci Retracement. In my opinion, a Fibonacci Expansion pattern is slightly more complicated. For an example, we will show you how to detect 100% Fibonacci Expansion pattern (E0: 1.000).
E0: 1.000 = Abs (P0 – P1) / Abs (P2 – P3), where Abs stands for absolute value and P stands for Price (i.e. P0 = Price 0, P1 = Price 1, P2 = Price 2, P3 = Price 3).
Only difference from Fibonacci Retracement detection is that we are using the swing height of P2 and P3 instead of P1 and P2.
In order to detect Fibonacci Expansion pattern in our chart, we will need to start with peak trough analysis too. Then you follow the steps below:
• Step 1. Applying Peak Trough Analysis in your chart
• Step 2. Pick four points P0, P1, P2 and P3.
• Step 3. Calculate height of right swing = Abs (P0 – P1)
• Step 4. Calculate height of left swing =Abs (P2 – P3)
• Step 5. Check the Ratio = height of right swing / height of left swing
One thing you have to understand with Fibonacci Price pattern detection is that it is trial and error based process. Detection of good Fibonacci Retracement and Expansion pattern require several trials and errors. For the task, Peak Trough Analysis tool will always provide you the great help in reducing amount of work. Download link of Peak Trough Analysis tool is shown below “About This Book” section. Hence, please download it if you have not downloaded yet. There is another important point about trading with Fibonacci Price pattern. Typically, trader does not trade with Fibonacci Price pattern alone. They will use secondary confirmation together with Fibonacci Price pattern. Since the same point is shared among Fibonacci Price patterns, Harmonic patterns, Elliott Wave patterns and X3 patterns, we will provide you details on secondary confirmation in the separate chapter later.
4. Trading with Fibonacci Price Patterns
Fibonacci Price patterns are the simplest form of price pattern, which predicts turning point. With advantage of being simple, it is probably one of most popular tools used among trader. When you are trading with Fibonacci Price patterns, you have to watch out few points. The most important point is, of course, the choice of Fibonacci ratio. Fibonacci ratios can be derived from primary ratio in various way. When you derive too many Fibonacci ratios, then there could be too many choices. It is important to keep few ratios only for your trading. For example, my favourite ratios are 0.382, 0.500, 0.618, and 1.000 if I have to choose some ratios between 0.0 and 1.0. However, one can readily extend these number to 0.236 (=0.618×0.618×0.618) or 0.146 (=0.618×0.618×0.618×0.618) or 0.786 (=square root of 0.618), etc. It is not nice to have too many ratios packed. Try to keep few ratios only. People prefer the primary ratio like 0.618 and 1.618. These two numbers are often top priority. After these two numbers, you might add two or three more ratios to trade. However, this does not mean that only few ratios are used to construct Elliott wave patterns, Harmonic patterns, or X3 patterns. This advice only applies when you are trading with Fibonacci price pattern.
Another important point is that Fibonacci price pattern can be used to identify the opportunity in both continuation and major reversal case. In continuation case, Fibonacci retracement will provide the opportunity after correction. For example, 50% Fibonacci Retracement pattern provides opportunity at the correction phase of long-term sell trend.
Fibonacci Price pattern appears at major turning point too. 61.8% Fibonacci retracement picked up one of the major turning point in EURUSD daily chart. As we have discussed in previous chapter, picking up the turning point at major reversal area is a rare opportunity. Although this opportunity can provide the great profitable range with small risk, chances of picking up such an opportunity correctly is very low too comparing to the continuation case.
Fibonacci Expansion pattern can provide an opportunity to trade at both continuation and major reversal case too. With Fibonacci Expansion pattern, you have to pick up four points. This requires the different starting position for counting points from Fibonacci Retracement pattern. When you are only trading with Fibonacci Price pattern, it is always good to check Fibonacci Expansion with the fourth point (i.e. P3) after checking Fibonacci Retracement with first three points (i.e. P0, P1 and P2). Typically, Fibonacci Expansion requires more practice to master in comparison to Fibonacci Retracement. We provide Fibonacci Expansion pattern example in Stock market. As before, 61.8%, 100% and 161.8% are the good ratios for Fibonacci Expansion.
Although the Fibonacci Analysis are the key to successful trading, no book or article will really pin down the science behind the Fibonacci Analysis. The book: Science Of Support, Resistance, Fibonacci Analysis, Harmonic Pattern, Elliott Wave and X3 Chart Pattern (In Forex and Stock Market Trading) is exactly the book dedicated for this topic. This book will tell you the untold story of the Fibonacci Analysis, which will become the valuable wisdom for Forex and Stock market trading.
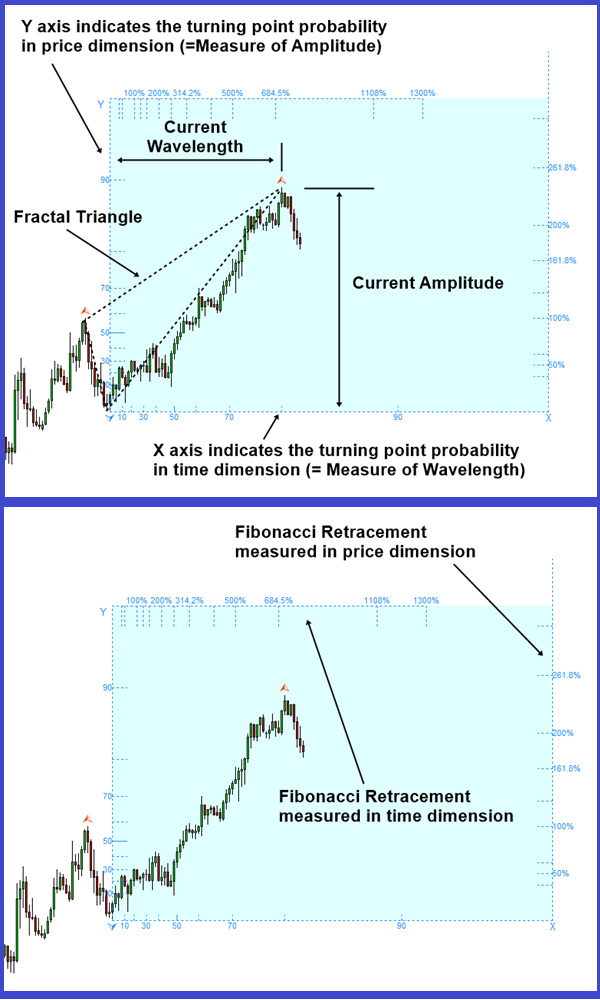
Understanding the scientific principle always help you to bring it further than other traders. In this book, we shows the Fibonacci Retracement in price dimension and Fibonacci Retracement in time dimension. Using the Fibonacci-Probability Graph, you will find the ways to combine the turning point probability with the Fibonacci Retracement in price dimension and Fibonacci Retracement in time dimension.
The book can be found in all the major book distributors in the world. Please choose the best book distributor you like from the link below including amazon.com, Google Play Book, scribd.com, Apple Book and so on.
https://play.google.com/store/books/details?id=MME3EAAAQBAJ
https://www.amazon.com/dp/B0993WZGZD
Fibonacci-Probability graph is exclusively available from Fractal Pattern Scanner in MetaTrader 4 and MetaTrader 5. It could be used to identify the turning point and breakout opportunity. Below is the landing page for Fractal Pattern Scanner in MetaTrader version.
https://www.mql5.com/en/market/product/49170
https://www.mql5.com/en/market/product/49169
https://algotrading-investment.com/portfolio-item/fractal-pattern-scanner/
Related Products


