Science Behind Support and Resistance
In this article, we will cover support and resistance used in Forex and Stock market from the scientific point of view. Have you ever thought what is the underlying science for Support and Resistance ? Without understanding the science of support and resistance, how can you improve your trading with support and resistance ? Although the support and resistance are the key to successful trading, no book or article will really pin down the science behind the support and resistance. The book: Science Of Support, Resistance, Fibonacci Analysis, Harmonic Pattern, Elliott Wave and X3 Chart Pattern (In Forex and Stock Market Trading) is exactly the book dedicated for this topic. This book will tell you the untold story of the support and resistance, which will become the valuable wisdom for Forex and Stock market trading.
First of all, when we want to improve anything in our life, it often requires to understand the science behind the subject. Likewise, the scientific understanding of the support and resistance can improve our practical trading marginally. The book will provide the intertwined illustration between trading strategy and the scientific theory. In addition, the book will also provide the many chart examples along with many useful contents towards your practical trading. We recommend reading this book as the first guide for every trader and investor in Forex and Stock market.
The book can be found in all the major book distributors in the world. Please choose the best book distributor you like from the link below including amazon.com, Google Play Book, scribd.com, Apple Book and so on.
https://play.google.com/store/books/details?id=MME3EAAAQBAJ
Introduction to Support and Resistance
Support and resistance are one of the price patterns derived from the fractal wave in forex and stock market. They are the basic but powerful price patterns identifiable with the peak trough transformation. Support and resistance do not require the ratio analysis. Hence, they are relatively easier to identify in the chart. In return, this might be more prone to subjectivity comparing to other ratio based price patterns. In spite of its disadvantage, we recommend learning support and resistance for any level of traders. It is because they helps to improve your trading strategy marginally for the little cost. You can often use the support and resistance as the secondary confirmation to confirm your trading direction. For example, support and resistance can improve the trading performance of value investing, fundamental analysis and Pairs trading. At the same time, the support and resistance can improve the trading performance of other price patterns like Fibonacci analysis, Harmonic Pattern, Elliott Wave Theory and X3 Chart Pattern too. We could have few different types of support and resistance. For example, depending on the angle of the line, we can have the horizontal and diagonal support and resistance. Especially, the popular price patterns like a triangle, rising wedge, falling wedge and channel patterns are considered to be the extension of the support and resistance as they are produced from the combination of one support and one resistance line.
1. Horizontal Support and Resistance
Support is the price level at which buying is stronger than selling. Hence, the declining of the price below the support levels is often refused. Typically, support level is located below the current market price. Likewise, resistance is the price level at which selling is stronger than buying. Hence, the rising of the price above the resistance level is often refused. Typically, the resistance level is located above the current market price. In fact, several support and resistance techniques are the geometric pattern recognition derived from the fractal wave analysis. However, not all the support resistance techniques are the same cases. For example, some textbook will introduce the pivot analysis as the kind of the support and resistance tool. However, consider how to derive the pivot levels from the standard pivot calculation equations below:
• Pivot Point (P) = (High + Low + Close)/3
• Support 1 (S1) = (P x 2) – High
• Support 2 (S2) = P – (High – Low)
• Resistance 1 (R1) = (P x 2) – Low
• Resistance 2 (R2) = P + (High – Low)
Where High, Low and Close are the High, Low and Close of the previous candle bar.
In the equation, the median price, which is the pivot point, of the previous candle bar is calculated first. Then the median price is used to derive the support and resistance 1 and 2. This pivot analysis has nothing to do with the geometric pattern recognition. It rather uses the concept of averaging and volatility. One can extend the standard pivot analysis with Fibonacci ratio. However, the extended pivot analysis is still not the geometric pattern recognition either.
When we say the support and resistance in the geometric pattern or chart pattern recognition, we are talking about identifying support and resistance line by connecting peak to peak or by connecting trough to trough in our chart. After the peak trough transformation is applied, the support line can be identified by connecting two or more number of troughs aligned horizontally. Conservative approach is connecting more than three troughs aligned horizontally. Price can make either a turning point or breakout around the support line. It is the area where the market energy is converging before exploding. With this potentially high energy, the support line often serves as an efficient trading entry as well as an exit. Whenever we recognize the important support line, we need to actively think about the market timing as well as the position size.
For example, the chart below shows the support line example on GBPUSD H4 timeframe. By connecting three troughs, we could identify the support line and we can project the price level by extending it horizontally. When the price was approaching to the support line fourth time, the price made a turning point. However, it is possible that we can have the support predicting the breakout movement instead of the reversal. For example, the USDJPY chart below in H4 timeframe penetrated through the support making the sell breakout on its fourth touch. After the breakout, the price could make a reversal toward the support line before making another downward movement.
Now let us have a look at the resistance example. We can identify the important resistance line by connecting peak to peak. After the peak trough transformation is applied, the resistance line can be identified by connecting two or more number of peaks aligned horizontally. Conservative approach is connecting more than three peaks aligned horizontally. Price can make either a turning point or breakout around the resistance line. It is the area where the market energy is converging before exploding. With this potentially high energy, the resistance line often serves as an efficient trading entry as well as an exit. Whenever we recognize the important resistance line, we need to actively think about the market timing as well as the position size.
For example, the chart below shows the resistance example on GBPUSD H4 timeframe. By connecting three peaks, we could identify the important resistance line and we can project the price level by extending it horizontally. When the price was approaching to the resistance line fourth time, the price made a turning point.
As in the support example, it is possible to have a breakout around the resistance line too. For example, the EURUSD chart below made a clean breakout on its seventh touch on the resistance line. After the breakout, the price could make a reversal toward the resistance line before making another upward movement.
2. Diagonal Support and Resistance
Diagonal support and resistance shares the identical concept to the horizontal support and resistance. Diagonal support and resistance line are also called as the trend line. Diagonal support and resistance are also the price pattern derived from fractal wave analysis. When the connected peaks and troughs provide the diagonal slope rather than the horizontal line, the slope can be considered as the diagonal support and resistance. However, there can be more variations comparing to the horizontal case.
When price is rising, either ascending diagonal support or ascending diagonal resistance can be formed. After the peak trough transformation is applied, the diagonal support line can be identified by connecting two or more number of troughs aligned diagonally. Conservative approach is connecting more than three troughs aligned diagonally. Price can make either a turning point or breakout around the support line. It is the area where the market energy is converging before exploding. With this potentially high energy, the support line often serves as an efficient trading entry as well as an exit. If the bullish momentum is strong, then the price can make a turning point at the support line to move in the bullish direction.
On the other hands, if price come down below the support line, it can trigger sell breakout. After sell breakout, the price can make a retracement towards the support line. However, if the strength of the breakout is high, then price can continue to the bearish trend.
After the peak trough transformation is applied, the diagonal resistance line can be identified by connecting two or more number of peaks aligned diagonally. Conservative approach is connecting more than three peaks aligned diagonally. Price can make either a turning point or breakout around the resistance line. It is the area where the market energy is converging before exploding. With this potentially high energy, the resistance line often serves as an efficient trading entry as well as an exit. If the bullish momentum is weak, then the price can make a turning point at the resistance line to show the declining momentum.
On the other hands, if price move above the resistance line, it can trigger buy breakout. After buy breakout, the price can make a retracement towards the resistance line. However, if the strength of the breakout is high, then price can continue to the bullish trend.
When price is falling, either descending diagonal support or descending diagonal resistance can be formed. After the peak trough transformation is applied, the diagonal support line can be identified by connecting two or more number of troughs aligned diagonally. Conservative approach is connecting more than three troughs aligned diagonally. Price can make either a turning point or breakout around the support line. It is the area where the market energy is converging before exploding. With this potentially high energy, the support line often serves as an efficient trading entry as well as an exit. If the bearish momentum is declining, then the price can make a turning point at the support line to move in the bullish direction.
On the other hands, if price come down below the support line, it can trigger sell breakout. After sell breakout, the price can make a retracement towards the support line. However, if the strength of the breakout is high, then price can continue to the bearish trend.
After the peak trough transformation is applied, the diagonal resistance line can be identified by connecting two or more number of peaks aligned diagonally. Conservative approach is connecting more than three peaks aligned diagonally. Price can make either a turning point or breakout around the resistance line. It is the area where the market energy is converging before exploding. With this potentially high energy, the resistance line often serves as an efficient trading entry as well as an exit. If the bearish momentum is rising, then the price can make a turning point at the resistance line to move in the bearish trend. On the other hands, if price move above the resistance line, it can trigger the buy breakout. After the buy breakout, the price can make a retracement towards the resistance line. However, if the strength of the breakout is high, then price can continue to the bullish trend.
Support is the price level at which buying is stronger than selling. Hence, the declining of the price below the support levels is often refused. Typically, support level is located below the current market price. Likewise, resistance is the price level at which selling is stronger than buying. Hence, the rising of the price above the resistance level is often refused. Typically, the resistance level is located above the current market price. In fact, several support and resistance techniques are the geometric pattern recognition derived from the fractal wave analysis. However, not all the support resistance techniques are the same cases.
When we say the support and resistance in the geometric pattern or chart pattern recognition, we are talking about identifying support and resistance line by connecting peak to peak or by connecting trough to trough in our chart. After the peak trough transformation is applied, the support line can be identified by connecting two or more number of troughs aligned horizontally. Conservative approach is connecting more than three troughs aligned horizontally. Price can make either a turning point or breakout around the support line. It is the area where the market energy is converging before exploding. With this potentially high energy, the support line often serves as an efficient trading entry as well as an exit. Whenever we recognize the important support line, we need to actively think about the market timing as well as the position size.
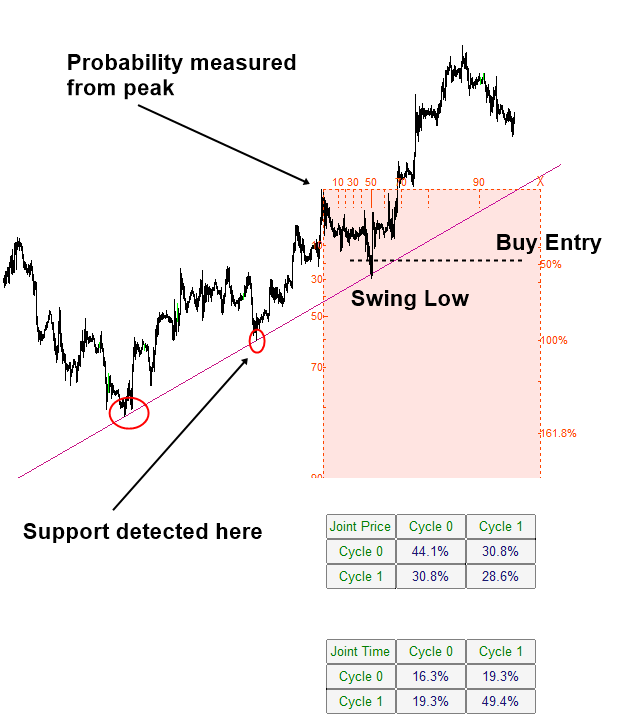
After understanding the science, we can improve your support and resistance trading of course in many different ways. One way we did it was to combine the turning point probability and trend probability with support and resistance. The direct representation of its principle can be found from our Fractal Pattern Scanner. You have the full access to the turning point probability and trend probability from Fractal Pattern Scanner to improve your support and resistance trading. Please have a look at the indicator.
Below is the landing page for Fractal Pattern Scanner in MetaTrader version.
https://www.mql5.com/en/market/product/49170
https://www.mql5.com/en/market/product/49169
https://algotrading-investment.com/portfolio-item/fractal-pattern-scanner/
Related Products


