Identify the Best Buy and Sell Timing in Forex
The best time to buy and sell currency in Forex market depends on some factors, such as economic condition, market volatility, trading strategy, etc. However, in general, to trade when the market is most active is considered as a good strategy. The active market happens usually when the market hours overlap between different sessions. For example, the following list of time schedule provides you the information, when are good time to trade some currency. In fact, you can use this information together with your technical analysis.
- 1 pm to 4 pm (GMT) when both New York and London markets are open. This window has the heaviest volume of trading and offers the best trading opportunities for major currency pairs, especially those involving the US dollar, the British pound, and the Euro.
- 12 am to 7 am (GMT) when both Tokyo and Sydney markets are open. This window is less volatile than the New York/London overlap, but still offers opportunities to trade Asian currencies, such as the Japanese yen, the Australian dollar, and the New Zealand dollar.
- 3 am to 4 am (GMT) when both Tokyo and London markets are open. This window is also less active than the New York/London overlap, but can be a good time to trade the EUR/JPY pair, as well as other European and Asian currencies.
To trade on active market is essential if you want to become a profitable trader. However, there is one more thing to consider. That is the market cycle, another but most important dimension we must think of to get profit ahead of other traders. Trading is practical. We trade to make the profits from our trading. Hence, if you are a trader, the most important question to ask is “How do you make profits by trading?”. Say that you and your friend bought the same stock. However, your result can be completely different from your friend. Even if both of you bought the same stock, you could still lose money whereas your friend made money. What makes the difference between you and your friend? It is the entry timing. In another words, the most important factor behind the successful trading is to know the best entry in our trading. This timing question is something that every trader should and must ask. In fact, we can formulate the answer to this question from the market cycle point of view. The simple answer is that this image can visualize such a winning opportunity.
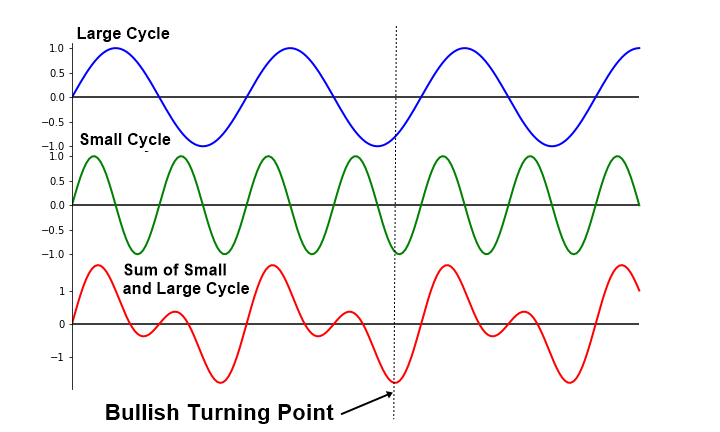
Figure 5-1: Conceptual drawing to demonstrate best buy entry
Say that EURUSD or Bitcoin have the large cycle and small cycle. Your best buy opportunity will be in the area where both small and large cycles are boosted together shown as the dotted line in the image. That is the thin intersection where both short term trader and long term trader are jumping in together. However, this is where most of average traders are stop thinking beyond. There is one problem in this image although its concept is perfectly sound. The problem is that the market does not have the regular cycle, which we can track its peak and trough with fixed time interval as in the sine curve of the Physics text book. Hence, this image is only educational to conceptualize the best buy entry. If it was like that, the money making in Forex or Stock market would have been so much easier buying EURUSD on Monday low and selling at Friday high something like this or similar. In fact, what makes us hard is that the market cycle is not regular but it is stochastic.
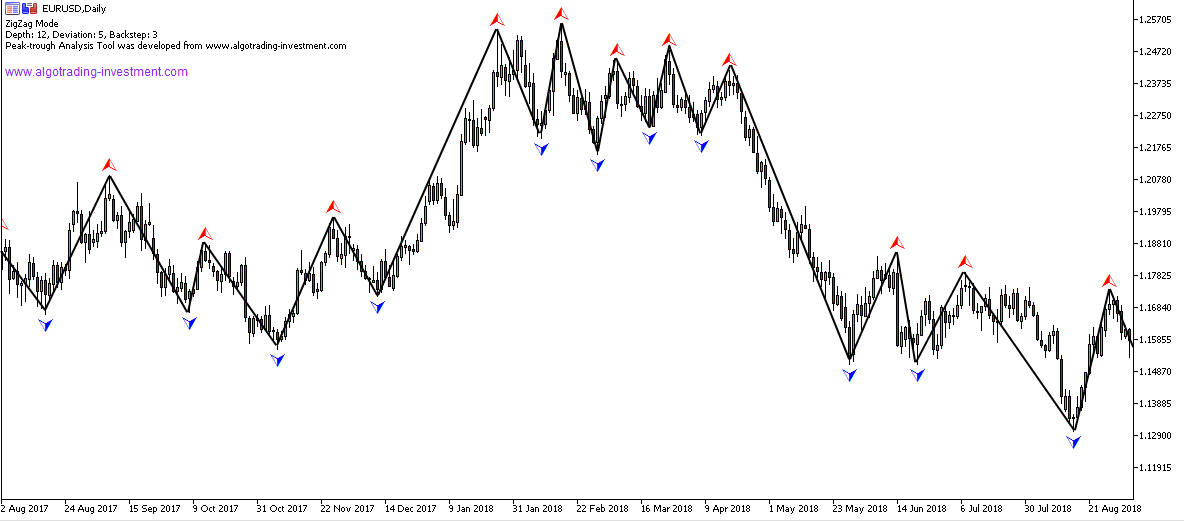
Figure 5-2: Market cycle in EURUSD D1 timeframe
Market cycle is irregular. Sometimes, price moves in slow cycle and sometimes price moves in fast cycle. Sometimes price swings around big amplitude and sometimes price swings around only small amplitude. It is the observations we can make every day in Forex and Stock market, the fuzzy and dirty cycles instead of the clean sine curve. Hence, any technical analysis that does not consider this uneven and rough surface of the market is not effective to predict the market.
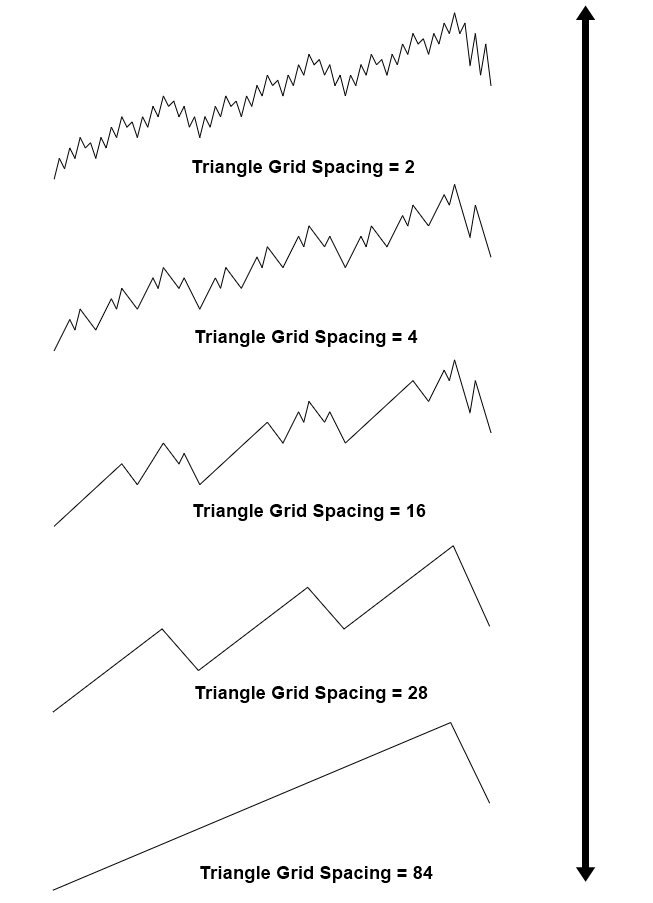
Figure 5-3: Fractal cycle demonstration
The good news is that understanding the fractal wave can help us to predict the market tremendously. It is because fractal wave is the tool that is theoretically designed to work with price data with many uneven cycles. Unlike the fractal wave, many other tools will suffer more with more number of uneven cycles in the price data, for example, like the normal distribution and other cyclic methods designed to operate with regular cycles. Hence, fractal wave is the best tool to predict the fuzzy and dirty cycles in Forex and Stock market. Theoretically, it is one of the best tool to model stochastic cycles in the Forex and Stock market too. The peak trough analysis is the important first step as it visualizes the fuzzy and dirty cycles in the readable form for us. Therefore, the technical analysis making good use of this peak trough analysis is the important tool to predict the market.
Now going back to the entry timing question, how can we catch the moment where the small and large cycles are boosted together using the technical analysis? Although the technical analysis is the good tool to predict the stochastic cycle, it still does not imply that they are designed to capture the multiple cycles. In fact, the answer is pretty straightforward. Catching the timing where the small and large cycles are boosted together can be done by combining two or more techniques to gauge your entry instead of just using one single technique. Combining two or more technical analysis is a good trading strategy as in practice we might need to capture the intersection for more than two cycles. Technically speaking, when you use multiple techniques, you have a high chance to capture the best entry.
In addition, using two or more chart timeframe could add some value to improve your trading performance too. Good mixture of the technical analysis and the chart timeframe will yield the fruitful results. Hence, if you want to become a successful trader, then training and practice are a must requirement. Here is one final note. As the market consists of the probabilistic cycles, your outcome is not going to be bullet proof. Therefore, you should trade with the high probability setup. You need to understand that trading is about quality and not about quantity. In addition, identifying the best sell entry is exactly the same as identifying the best buy entry. We just need to look for the intersection where both small and large cycles are falling together using the two or more technical analysis.
About this Article
This article is the part taken from the draft version of the Book: Technical Analysis in Forex and Stock Market (Supply Demand Analysis and Support Resistance). Full version of the book can be found from the link below:
https://algotrading-investment.com/portfolio-item/technical-analysis-in-forex-and-stock-market/
You can also use Ace Supply Demand Zone Indicator in MetaTrader to accomplish your technical analysis. Ace Supply Demand Zone indicator is non repainting and non lagging supply demand zone indicator with a lot of powerful features built on.
https://www.mql5.com/en/market/product/40076
https://www.mql5.com/en/market/product/40075
https://algotrading-investment.com/portfolio-item/ace-supply-demand-zone/
Below is the landing page for Optimum Chart (Standalone Charting and Analytical Platform).
https://algotrading-investment.com/2019/07/23/optimum-chart/
Related Products


