Advanced Supply Demand Zone Indicator
Advanced Supply Demand Indicator relies on the quantity mismatching between buying and selling volumes in the financial market. For example, Advanced Supply Demand Indicator can identify the zones on the chart where demand is greater than supply ( = the demand zone), driving the price up or where supply is greater than demand ( = the supply zone), driving the price down. In fact, the zones are another price pattern that exhibts fractal wave in the price data. Hence, one important aspect of understanding the supply demand trading is to find the entry and exit in the market rhythm made up from the price swings. Supply Demand indicator can be used for both trading style:
1. Predict Market Direction by identifing the wave structure (= Drop Base Rally, Rally Base Drop, Rally Base Rally, Drop Base Drop)
2. React to Market as in support and resistance trading (= breakout or reversal trading)
Trading Strategy Guide for Advanced Supply Demand Zone
The trading strategy guide for the advanced supply demand trading can be fround from the Book: Technical Analysis in Forex and Stock Market (Supply Demand Analysis and Support Resistance, 2021). This book will explain the wave structure for the following price patterns:
- Drop Base Rally pattern
- Rally Base Drop pattern
- Rally Base Rally pattern
- Drop Base Drop pattern
Above four supply demand patterns are useful when you want to trade them with certain direction either bull or bear.
In the practical trading, the supply and demand analysis involves identifying two key areas where supply is greater than demand (= supply zone) and where demand is greater than supply (=demand zone). Identifying the two key areas are done by looking at the price pattern. For example, supply zone is identified where the price drops at high speed from peak. Likewise, the demand zone is identified where the price rise at high speed from trough.
In this book, I introduced this supply and demand analysis for two reasons. Firstly, the supply and demand analysis is simple and straightforward. There is nothing wrong with simple strategy as long as they are effective. Secondly, this is another trading strategy to predict the fractal wave in Forex and Stock market. In another words, this trading strategy is a good demonstration on how to predict fractal wave (i.e. market cycle) for the starter using the peak trough analysis.
Supply and demand analysis is comparable to support and resistance. Broadly speaking, supply and demand analysis can be considered as the support and resistance up to some extent. However, there are some differences between them. Firstly, support and resistance on their own are more or less volatility prediction tool. In another words, they predict the price level with potential high volatility. However, supply and demand analysis with the pattern recognition provides the direction to trade. For example, depending on the price pattern, the supply and demand analysis predicts the bullish or bearish movement. Secondly, support and resistance use the line whereas the supply and demand analysis use the key area, which is the price range between two prices. In spite of these two differences, there are some cases where supply and demand zone are formed in the similar way as the support and resistance. Hence, there could be some theoretical debate on using the supply and demand analysis as the support and resistance. However, this might be the interesting extension for the supply and demand analysis. Hence, we will discuss about this point in the later chapter of this book.
Now, let us have a look at the main elements of the supply and demand analysis. Supply and demand analysis involves identifying the price pattern. It is much easier to identify these price patterns with peak trough analysis as they can suggest the good entry and exit price at the top or bottom of the price cycle. In supply and demand analysis, we could perform two types of trading including reversal trading and continuation trading. In reversal trading, the price pattern for buy entry is called drop base rally pattern. The base is the short rest located between two strong movements. Typically, the base consists of few to several candle bars. In fact, the drop base rally pattern looks quite similar to double bottom pattern. If you find hard to recall the shape of the drop base rally pattern, you might recall the shape of double bottom pattern. However, the buy entry for the drop base rally pattern can be considered when the price touches the demand zone. In addition, the drop base rally pattern uses the demand zone to set the sensible size of price target and stop loss easier. These are the two important advantages for your trading over the typical trading with the double bottom pattern.
In reversal trading, the price pattern for sell entry is called rally base drop pattern. The base is the short rest located between two strong movements. Typically, the base consists of few to several candle bars. As you might guess, the rally base drop pattern looks similar to double top pattern. If you find hard to recall the shape of the rally base drop pattern, you might recall the shape of double top pattern. However, the sell entry for the rally base drop pattern can be considered when the price touches the supply zone. In addition, the rally base drop pattern uses the supply zone to set the sensible size of price target and stop loss easier. These are the two important advantages for your trading over the typical trading with the double top pattern.
In continuation trading, the price pattern for buy entry is called rally base rally pattern. It is the key point to observe two sharp rises in price with some short rest in the middle (i.e. base). The buy entry is nearly identical to the case of reversal buy trading. We can consider the buy entry when the price touches the demand zone. In addition, the profit target and stop loss setting is nearly identical to the case of reversal buy trading too. In continuation trading, the price pattern for sell entry is called drop base drop pattern. It is the key point to observe two sharp falls in price with some short rest in middle (i.e. base). The sell entry is nearly identical to the case of reversal trading. We can consider the sell entry when the price touches the supply zone. In addition, the profit target and stop loss setting is nearly identical to the case of reversal buy trading too.
Here is the list of Advanced Supply Demand Zone Indicator. These supply and demand zone indicators are rich in features with many powerful features to help you to trade the right supply and demand zone to trading.
Mean Reversion Supply Demand
Mean Reversion Supply Demand indicator is our earliest supply demand zone indicator and loved by many trader all over the world. It is great to trade with reversal and breakout. You can also fully setup your trading with stop loss and take profit target.
Below are the links to the Mean Reversion Supply Demand indicator for MetaTrader 4/MetaTrader 5.
https://www.mql5.com/en/market/product/16823
https://www.mql5.com/en/market/product/16851
https://algotrading-investment.com/portfolio-item/mean-reversion-supply-demand/
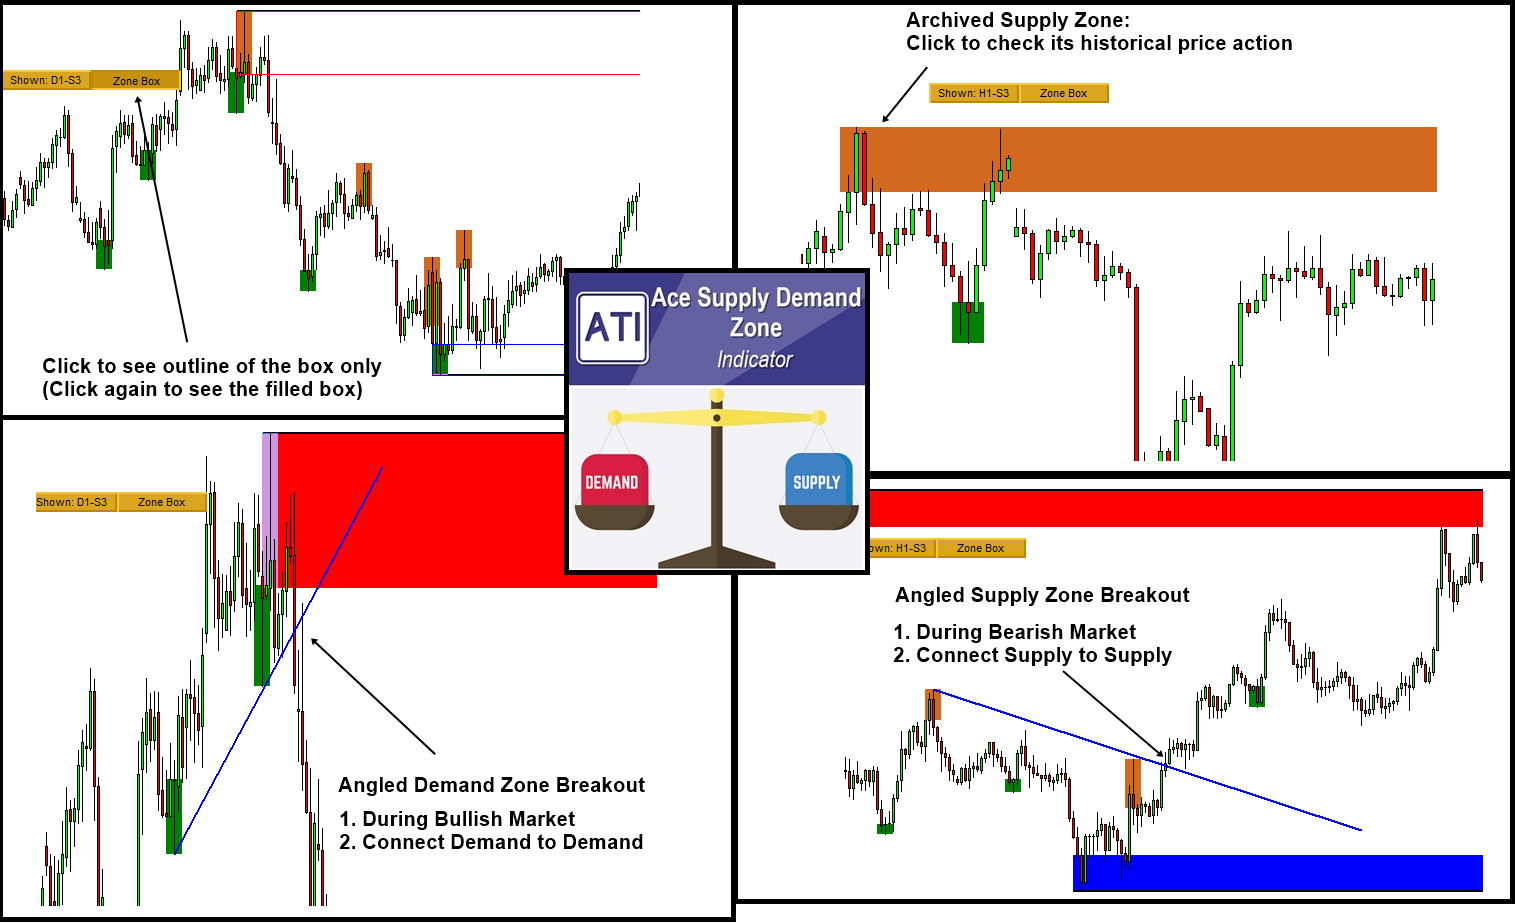
Ace Supply Demand Zone
Ace Supply Demand Zone indicator is our next generation supply demand zone indicator. It was built in non repainting and non lagging algorithm. On top of many powerful features, you can also make use of archived supply and demand zone in your trading to find more accurate trading opportunity.
Below are the links to the Ace Supply Demand Zone indicator for MetaTrader 4/MetaTrader 5.
https://www.mql5.com/en/market/product/40076
https://www.mql5.com/en/market/product/40075
https://algotrading-investment.com/portfolio-item/ace-supply-demand-zone/
For your information, both mean reversion supply demand and Ace supply demand zone indicator uses completely different algorithm in detecting supply and demand zone.
Related Products


