Introduction to Technical Analysis
Designing a successful strategy is an intellectually challenging process. It requires extensive research and testing. The research in trading is always followed by the immediate real world outcome. The trading strategy based on the bad system or methodology will be falsified extremely fast in the real world trading. Naturally, a trader with the scientific mind set can learn the great deal of knowledge about this world from testing various trading methodology with the financial market. Science or scientific methodology plays an important role in trading and investment.
Technical and fundamental analyses are the two main schools of thoughts for financial trading and investment. Technical analysis assumes that price discounts for everything. For example, technical analyst believe that at a given time a stock’s price reflects everything that could affect the company including company’s fundamental factors, economic factors and market psychological factors. Technical analyst also believes that history tends to repeat itself. Therefore, they can predict the future. Technical analysis only leaves the price as the main subject to study. For fundamental analysis, traders study the intrinsic value of the company. For example, they make their trading decision based on growth potential of the security. They are more concerned with basis like sales, earnings and management of the company. In general, fundamental traders are considered as the long term investors whereas the technical traders are considered as the short term investors. However, there are short-term fundamental traders too. For example, some news traders do not hold their position too long. On the other hands, there are technical traders basing their trading decision on monthly timeframe. Those technical traders can hold their position for several months to few years too.
The origin of technical analysis could be traced back to the trading of Japanese rice in Osaka in late 1600. This is the period when the Japanese candlestick technique was developed. With the development of high capacity computers and internet, the development of technical analysis has been accelerated even fast. In this book, we are only interested in the technical analysis in terms of the methodological point of view. Do not confuse the technical analysis with technical indicators. Technical analysis is the comprehensive methodology that covers broad scientific and mathematical methods. Technical indicator is the mathematical transformation of the price series to extract smoothed price trajectory or oscillating motion of the price like Simple Moving average or Relative Strength Index. Of course, technical indicator is a part of technical analysis but it is much smaller concept comparing to technical analysis. To give you some ideas about technical analysis, we will present five important categories for technical analysis. The five categories include charting, pattern analysis, technical indicator, mathematical method and artificial intelligence. We list some of the sub elements of the five categories in Table 1-1.
| Charting Techniques | Pattern Analysis |
| · Line chart
· OHLC Bar chart · Candlestick chart · Renko chart · Median Renko chart · Tick chart · Point & Figure chart · Heiken Ashi · Area · Kagi · Line break · Histogram · Scatter plot |
· Japanese candlestick patterns
· Support & resistance · Pivot point analysis · Volume Spread Analysis · Elliott Wave Theory · Harmonic Pattern · Fibonacci Retracement, Fibonacci Fan, Fibonacci Arc, · Gann Line, Gann Fan, Gann Arc, Gann Square · Tradable Patterns (Rising Wedge, Falling Wedge, Double top, double bottom, head & shoulder pattern) · Supply & Demand Zone (Rally Base Drop and Drop Base Rally patterns) · Andrew’s pitch fork · Market Profile |
| Technical indicators | Mathematical Methods |
| · Simple Moving Average
· Exponential Moving Average · Triple Exponential Smoothing Average · Relative Strength Indicator · Fractals · MACD · Commodity Channel Index · Rate of Change · Williams’s Percent (%) · Stochastic Oscillator · Parabolic SAR |
· Principal Component Analysis
· Wavelet Transformation · Multiple Regression · Logistic Regression · Exponential smoothing method · Autoregressive Integrated Moving Average method · Vector Autoregressive method · Error correction model · Co-Integration Test · Dynamic Stochastic programming · Monte Carlos Simulation |
| Artificial Intelligence |
| · Multilayer Perceptron
· Support Vector Machine · Self-Organizing Map · Deep Machine Learning · Genetic Algorithm |
Table 1-1: Five main categories of Technical Analysis.
Charting techniques are the first requirement for trading. Simply speaking traders cannot trade without any chart. The value for good visualization technique is a prime importance for traders. Important attributes in the modern charting technique is that they must allow the instant recognition of important patterns and trend from the price series. In addition, market volatility should be also easily gleaned from the chart too. Some commonly used charting techniques are line chart, OHLC bar char and candlestick chart. In modern trading software, these three types of charts are essentially provided in their basic package. Some more sophisticated software offers Renko chart, Point & Figure chart and Tick chart for advanced users. Traders tend to have their preferences for the choice of the charts. For traders using Japanese candlestick patterns, they will stick with candlestick chart over OHLC bar chart. If traders are looking for breakout patterns, then they will prefer Renko chart or Point & Figure chart.
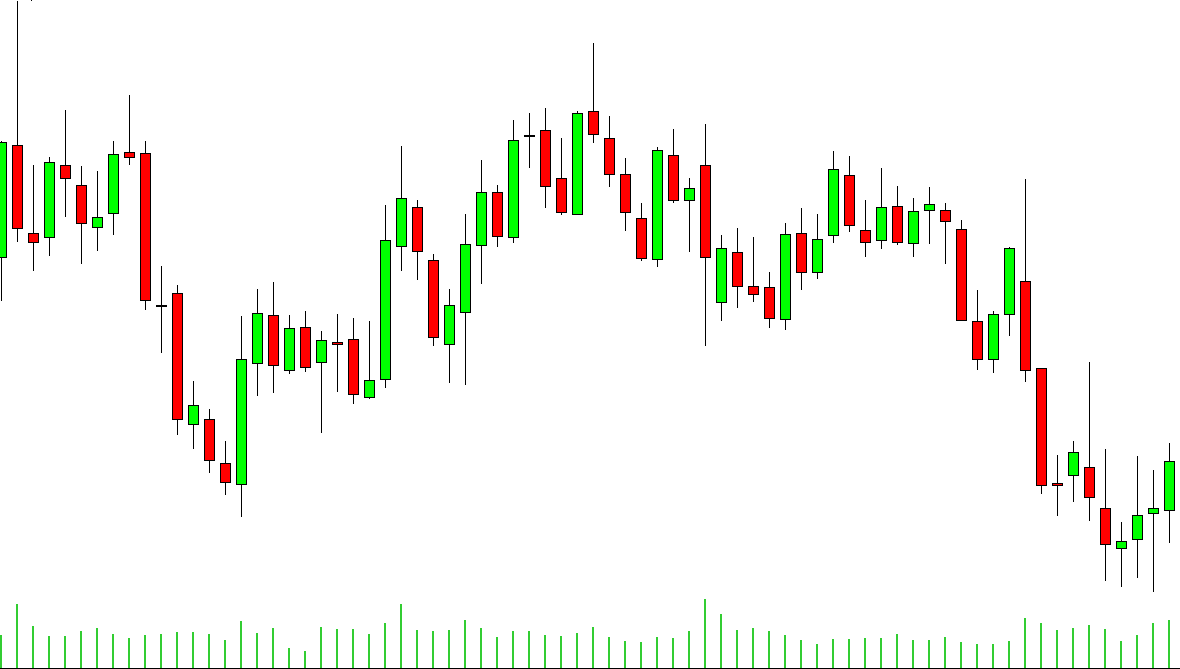
Figure 1-1: Candlestick chart of EURUSD Daily series with tick volume.
The objective of the technical indicator is to measure the strength of trend, volatility and momentum of the price series. Technical indicators are mostly derived from the price series. Sometime technical indicator uses open, high, low and close price. Sometimes the technical indicator only uses close price for computation. The advantage of technical indicators is ease of use. For example, most of technical indicators can be displayed simultaneously together with the original price series in a convenient way. Therefore, traders can easily incorporate alerting system for his trading. The disadvantage is that most of time technical indicators are lagging behind the actual price series. In modern trading platform, technical indicators and charting facilities are the basic requirements for trading. Many of the software vendors provide over 100 technical indicators with their trading platform. There are some of the vendors claiming that they are offering over 3000 different technical indicators unofficially. Most common mistake for traders is that they tend to apply the same technical indicator across every market. The different market can have different market dynamics. Therefore, before blindly applying any technical indicators, you should ask the question like “Is this technical indicator right one for this market?”. For example, for the stock exhibiting strong growth patterns, it is not good idea to look for the trend reversal opportunities using the relative strength indicator.
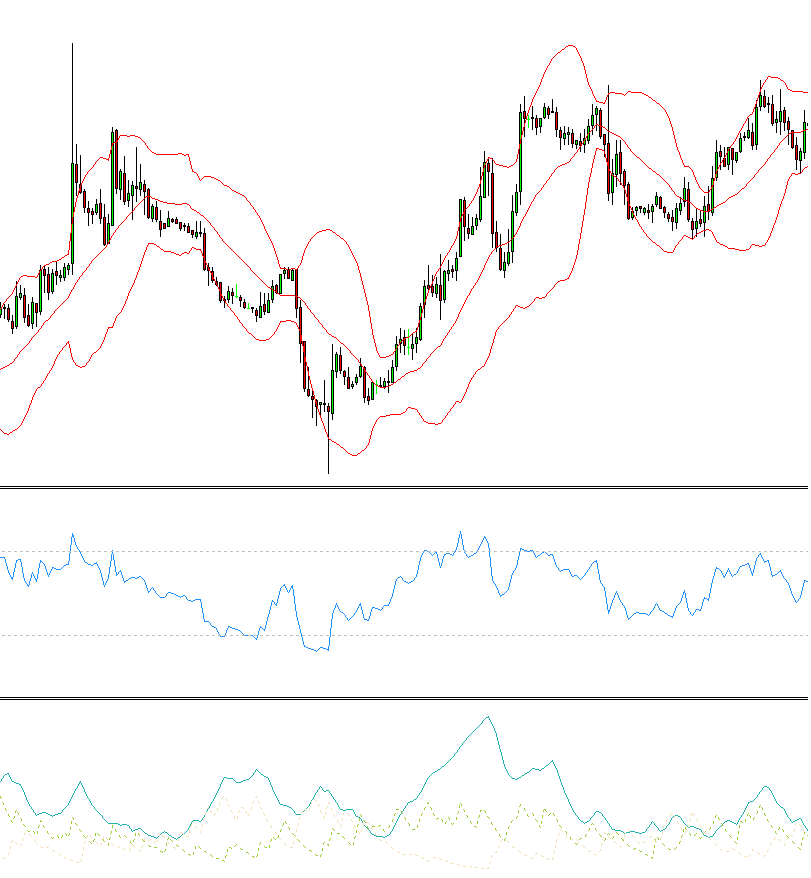
Figure 1-2: Candlestick chart of EURUSD Daily series (top) with Relative Strength Indicator (middle) and Average Directional Movement Index (bottom).
Besides technical indicators, pattern analysis is another important tool for traders. Pattern analysis concerns about the price levels and the geometry of the price series. Support & resistance, Japanese candlestick pattern and Fibonacci retracement are the popular pattern recognition techniques for traders. Support and Resistance represents key price levels where the force of supply and demand meets (Figure 1-3). Normally support and resistance levels are detected by connecting frequently tested level from your chart. Support is the price level at which demand is strong to prevent the price from declining further. Resistance is the price level at which selling is strong to prevent the price from rising further. Some textbook might teach you the support and resistance level as the reversal level but this may be not true. Practically speaking, support and resistance level can act as the breakout level too. For example, when the price penetrates through resistance level, more buying momentum can build up for strong bullish movement. Likewise, when the price penetrates the supply level, more selling momentum can build up for strong bearish movement. However, what is always true is that there are strong volatility around the support and resistance area. Price will either penetrate hard or bounce back hard at support and resistance level. When the resistance level is penetrated, then the resistance level becomes support level. Likewise, when the support level is penetrated, the support level becomes resistance level. Traders should get habit of making note for the important levels always for their trading.
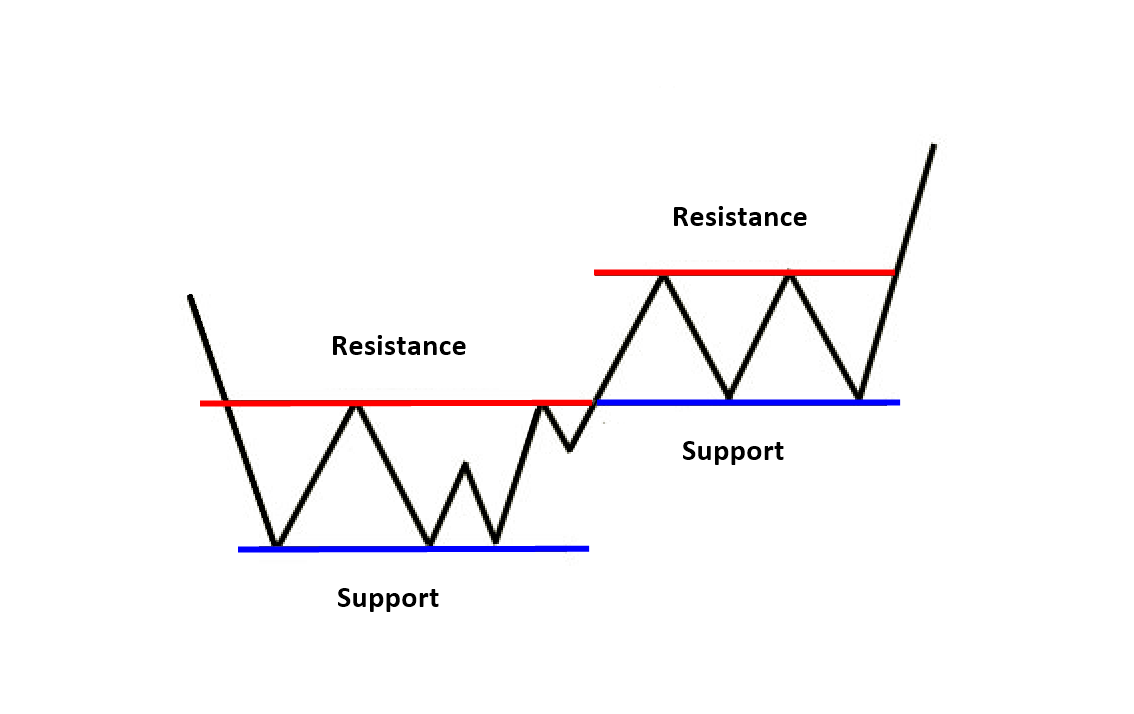
Figure 1-3: Schematic diagram of Support and Resistance for financial trading.
Fibonacci retracements are ratios used to identify potential reversal levels. Since these ratios are derived from the Fibonacci sequence, they are called Fibonacci retracement. 23.6, 38.2, 50.0 and 61.8% are the popular ratios used for Fibonacci retracement. Chartists often use these Fibonacci ratios to define retracement levels and forecast the extent of a correction or pullback. For example, Figure 1-4 show the typical sequence for bearish trend – correction – continuing bearish trend pattern. As you can see, the correction was made about 38.2% of the retracement from the initial bearish trend move. When you want to apply Fibonacci retracement, you need to identify one swing high and swing low from your chart. If swing high comes before swing low, then you will predict the bearish trend reversal point. If swing low comes before swing high, then you will predict the bullish trend reversal point. Like support and resistance levels, the accuracy of the Fibonacci retracement varies for different market condition too. Fibonacci retracement is simple but powerful concept. It can be combined with other techniques to form overall strategy. Fibonacci retracement is normally very good supportive tool to cover the weakness of the technical indicator.
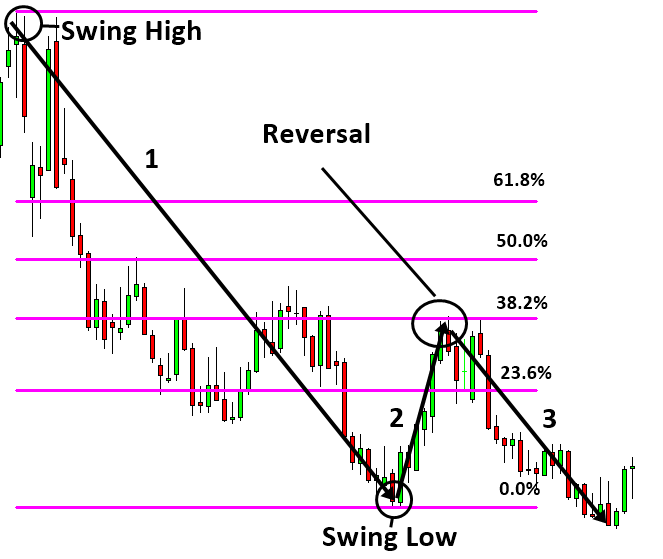
Figure 1-4: Fibonacci Retracement drawn over daily EURUSD candlestick chart for bearish setup.
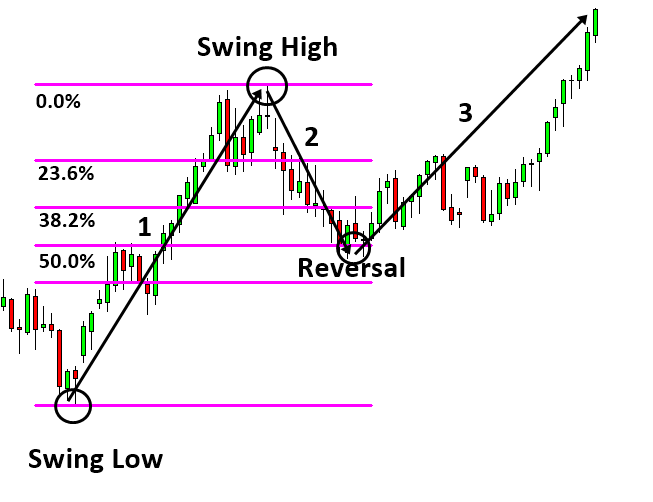
Figure 1-5: Fibonacci Retracement drawn over daily EURUSD candlestick chart for bullish setup.
Japanese candlestick pattern is a popular pattern analysis used by many traders. It provides visual insight for buying and selling momentum present in the market. Japanese candlestick pattern can provide both entry and exit signal for traders. At the same time, many traders use them as the confirmation techniques. Japanese candlestick patterns provide both trend continuation and trend reversal patterns as shown in Figure 1-6 and Figure 1-7. The main advantage of Japanese candlestick is that they are simple and universal. Japanese candlestick pattern can be detected visually without need of the sophisticated tool. At the same time, the accuracy of the Japanese candlestick can be quite subjective to traders. Unless you want to hold your trade for one bar or two bar only, sometime Japanese candlestick pattern can predict the direction wrong against long-term price movement. So the caution must be made to use together with other technical indicator or other pattern analysis. From my experience, Japanese candlestick has more values as the confirmation technique rather than main signal for your trading.
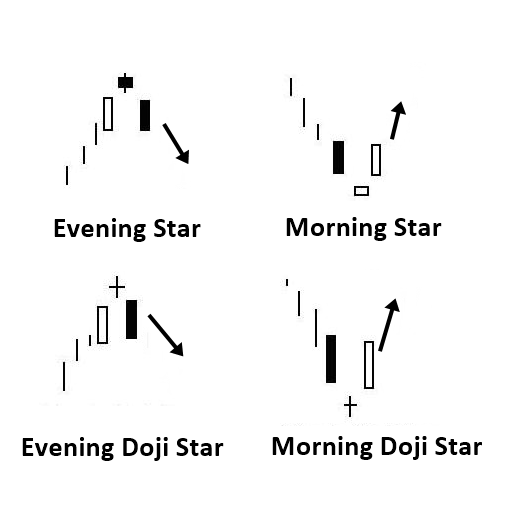
Figure 1- 6: Trend reversal Japanese candlestick patterns.
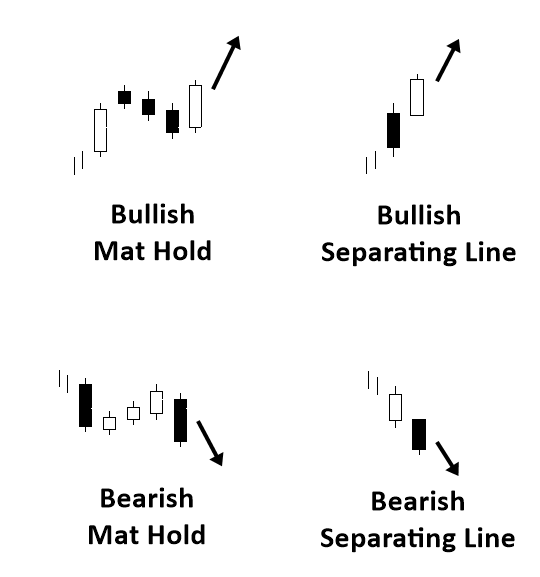
Figure 1- 7: Trend continuation Japanese candlestick patterns.
Mathematical method is one form of the technical analysis even though they were not originally developed for the financial trading. The common statistical method like multiple regressions is often applied for trading and investment. Principal Component Analysis is the common techniques used to extract some meaningful information from the financial price series. In addition, the Vector autoregressive method or error correction model is popular mathematical trading tool among mathematician. Advantage of mathematical method is their ability to incorporate robust analytical methodology. For example, with Monte Carlos simulation method, one can develop rigorous trading strategy with precise statistical inference about the trading setup. For example, traders can illustrate the worst and best outcome of the trading setup for the given volatility of the price series. The disadvantage of the mathematical method is that they might be too complex for average traders. Even though modern trading software comes with the built in script language, implementation of serious mathematical model takes considerable amount of time and efforts for trading and investment. It is also important for the model builder to understand the operating principle and practical limitation of the methods. For example, the Generalized Autoregressive Conditional heteroscedasticity (GARCH) model can be used to model the volatility of the financial market. When they built well, they can offer the considerable insight about the current and future volatility of the financial market. However, some people mistakenly uses the least square estimation in the place of the maximum likelihood estimation because of the readily available source code for the least square curve fitting method on online. The wrongly applied mathematical model can do more harm than good for your trading. Therefore, you must carefully think if the mathematical method can provide sufficient benefit to overcome the complexity. Considering that many investment banks hires applied mathematicians and physicists, exploring mathematical trading model is worth for your future career when you can afford the time and cost for building such a model.
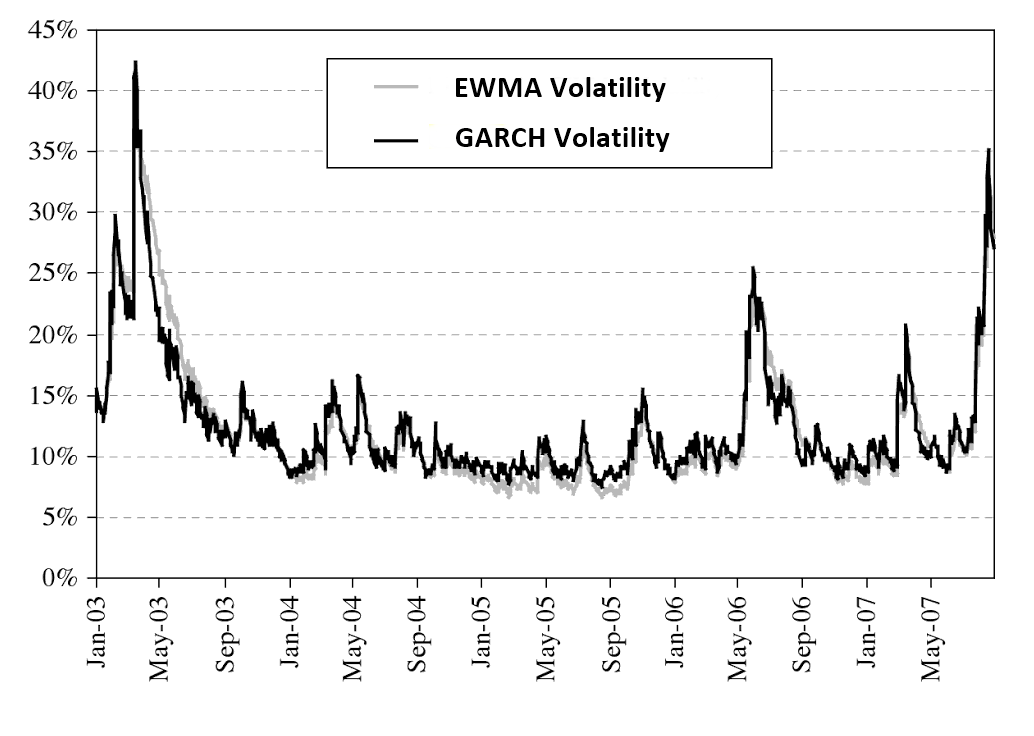
Figure 1-8: GARCH and EWMA Volatility for FTSE 100. (Alexander, 2008)
Artificial intelligence techniques are another alternative approach for technical analysis. In fact, the computer scientist had a long interest in using artificial intelligence for the financial market. They are often considered as more complex methods than the mathematical methods. For example, multilayer feedforward neural networks are one form of the nonlinear regression. The method extends the capability of multiple regression by connecting multiple of neurons, in which each neuron resembles multiple regression. Advantage of the artificial intelligence is that they are nonlinear method with the capability of capturing nonlinear patterns. The disadvantage of the artificial intelligence is that one requires quite a lot of data and high speed computing facility. Most of time, one requires impressive hardware to deal with the computation required for the artificial intelligence model. Apparently, the artificial intelligence has proven its ability for the real world application. For example, Google’s Alphago beat the world champion Lee Se-Dol and European champion Fan Hui at the board game GO with a best of five win. However, considering that Alphago used a larger network of computers that spanned about 1200 CPUs to match with Lee Se-Dol and Fan Hui, it is questionable if it was a fair match for one human to compete with 1200 CPUs. In addition, this also confirms that this technology is still rather expensive for the budget of the average traders. Applying artificial intelligence for making prediction for stock index and currency markets are not a new story any more. Artificial intelligence sounds so futuristic and promising. However, one caution must be made before you become a huge fan of artificial intelligence. Ability of artificial intelligence is limited by usefulness of the data feeding into the model. For example, artificial intelligence can deal with what is inside the data only. For the poor data, artificial intelligence can only predict with poor accuracy. Due to their complex internal structure, they are prone to noise in the data too. Artificial intelligence can produce non-reliable prediction for highly complex data sets sometimes. If the simple methods can produce more or less the same results in comparison to artificial intelligence, it is better to stick with the simple method. Simple method will provide you more reliable trading operation in long run.
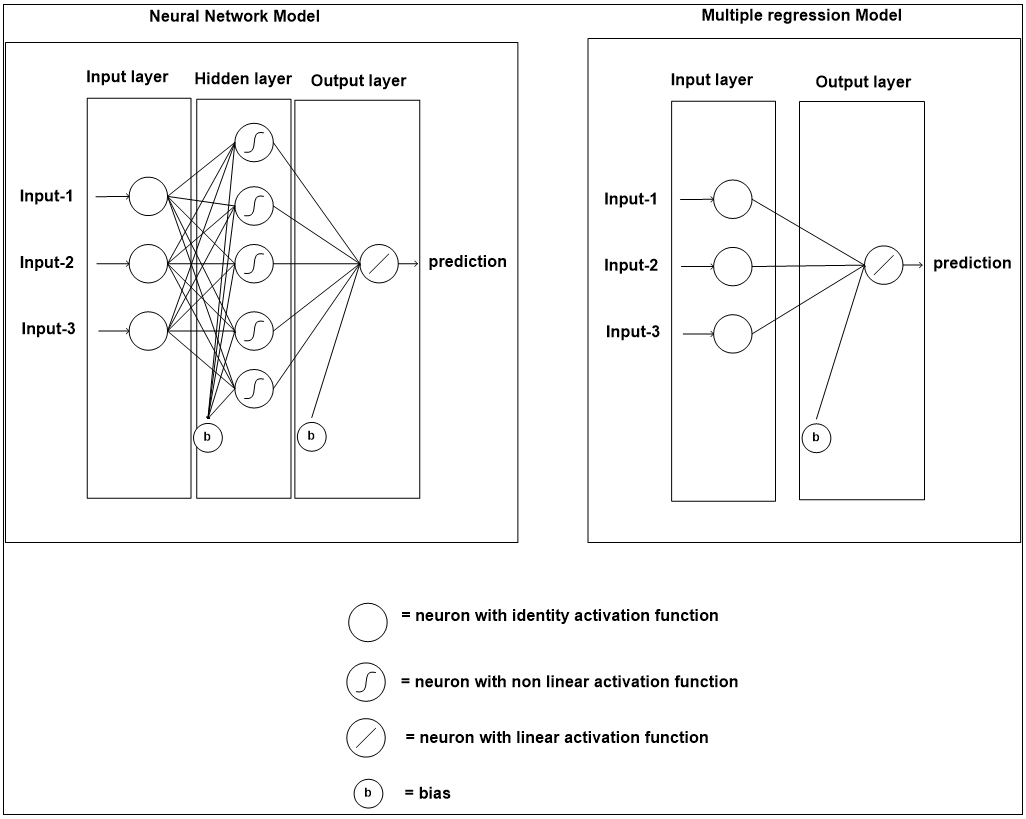
Figure 1-9: Topology of feed forward neural network model with 3 input neurons, 5 hidden neurons and 1 output neuron (Left) and multiple regression model expressed using neural network topology (right).
Some More Tips about Technical Analysis in Forex Trading
Technical analysis in forex trading involves studying past market data, primarily price and volume, to forecast future price movements. Unlike fundamental analysis, which examines economic factors, technical analysis focuses on identifying patterns and trends that can provide insights into future price behavior. Here’s an overview of key concepts and tools used in technical analysis for forex trading:
Key Concepts
- Price Trends:
- Uptrend: When the price consistently makes higher highs and higher lows.
- Downtrend: When the price consistently makes lower highs and lower lows.
- Sideways/Range-bound Trend: When the price fluctuates within a horizontal range.
- Support and Resistance Levels:
- Support: A price level where a downtrend can pause due to a concentration of buying interest.
- Resistance: A price level where an uptrend can pause due to a concentration of selling interest.
- Breakouts: Occur when the price moves above resistance or below support, often leading to significant price movements.
- Chart Patterns:
- Reversal Patterns: Indicate a change in the trend direction, such as Head and Shoulders, Double Top/Bottom.
- Continuation Patterns: Suggest that the trend will continue, such as Flags, Pennants, and Triangles.
Technical Indicators
- Moving Averages:
- Simple Moving Average (SMA): The average price over a specific period.
- Exponential Moving Average (EMA): Similar to SMA but gives more weight to recent prices.
- Use: Identifying trend direction and potential reversal points.
- Relative Strength Index (RSI):
- Description: Measures the speed and change of price movements, with values ranging from 0 to 100.
- Use: Identifies overbought (above 70) or oversold (below 30) conditions.
- Moving Average Convergence Divergence (MACD):
- Description: Shows the relationship between two moving averages of a security’s price.
- Components: MACD line, Signal line, and Histogram.
- Use: Identifies potential buy and sell signals.
- Bollinger Bands:
- Description: Consist of a middle band (SMA) and two outer bands (standard deviations from the SMA).
- Use: Identifies volatility and potential overbought or oversold conditions.
- Stochastic Oscillator:
- Description: Compares a particular closing price to a range of its prices over a specific period.
- Use: Identifies overbought (above 80) and oversold (below 20) conditions.
Chart Types
- Line Charts:
- Description: Connects closing prices with a continuous line.
- Use: Ideal for identifying long-term trends.
- Bar Charts:
- Description: Each bar shows the opening, high, low, and closing prices (OHLC) for a specific period.
- Use: Provides more detailed price information.
- Candlestick Charts:
- Description: Similar to bar charts but use candlesticks to show OHLC prices.
- Use: Highly popular for visualizing price patterns and trends.
Common Chart Patterns
- Head and Shoulders:
- Description: A reversal pattern with three peaks (head and two shoulders).
- Use: Indicates a trend reversal.
- Double Top and Double Bottom:
- Description: Two peaks (Double Top) or troughs (Double Bottom) at roughly the same price level.
- Use: Indicates potential trend reversals.
- Triangles:
- Ascending Triangle: Horizontal resistance line and rising support line.
- Descending Triangle: Horizontal support line and descending resistance line.
- Symmetrical Triangle: Converging support and resistance lines.
- Use: Indicating continuation or reversal of the current trend.
Practical Application
- Combining Indicators: Use multiple indicators to confirm signals and reduce false signals.
- Risk Management: Implement stop-loss orders and manage position sizes to protect against significant losses.
- Backtesting: Test strategies on historical data to evaluate their effectiveness.
- Stay Informed: Keep up with market news and economic events that can impact price movements.
- Discipline: Stick to your trading plan and avoid emotional trading decisions.
By mastering technical analysis, forex traders can enhance their ability to forecast market movements and make more informed trading decisions.
About this Article
This article is the part taken from the draft version of the Book: Scientific Guide to Price Action and Pattern Trading (Wisdom of Trend, Cycle, and Fractal Wave). Full version of the book can be found from the link below:
Price Breakout Pattern Scanner is the powerful pattern scanner designed to solve the puzzle of the market geometry beyond the technical indicators. With built in Japanese candlestick patterns + Smart Renko features together, Price Breakout pattern scanner can help you to define the accurate market entry for your breakout trading. Here is some screenshots from Price Breakout Pattern Scanner.
Below are the links to Price breakout Pattern Scanner
https://www.mql5.com/en/market/product/4859
https://www.mql5.com/en/market/product/4858
https://algotrading-investment.com/portfolio-item/price-breakout-pattern-scanner/
Below is the landing page for Optimum Chart (Standalone Charting and Analytical Platform).
https://algotrading-investment.com/2019/07/23/optimum-chart/
Related Products


