Reversal Trading using Fibonacci Expansion Pattern with Volatility Analysis
When you want to setup the reversal trading with Volatility analysis, the main idea is to find the geometric regularity in relatively high volatile area. For this purpose, we will use either bullish reversal area (B) or bearish reversal area (S) in our Volatility analysis. We will be using the movable Harmonic Volatility indicator for the trading setup.
We will provide you both bullish and bearish reversal trading example. We will start with bullish reversal trading example first. Assume that you are making a bullish turning point prediction using Fibonacci Expansion pattern. The first step is to pick three points to construct the anchor points for the Fibonacci Expansion (Figure 5.1-8). Then the point 4 is projected from these three points using the Fibonacci ratios. Typically, you can use three different Fibonacci Expansion ratios including 0.618, 1.000, and 1.618.
At the point 4, you will predict the bullish turning point. To make your prediction more accurate, we will add the statistical justification (i.e. detect statistical regularity). Hence, we will apply the movable Harmonic Volatility indicator to check if the point 4 is in bullish reversal area (B) in terms of the Volatility. For our setup, the Volatility check can be performed twice.
Firstly, we can check the volatility from the point 3 to the point 4. Secondly, we can check the volatility from the point 1 to the point 4. When the two Volatility checks agree to each other, we can have more confidence in our bullish turning point prediction at the point 4.
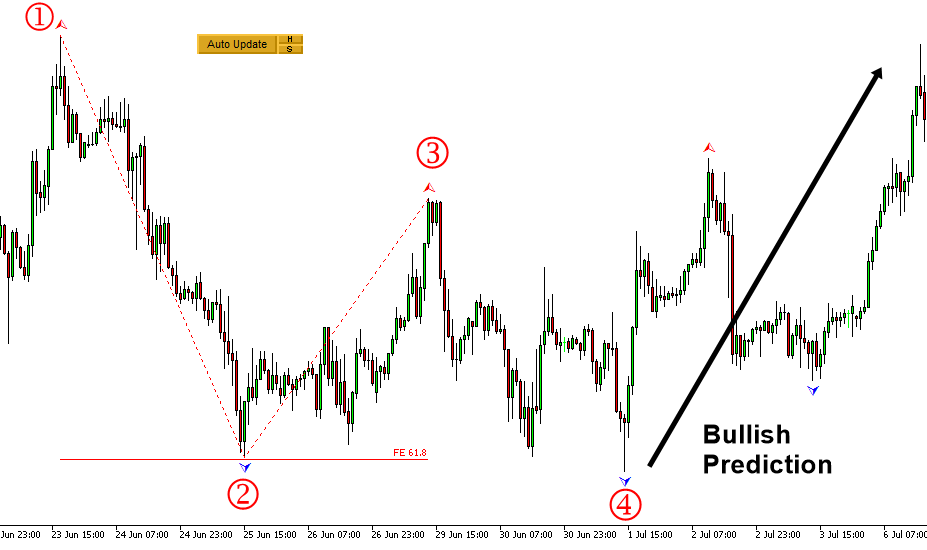
Figure 5.1-8: Constructed Fibonacci Expansion to predict the bullish turning point on EURUSD H1 timeframe
By checking the Volatility from the point 3 to the point 4, we can tell that the point 4 nearly touches the bullish area (B) at the 76.4% probability. The corresponding Z score (i.e. standard deviation) is 1.185. Hence, this first Volatility check provides us the green light.
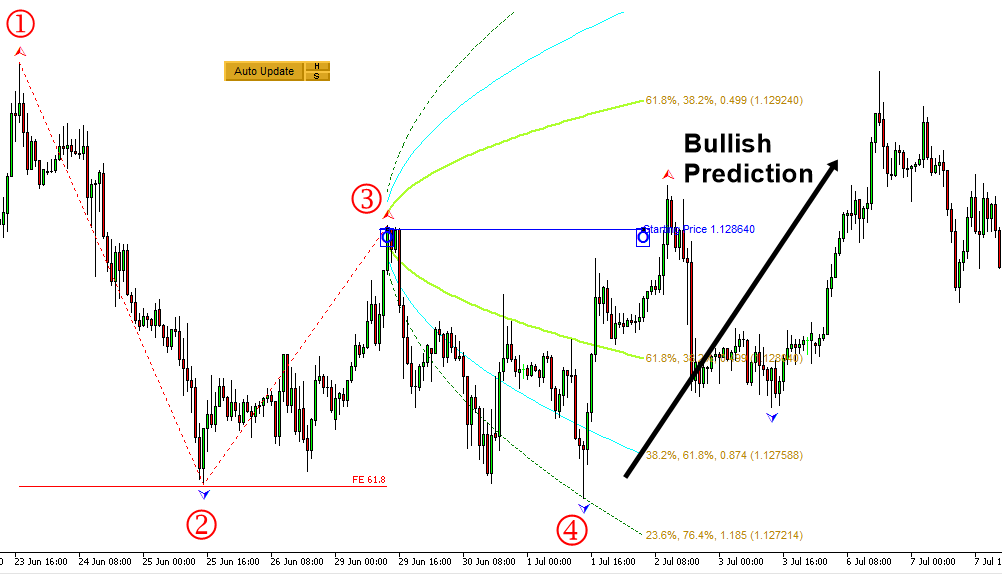
Figure 5.1-9: First Volatility check from the point 3 to point 4 in the Fibonacci Expansion on EURUSD H1 timeframe
By checking the Volatility from the point 1 to the point 4, we can tell that the point 4 is inside the bullish area (B) near the 76.4% probability line. The corresponding Z score (i.e. standard deviation) is 1.185. Hence, this second Volatility check also provides us the green light.
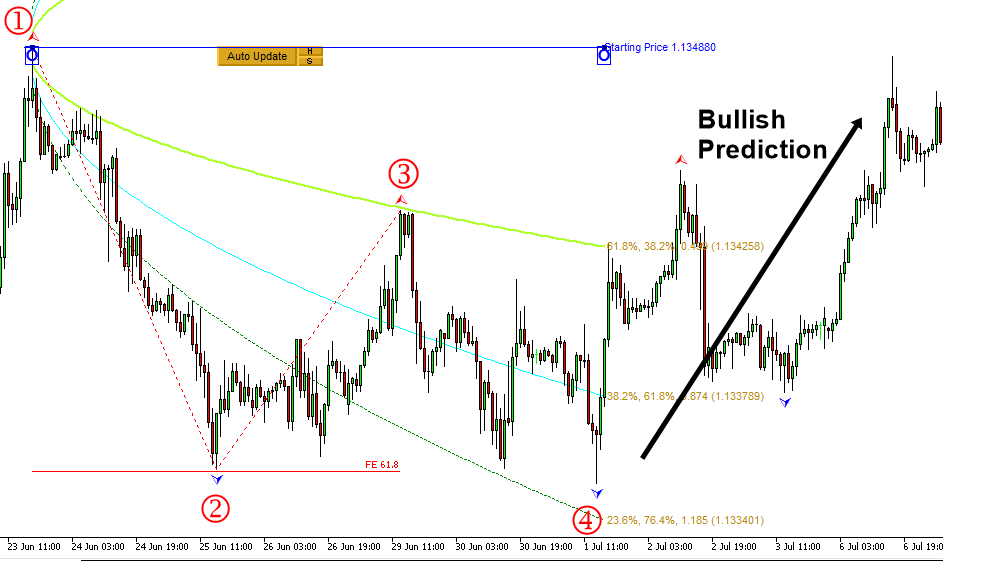
Figure 5.1-10: Second Volatility check from the point 1 to the point 4 in the Fibonacci Expansion on EURUSD H1 timeframe
Now let us move onto the case of bearish reversal trading example. We will apply the identical steps as in the bullish reversal trading. The first step is to pick three points to construct the anchor points for the Fibonacci Expansion (Figure 5.1-11). Then the point 4 is projected from these three points using the Fibonacci ratios 0.618.
At the point 4, you will predict the bearish turning point. To make your prediction more accurate, we will add the statistical justification (i.e. detect statistical regularity). Hence, we will apply the moveable Harmonic Volatility indicator to check if the point 4 is in bearish reversal area (B) in terms of the Volatility. For our setup, the Volatility check can be performed twice.
Firstly, we can check the volatility from the point 3 to the point 4. Secondly, we can check the volatility from the point 1 to the point 4. When the two Volatility checks agree to each other, we can have more confidence in our bearish turning point prediction at the point 4.
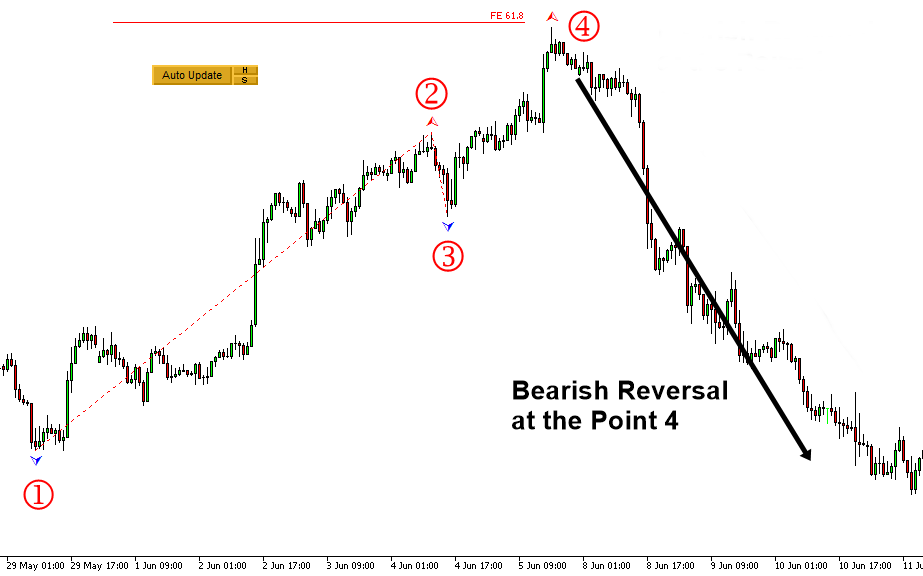
Figure 5.1-11: Constructed Fibonacci Expansion to predict the bearish turning point on USDJPY H1 timeframe
By checking the Volatility from the point 3 to the point 4, we can tell that the point 4 within the bullish area (B) near the 91.0% probability. The corresponding Z score (i.e. standard deviation) is 1.695. Hence, this first Volatility check provides us the green light.
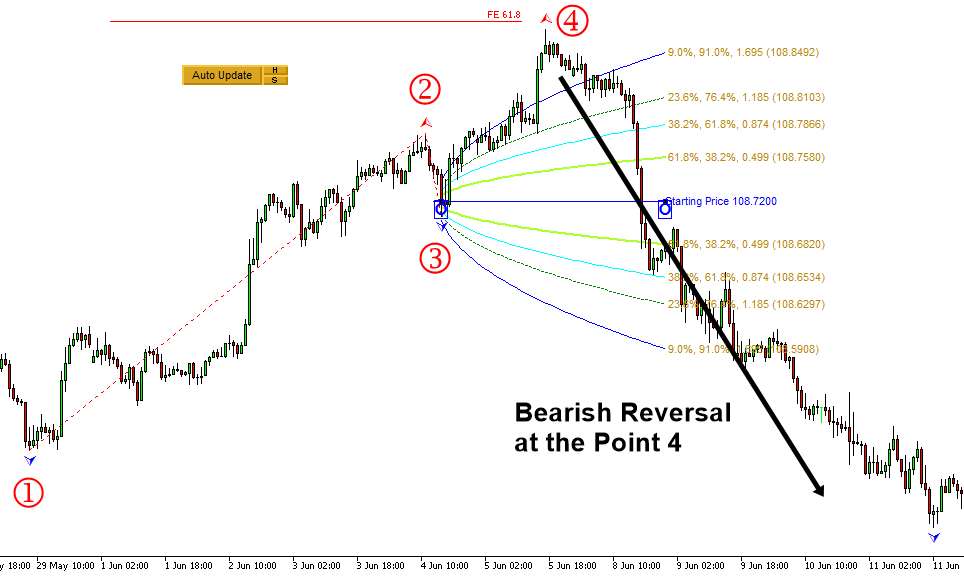
Figure 5.1-12: First Volatility check from the point 3 to point 4 in the Fibonacci Expansion on USDJPY H1 timeframe
By checking the Volatility from the point 1 to the point 4, we can tell that the point 4 is inside the bullish area (B) near the 98.7% probability line. The corresponding Z score (i.e. standard deviation) is 2.484. Hence, this second Volatility check also provides us the green light.
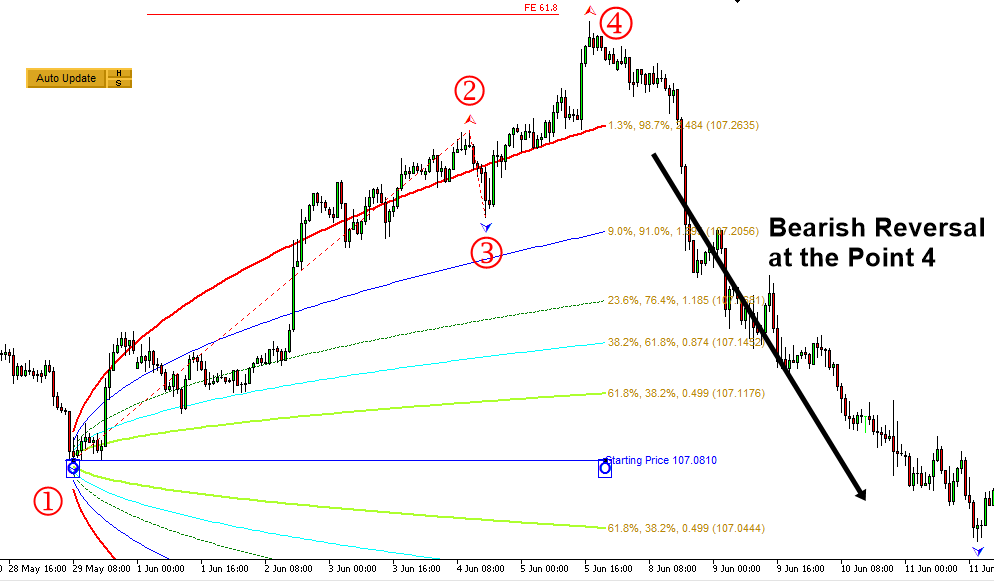
Figure 5.1-13: Second Volatility check from the point 1 to the point 4 in the Fibonacci Expansion on USDJPY H1 timeframe
When your purpose is to measure the Volatility for the reversal trading, it is important to locate the movable Harmonic Volatility indicator to the open price of the candle bar. In some cases, you can locate the movable Harmonic Volatility indicator directly to peak or trough. For example, when you want to use the Harmonic Volatility indicator like Gann’s angle, then it might be better to locate the movable Harmonic Volatility indicator directly to peak or trough. In the reversal trading, our purpose is not getting the support and resistance. Hence, it is better to use the open price of candle bar. However, this is only recommendation though.
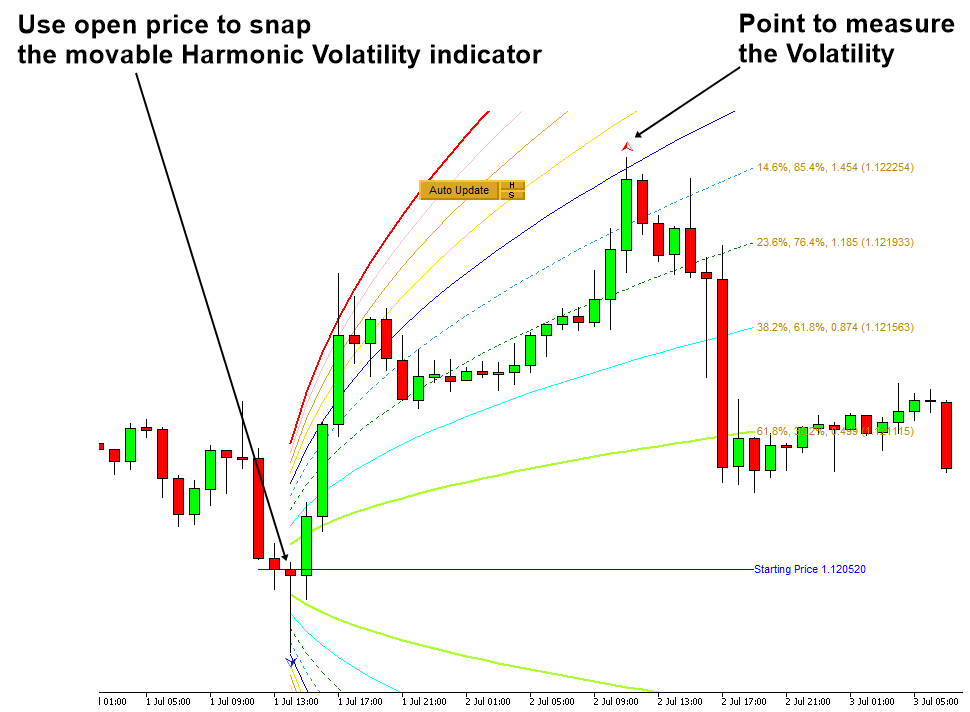
Figure 5.1-14: Example of locating the movable Harmonic Volatility indicator to the candle bar
The main point of the reversal trading is to identify the excessively sharp rise or fall in short period of time. For this reason, we need to watch out the rolling ball effect as we have introduced in the book: Guide to Precision Harmonic Pattern Trading. Reversal trading is sometimes not suitable for people who are not comfortable with the rolling ball effect. In that case, you can always practice the breakout trading instead of reversal trading. In the next part, we provide the breakout trading examples using Fibonacci Expansion with the Volatility analysis. You will see that the breakout trading mirrors the reversal trading logic.
About this Article
This article is the part taken from the draft version of the Book: Predicting Forex and Stock Market with Fractal Pattern. This article is only draft and it will be not updated to the completed version on the release of the book. However, this article will serve you to gather the important knowledge in financial trading. This article is also recommended to read before using Fibonacci Volatility Indicator, which is available for MetaTrader 4 and MetaTrader 5.
Below is the landing page for Fibonacci Volatility Indicator for MetaTrader 4 and MetaTrader 5.
https://www.mql5.com/en/market/product/52670
https://www.mql5.com/en/market/product/52671
https://algotrading-investment.com/portfolio-item/fibonacci-volatility-indicator/
Related Products


