Harmonic Volatility Indicator and Movable Harmonic Volatility Indicator
<<>>
Some contents omitted
<<>>
To use Harmonic Volatility indicator for either reversal or breakout trading, we need to define the three Volatility areas. Firstly, the area where the probability inside boundary is within 61.8% can be considered as the neutral area or low volatile area (N). If price is staying inside this low volatile area, then we can tell that power of bull and bear is pretty even. The corresponding Z score (i.e. standard deviation) is 0.874. You can check where this area is located in Figure 5.1-4. In this neutral area (N), we can often pick up the good breakout trading opportunity. When we want to apply more conservative criteria, you can set the neural area (N) within the 38.2% probability at the Z score of 0.499 (Figure 5.1-5).
Secondly, the bullish reversal or potential buy area (B) can be defined below the 61.8% probability line (Figure 5.1-4). The corresponding Z score is 0.874. If price was moved below this 61.8% probability line, then we can assume that selling pressure can slow down. When you want to apply more conservative criteria, we can define it below 76.4% probability line at the Z score of 1.185 (Figure 5.1-5).
Thirdly, the bearish reversal or potential sell area (S) can be defined above the 61.8% probability line (Figure 5.1-4). The corresponding Z score is 0.874. If the price was moved above this 61.8% probability line, then we can assume that buying pressure can slow down. When you want to apply more conservative criteria, we can define it as above 76.4% probability line at the Z score of 1.185 (Figure 5.1-5).
Both bullish reversal area (B) and bearish reversal area (S) are useful when you want to pick up the turning point whereas the neutral area (N) is useful when you want to pick up the breakout trading opportunity.
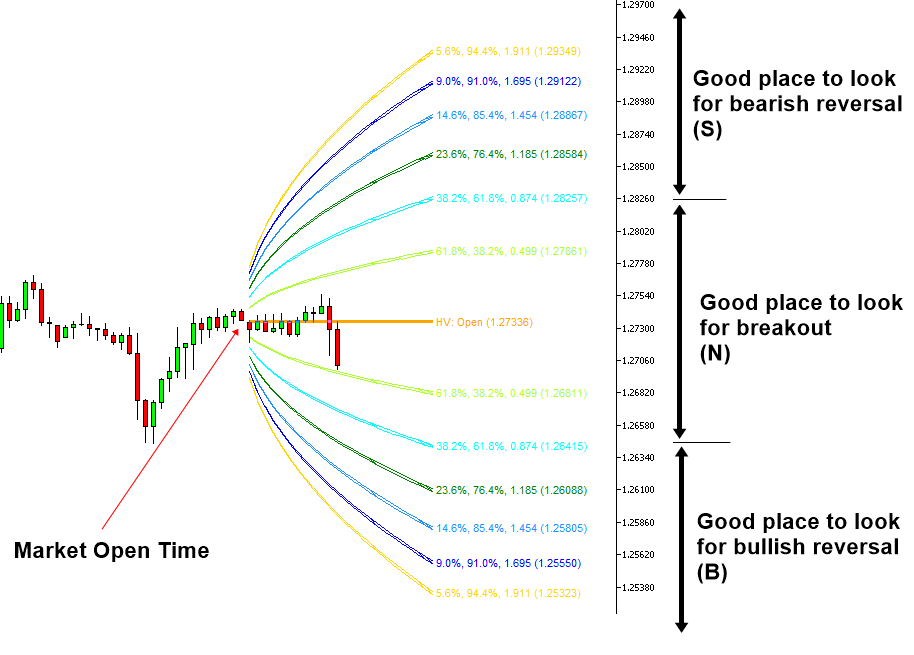
Figure 5.1-4: Bullish reversal area (B) and bearish reversal area (S) in the Harmonic Volatility Indicator in less conservative definition
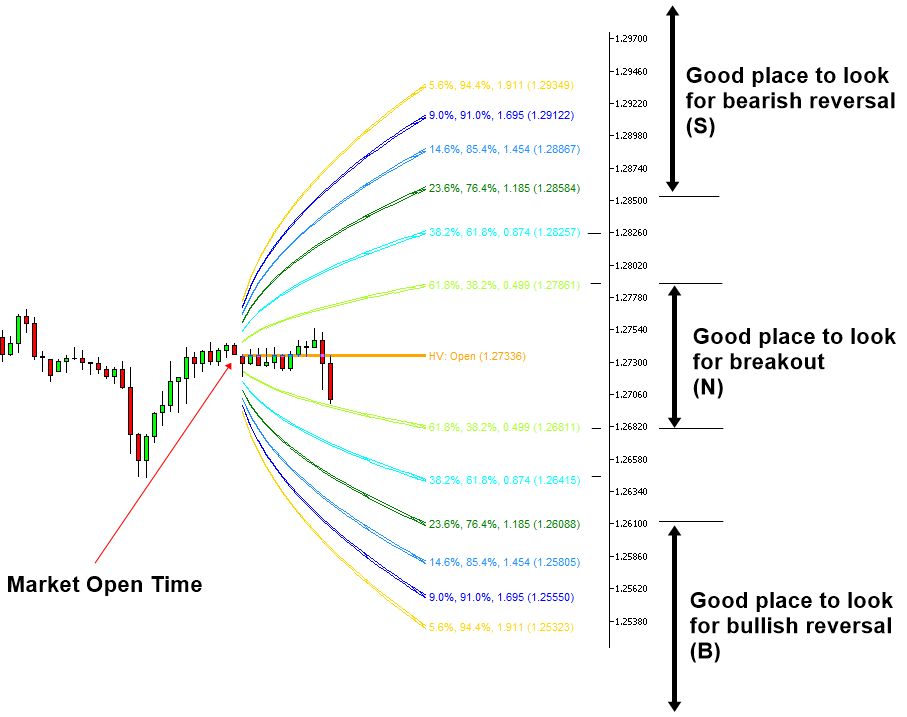
Figure 5.1-5: Bullish reversal area (B) and bearish reversal area (S) in the Harmonic Volatility indicator in the conservative definition
Depending on your need, the Harmonic Volatility indicator can be used in two different modes. In the first mode, the Harmonic Volatility Indicator can draw the projected Volatility lines for the fixed time interval like a day, a week, or a month. In this mode, the starting point to draw the Volatility lines is fixed to the market open time always. This mode is useful when you want to monitor the extreme or low Volatility throughout a day, a week, or a month. In fact, this was the original version of the Harmonic Volatility indicator when it was created.
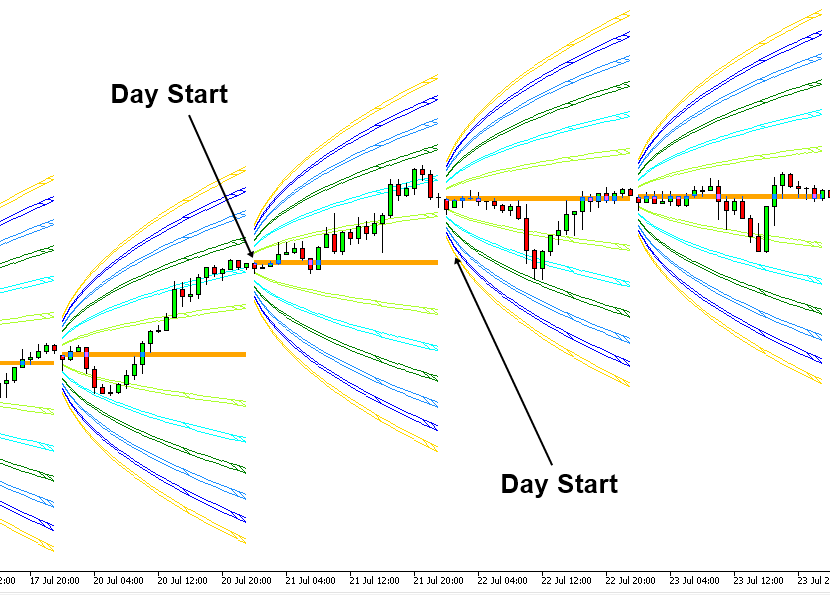
Figure 5.1-6: Harmonic Volatility indicator in Daily Mode on GBPUSD H1 timeframe
In the second mode, the Harmonic Volatility indicator can draw the projected Volatility lines from the specific time point in our chart. The second mode is considered as the movable Harmonic Volatility indicator. This movable Harmonic Volatility indicator is useful when you want to measure the Volatility from one specific time point to another time point. For example, you can place this movable Harmonic Volatility indicator from any peak or trough to measure the Volatility to the next peak or trough. In fact, in this chapter, we are interested in this Movable Harmonic Volatility indicator. In the next few chapters, we will show you how to apply this movable Harmonic Volatility indicator together with Fibonacci Expansion pattern for our trading.
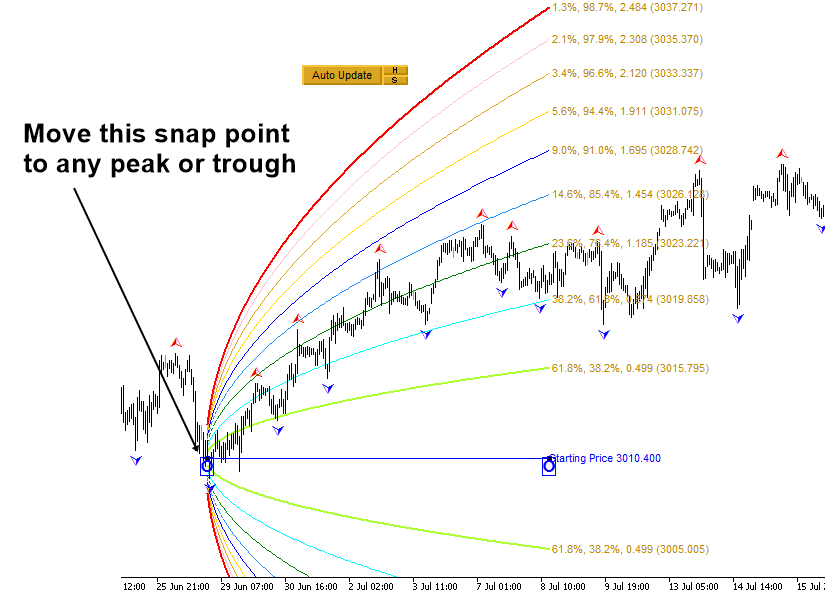
Figure 5.1-7: Movable Harmonic Volatility indicator on S&P 500 Index H1 timeframe
About this Article
This article is the part taken from the draft version of the Book: Predicting Forex and Stock Market with Fractal Pattern. This article is only draft and it will be not updated to the completed version on the release of the book. However, this article will serve you to gather the important knowledge in financial trading. This article is also recommended to read before using Fibonacci Volatility Indicator, which is available for MetaTrader 4 and MetaTrader 5.
Below is the landing page for Fibonacci Volatility Indicator for MetaTrader 4 and MetaTrader 5.
https://www.mql5.com/en/market/product/52670
https://www.mql5.com/en/market/product/52671
https://algotrading-investment.com/portfolio-item/fibonacci-volatility-indicator/
Related Products


