Breakout Trading using Fibonacci Expansion Pattern with Volatility Analysis
When you want to setup the breakout trading with Volatility analysis, the main idea is to find the geometric regularity in relatively low volatile area. For this purpose, we will use the neutral area or low volatile area (N) in our volatility analysis. We will be using the movable Harmonic Volatility indicator for the trading setup.
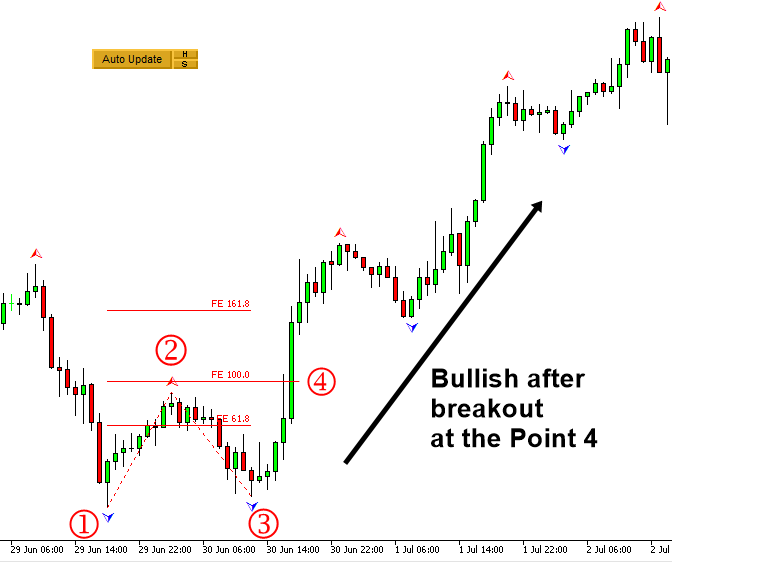
In Breakout trading, we are reversing the logic of the previous reversal trading examples. In Breakout trading, we want to find the opportunity in the low volatile area. The point is that we need to look for the small movement, which could become the potential breakout. Applying the Fibonacci Expansion for the breakout trading is almost identical to the previous reversal trading. Firstly, you need to pick three points in your chart. Make sure that the triangle made up from these three points is sufficiently small. Then you will project the price to find the fourth point. The recommended Fibonacci ratio is 0.618, 1.000, and 1.618. For the bullish breakout setup, the point 4 should be greater than the point 2. Hence, we can reject the ratio 0.618 in this case. We choose the price level at the Fibonacci ratio 1.000, which is just over the point 2. Next step is to ensure that this Fibonacci Expansion pattern is within the low Volatility area.
Figure 5.1-15: Breakout setup with Fibonacci Expansion pattern in GBPUSD H1 timeframe
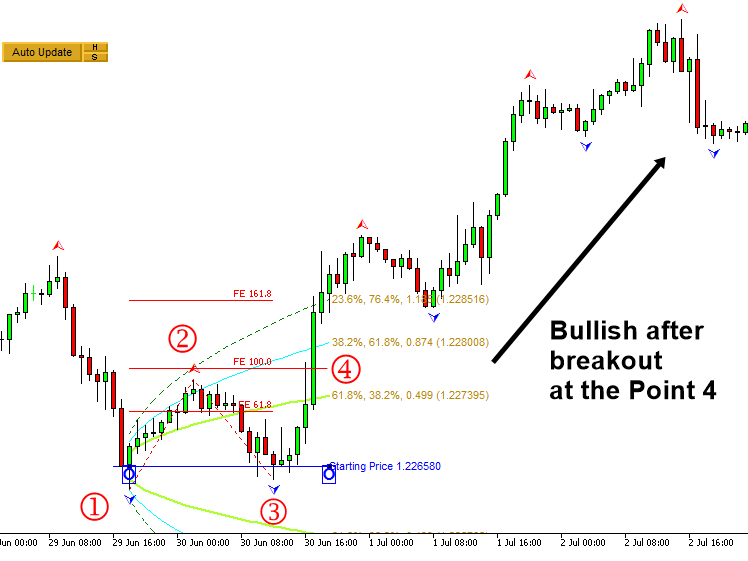
We apply the Harmonic Volatility indicator to check the Volatility criteria visually. For the case of breakout trading, it is sufficient to check the Volatility from the point 1 to the point 4 only. It is because we might expect the fast movement between the point 3 and the point 4. Hence, in Figure 5.1-16, we need to see the point 4 is contained within or near the neutral area (N) in the Harmonic Volatility indicator.
Figure 5.1-16: Volatility check form the point 1 to point 4 with Fibonacci Expansion pattern in GBPUSD H1 timeframe
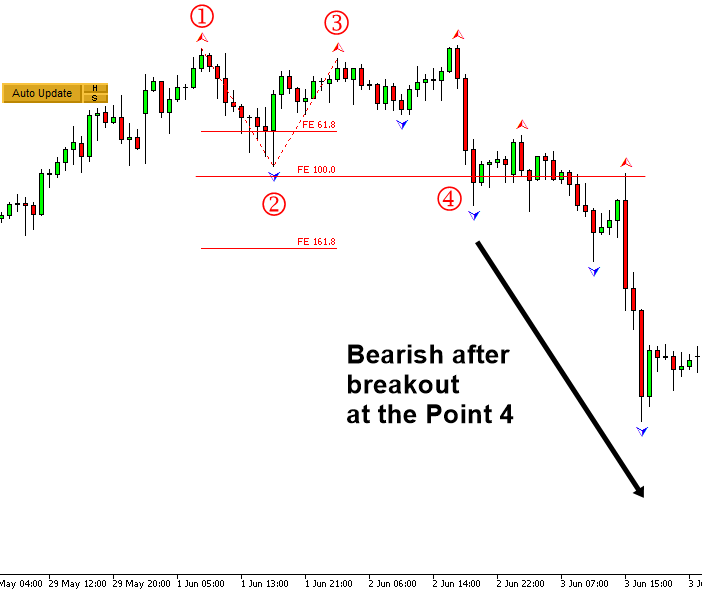
Now let us have the bearish breakout example. We will pick three points to construct the Fibonacci expansion. Make sure that the triangle made up from these three points is sufficiently small. Then we will project the price at the fourth point. The recommended Fibonacci ratio is 0.618, 1.000, and 1.618. For the bearish breakout setup, the point 4 should be less than the point 2. Hence, we can reject the ratio 0.618 in this case. We choose the price level at the Fibonacci ratio 1.000, which is just below the point 2. Next step is to ensure that this Fibonacci Expansion pattern is within or near the neural area (N).
Figure 5.1-17: Breakout setup with Fibonacci Expansion pattern in XAUUSD H1 timeframe
We apply the Harmonic Volatility indicator to check the Volatility criteria visually. For the case of breakout trading, it is sufficient to check the Volatility from the point 1 to the point 4 only. It is because we might expect the fast movement between the point 3 and the point 4. Hence, in Figure 5.1-18, we need to see the point 4 is contained within or near the neutral area (N) in the Harmonic Volatility indicator.
Figure 5.1-18: Volatility check form the point 1 to point 4 with Fibonacci Expansion pattern in XAGUSD H1 timeframe
When your purpose is to measure the Volatility for the breakout trading, it is important to locate the movable Harmonic Volatility indicator to the open price of the candle bar. In some cases, you can locate the movable Harmonic Volatility indicator directly to peak or trough. For example, when you want to use the Harmonic Volatility indicator like Gann’s angle, then it might be better to locate the movable Harmonic Volatility indicator directly to peak or trough. In the breakout trading, our purpose is not getting the support and resistance. Hence, it is better to use the open price of candle bar. However, this is only recommendation though.
Figure 5.1-19: Example of locating the movable Harmonic Volatility indicator to the candle bar
One might find that the breakout trading introduced in this chapter is similar to ride the wave 3 in the Elliott Wave theory. It is possible although we have not go through the full details of Elliott Wave analysis. However, the advantage of the breakout trading introduced in this chapter is simple and quantified with the Volatility analysis. Hence, there is less room for the subjectivity. The reversal trading and the breakout trading are the two main logic of the day trading. Until you try both, you will never know with which one you are good. Our recommendation is to stick with what you are good at first. Once you have mastered one strategy, then you can move on to another one.
About this Article
This article is the part taken from the draft version of the Book: Predicting Forex and Stock Market with Fractal Pattern. This article is only draft and it will be not updated to the completed version on the release of the book. However, this article will serve you to gather the important knowledge in financial trading. This article is also recommended to read before using Fibonacci Volatility Indicator, which is available for MetaTrader 4 and MetaTrader 5.
Below is the landing page for Fibonacci Volatility Indicator for MetaTrader 4 and MetaTrader 5.
https://www.mql5.com/en/market/product/52670
https://www.mql5.com/en/market/product/52671
https://algotrading-investment.com/portfolio-item/fibonacci-volatility-indicator/
Related Products

