Reward Risk Ratio
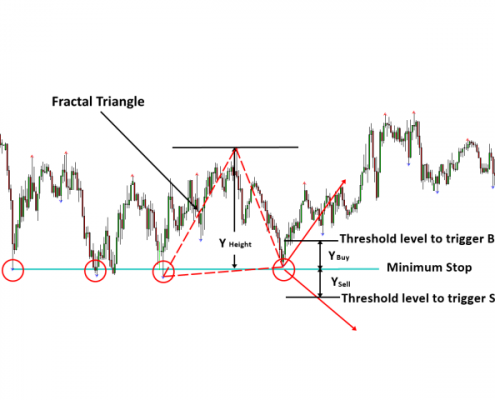
Support Resistance is the most trusted technical analysis in Forex and Stock market. However, setting good reward to risk ratio for the support and resistance is not easy, expeically if you are using support and resistance everyday. Hence we provide one effective risk managment tool for the support and resistance trading. In the book: Scientific Guide To Price Action and Pattern Trading (Wisdom of Trend, Cycle, and Fractal Wave), how to use Support Resistance is described as well as Fibonacci Analysis, Harmonic Pattern, Elliott Wave Theory and X3 Chart Pattern. In the book, the concept “Trigger Level” for support and resistance was introduced. Trigger Level is the entry price offset from the support and resistance based on Fractal Triangle. This Trigger Level concept was introduced to avoid the false breakout or false reversal signal around the support and resistance as well as for the risk. The essence of the trigger level concept is to use the fractal triangle around support and resistance to set minimum stop, entry and profit target. We provide two implementations of this trigger level concept including Symmetrical Trigger Level and Symmetrical Fibonacci Retracement.
Identify Support Resistance to Trade
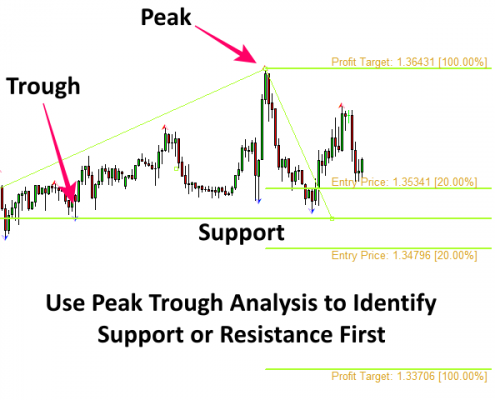
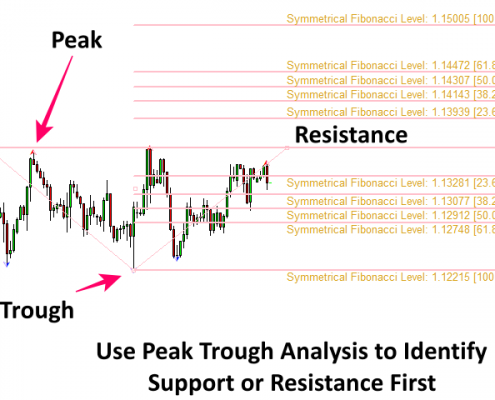
Support and Resistance was orignally created to react to the market (Although it can predict the market direction. We will not explain this here). Use the provided Peak Trough Analysis to identify the important Support or Resistance. Once you have drawn the support or resistance line in your chart, half of work is done. Next, you will wait until price is pushed to one direction by crowd, then you will follow the price (=react to market). The is the most genetric scheme to trade with support and resistance.
Risk Management with Support Resistance
Once you have drawn the support or resistance, the trigger level concept suggests you to identify three important price including minimum stop, entry price and profit target to manage risk.
* Minimum Stop: This is often support or resistance itself. As price can revist the support or resistance , it is best to provide some margin from this minimum Stop Loss level
* Entry Price: Entry price is used to avoid false breakout or false reversal signal. Whether you are trading with the first wave or third wave from the support resistance, this price is important.
* Profit Target: First price level you can use as the profit target is the height of Fractal Triangle as we assume that price can revisit the peak or trough in your chart. Depending on your market condition, your profit target can be greater than the height of Fractal Triangle. If the market condition is less favourable to the trading direction, then you can set profit target slighly less than the height of Fractal Triangle.
Add Risk Management Tools to Chart
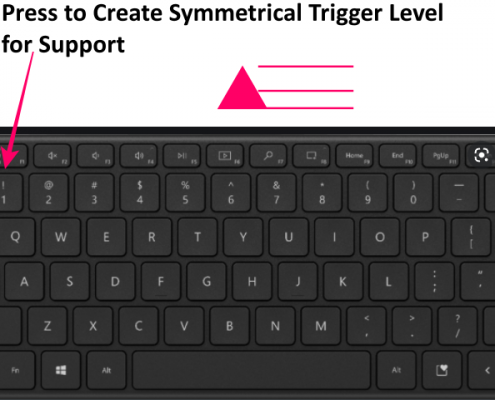
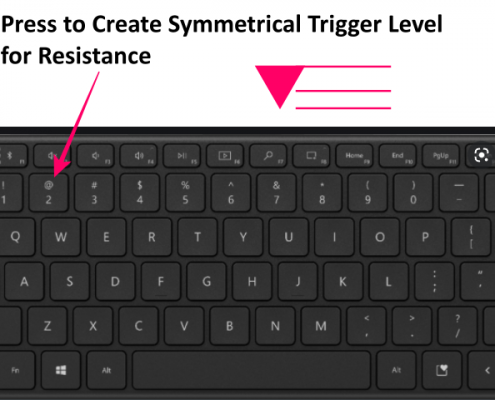
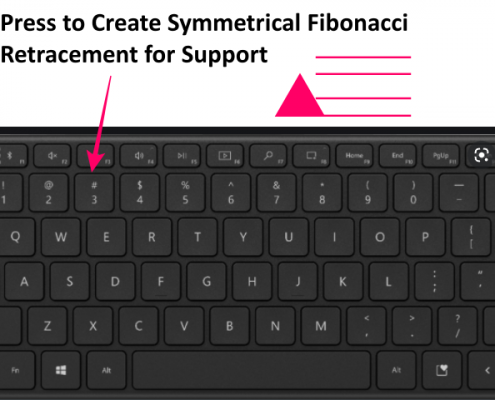
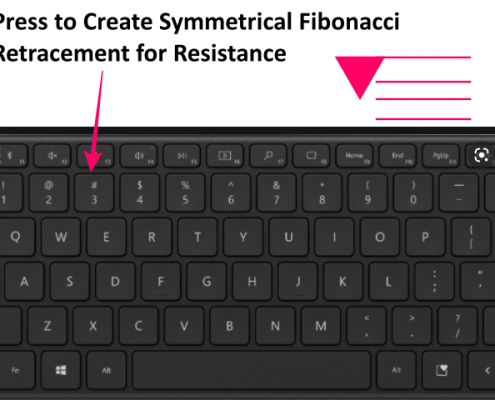
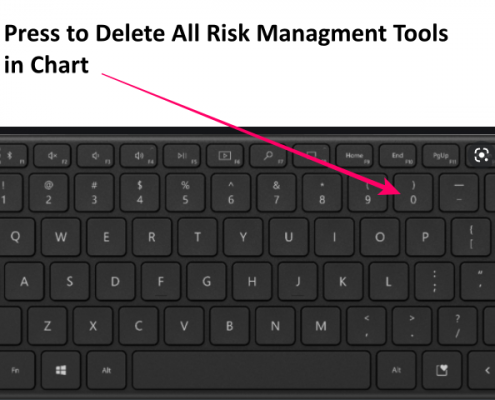
You can access the risk management tool from the Support Resistance Risk Managment using the number keys. Firstly, attach the indicator to your chart. Then use the following number keys to insert or delete the risk management tools.
Number Key 0: Delete All Risk Management Tools in your chart
Number Key 1: Add a Symmetrical Trigger Level for Support or trough peak trough fractal triangle.
Number Key 2: Add a Symmetrical Trigger Level for Resistance or peak trough peak fractal triangle.
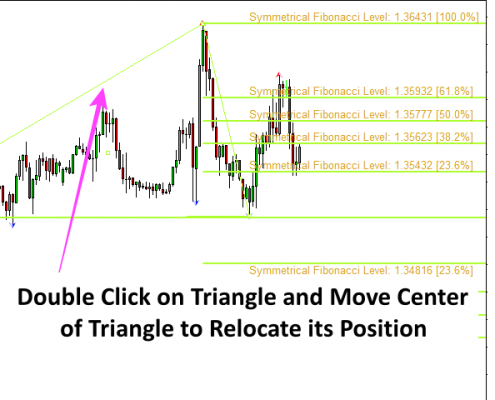
Number Key 3: Add a Symmetrical Fibonacci Retracement for Support or trough peak trough fractal triangle.
Number Key 4: Add a Symmetrical Fibonacci Retracement for Resistance or peak trough peak fractal triangle.
Drag to Adjust Location and Size
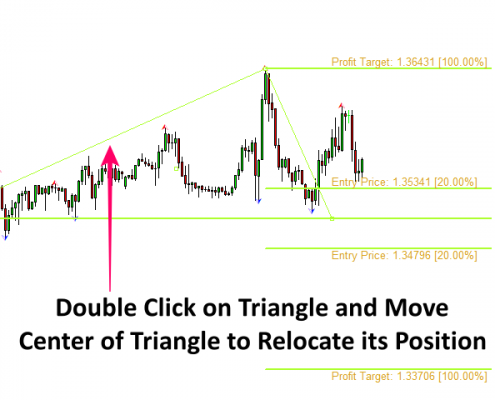
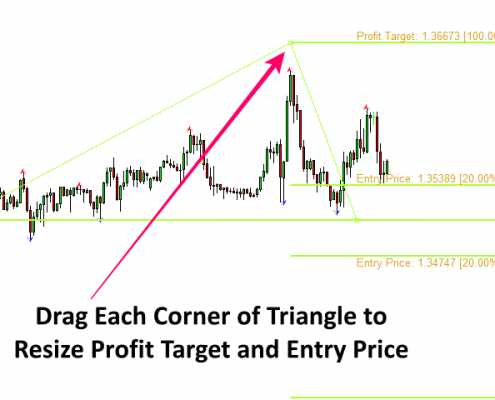
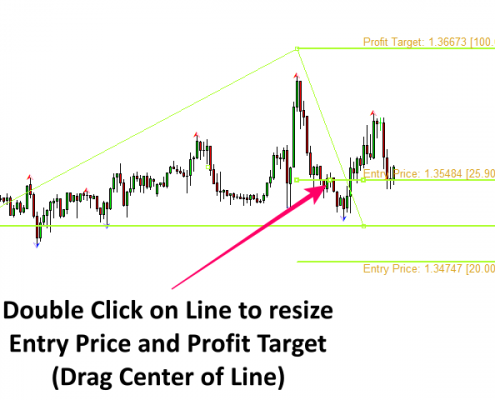
Once the risk management tool is added to a chart, the you can relocate the tool by dragging the center of the fractal triangle. By dragging the top or bottom corner of the triangle, you can also fit the size of fractal triangle around your support and resistance. Your task here is to locate the Fractal Triangle in most sensible price.
Indicator Alert
Sometimes, you can draw the support and resistance before price approaches near the support and resistance. In this case, you might have to wait until the price approaches near the support and resistance. When the risk management tool is placed in your support or resistance, it will send the alert when the price arrives near the support and resistance. You can control it by Alert Percent input.
Support Resistance Indicator Guide
Support Resistance Indicator Guide
Important Note
This is the off the shelf product. Therefore, we do not accept any modification or customization request on this product. In addition, we do not provide any code library or any support for your coding for this product.

