Support Resistance Indicator
In this article, we will explain how to use Support Resistance Indicator for Forex and Stock trading in terms of technical analysis. Support Resistance is the popular and the most trusted technical analysis. It lasted more than 100 years in the trading community. You can tell how much trust people have on the support and resistance. Idea behind the support and resistance is picking the price level to trade. When you pick the right price level, you will end up good rewards that is profits. Trading around support resistance can provide two to three times more volatilty. Hence, there is nothing wrong with using this simple but powerful technical analysis. Comparing to other techncial analysis, it is much simpler. Being simpler will not penalize the support and resistance from rest of techncial analysis as long as it does its job.
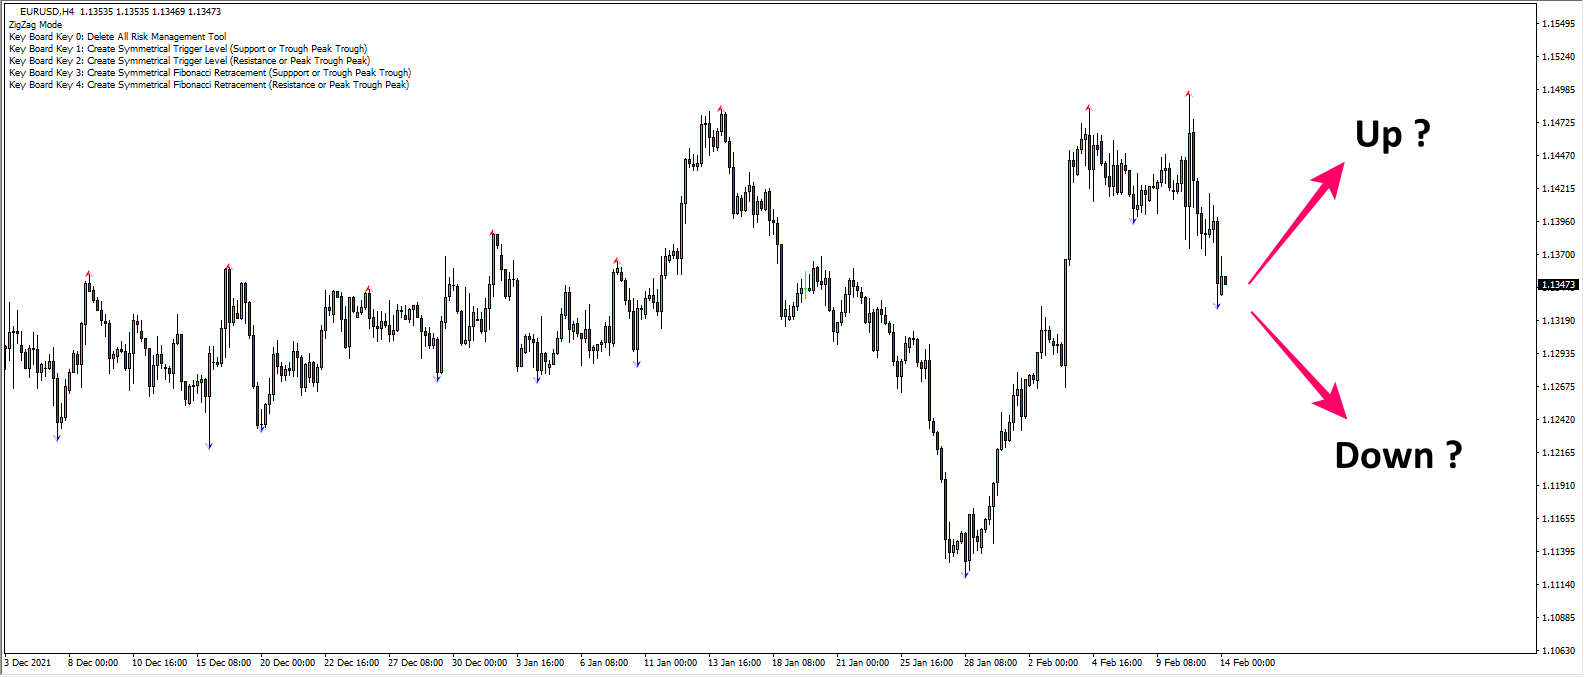
Let us have a look at some basics. While we are looking at the chart like below, we know that it is hard to predict if the price will go up or go down. There is uncertainity in many ways to predict the price movement at the moment.
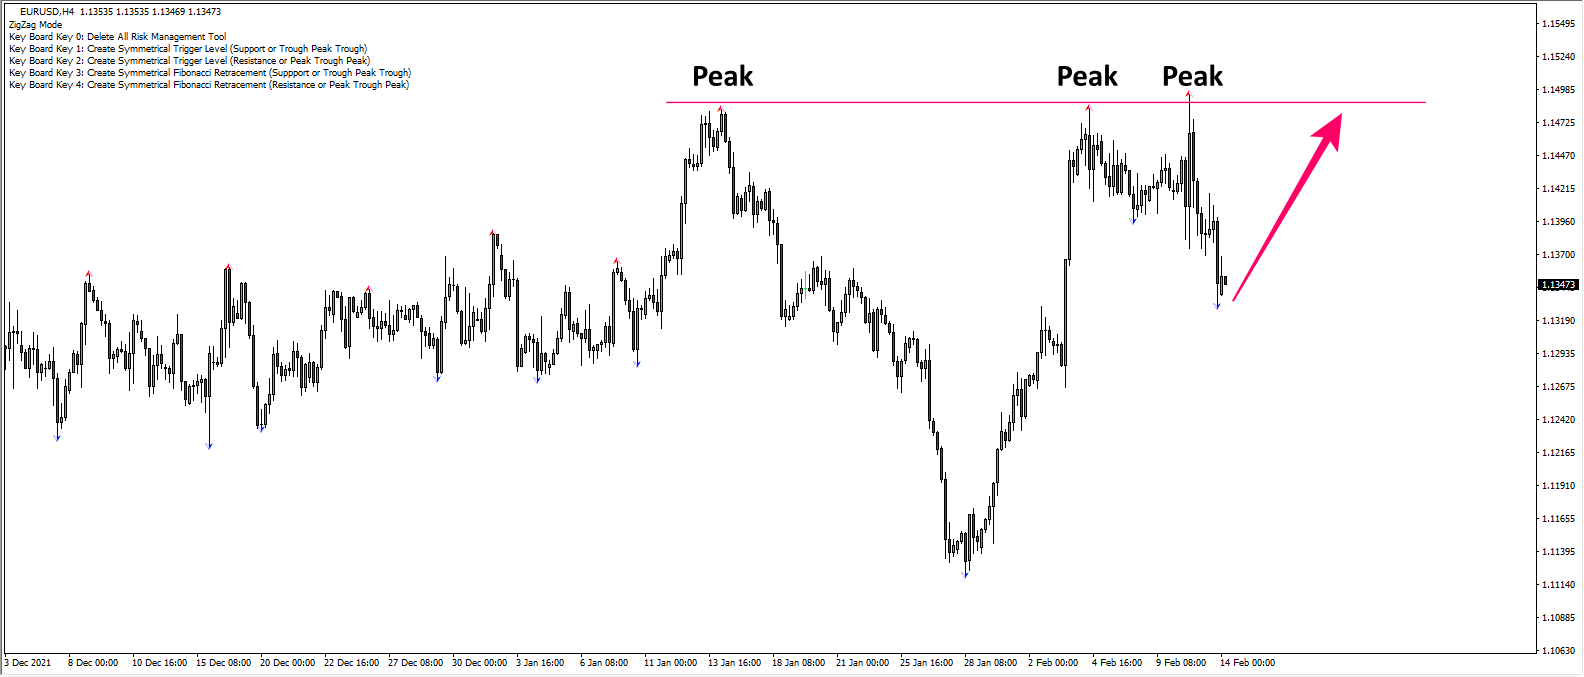
However, if the price approaches up toward the aligned peaks, then we know that soon we can have a good trading opportunity. I do not have to teach you this because this is a part of our pattern recognition ability. When more than two peaks are alinged in one straight line, this tells that market has the memory around the price. What does this mean? This means if the price approaches the price again, then there could be a big volatility or big price movement. We will trade to the direction in which price is pushed by crowd. In another words, we will react to the market. This is the original concept of the support and resistance trading (=react to market). Depending on which direction you follow, it could be the breakout trading or reversal trading. Altough it is possible to predict the market direction using the support and resistance, we will suppress this for now as this is more advanced concept of trading.
Support and resistance is all about looking for the market memory. We identify the market memory by connecting several peaks and troughs in one straight line. When you connect more than two peaks, the straight line becomes resistance. When you connect more than two troughs, the straight line becomes support. In practice, it is possible to include peaks and troughs in resistance. Likewise, it is possible to include peaks and trughs in support too. You can extend the text book defintion bit further when you practice. As long as you can connect the peaks or troughs in a straight line, they could become the important support or resistance.
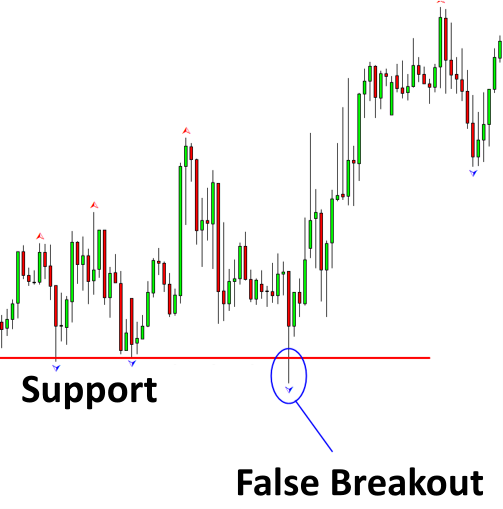
As long as you have the support resistance indicator doing the automatic peak trough analysis, drawing the support and resistance is simple. Especially, when the monatary rewards follows after picking the good support and resistance, it is even fun. However, drawing support and resistance could be harder if you have to do it in the raw chart. Hence, we will always recommend using the automatic peak trough analysis to avoid any subjectivity. Now we know that you can draw support and resistance well. However, there is one problem that are not addressed well in using support and resistance anywhere in the internet. They are often left as the grey area in our trading. That is the risk management for the support and resistance. For example, price around support and resistance can provide you the false breakout and false reversal signals.
The ways to avoid the false breakout or false reversal signal around the support and resistance is described in detail in the book: Scientific Guide To Price Action and Pattern Trading (Wisdom of Trend, Cycle, and Fractal Wave, 2017). In the book, the concept “Trigger Level” for support and resistance was introduced to deal with this false breakout and false reversal trading signals. The idea behind the Trigger Level concept is to offset the entry price from the support and resistance with some margine. This way we have a control over the false trading signals. In addition, the Trigger Level concept yield the money managment for support and resistance trading too. For eaxmple, the trigger level can help setting the minimum stop price, entry price and profit target price. With these three prices are set, you can have a complete control over the market risk.

As described in the book, you can extend the trigger level into two implementations. First one is the Symmetrical Trigger Level using the propotion rule and second one is Symmetrical Fibonacci Retracement using the Fibonacci analysis. To add Symmetrical Trigger Level in Support Resistance Risk Management MT4/MT5 tool, press the number key 1 for support and the number key 2 for resistance. To add Symmetrical Fibonacci Retracement in Support Resistance Risk Management MT4/MT5 tool, press the number key 3 for support and the number key 4 for resistance.
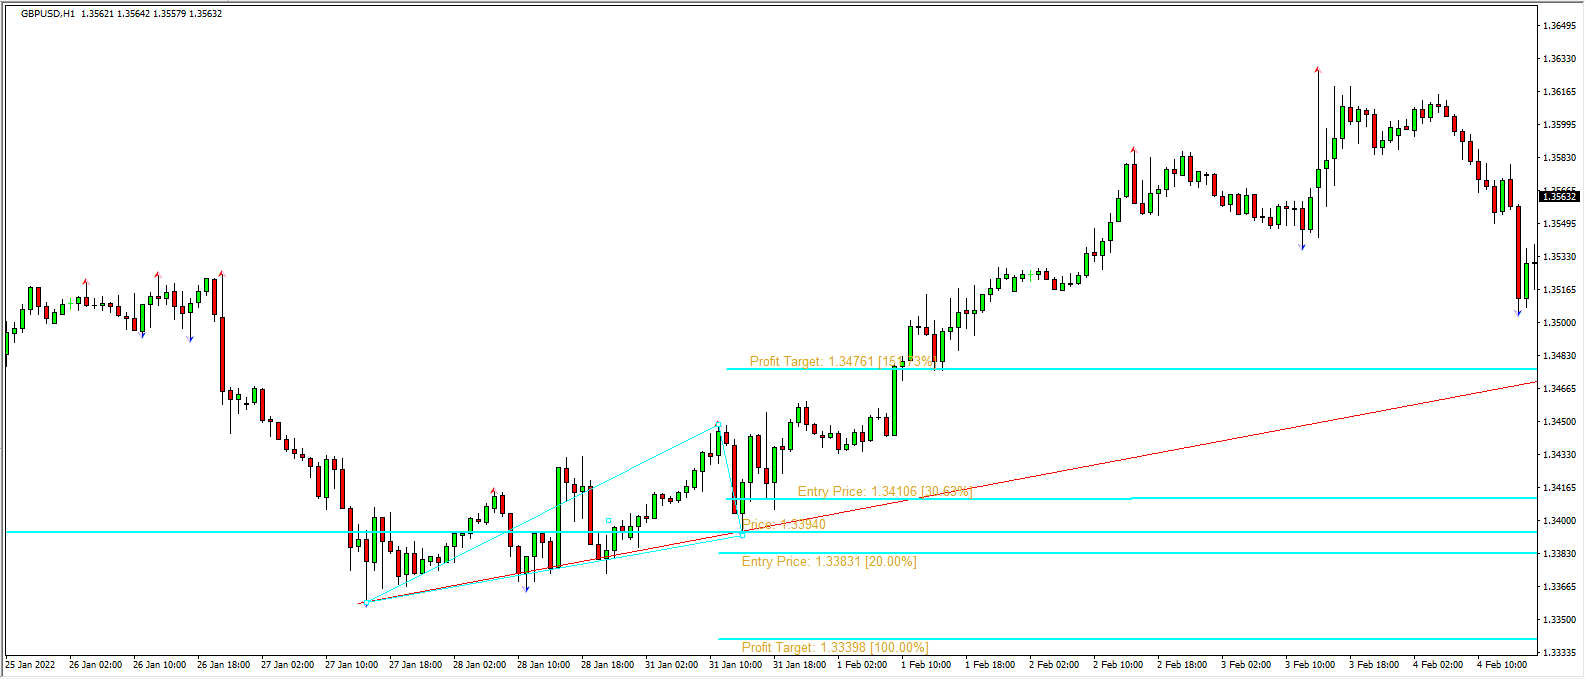
Below the screenshot shows the Symmetrical Trigger level applied to the resistance. Buy entry and sell entry price are set using the height of the Fractal Triangle. In this example, entry price was set to 20% height of the Fractal Triangle. Assuming that price approached near the resistance, you will enter the buy position if the price moves over the buy entry price. Likewise, you will enter the sell position if the price moves below the sell entry price. In addition, the entry price is adjustable to 15% or 25% and so on.
According the the market memory, the known peak or trough can be revisited. Hence the first sensible profit target is to use the trough of the Fractal triangle. In another words, profit target is set to 100% of the Fractal Triangle. However, if the surrounding market condition highly favours our trading direction, then you can increase the profit target to 120% or 200%. If the surrounding market condition is less favours our trading direction, then you can reduct the profit target to 70% or 80% and so on.

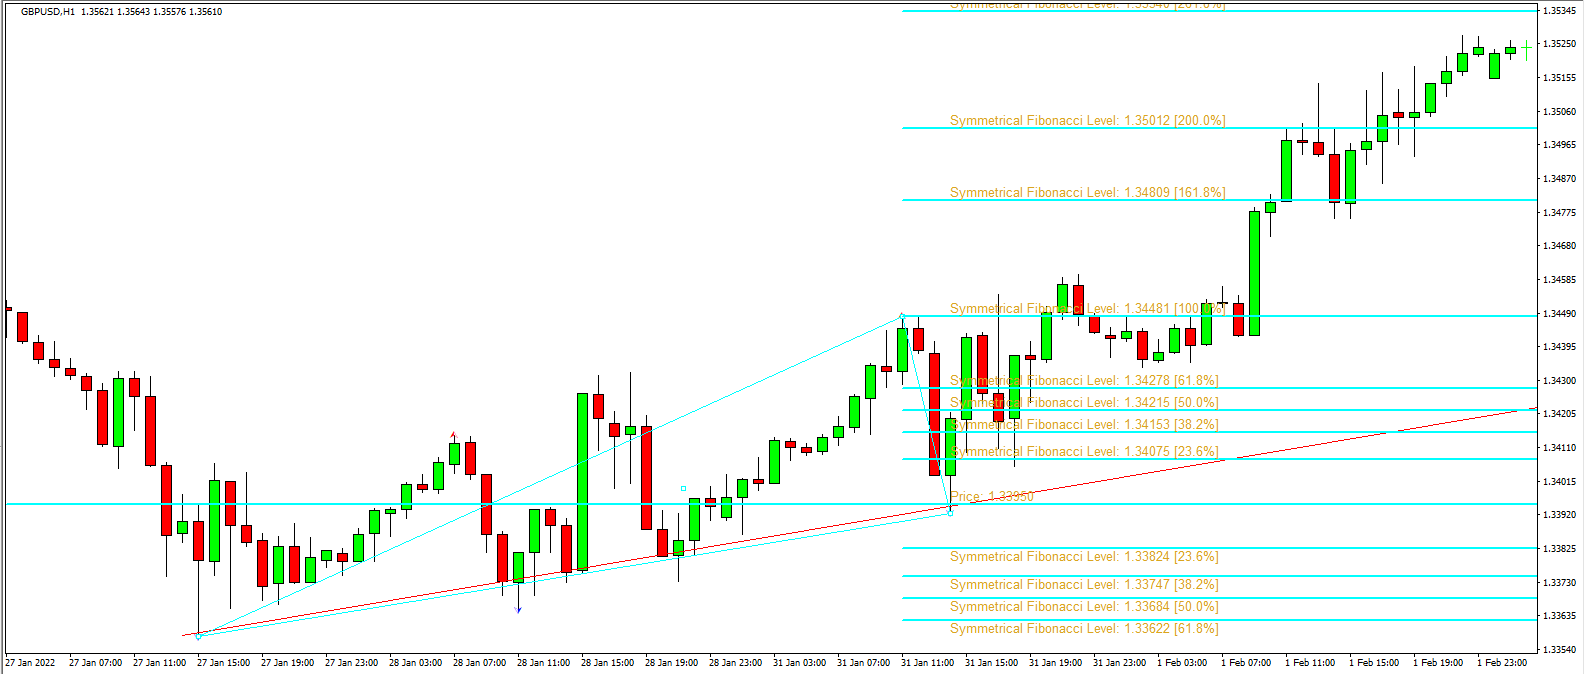
Below the screenshot shows the Symmetrical Fibonacci Retracement applied to the resistance. Buy entry and sell entry price are set using the height of the Fractal Triangle with Fibonacci Analysis. We have more price levels to use comparing to the Symmetrical Trigger Level. Using the Symmetrical Fibonacci Retracement is exactly the same as the Symmetrical Trigger Level. However, if you are looking to trade on wave 3 instead of wave 1, then Symmetrical Fibonacci Retracement might be more convenient to use. This does not mean the Symmetrical Trigger Level can not be used to trade wave 3. I am just saying that there could be some personal preference using between them. If you want to delete any Symmetrical Trigger Level and Symmetrical Fibonacci Retracement in Support Resistance Risk Management MT4/MT5, then you can press number key 0.

YouTube Video for Support Resistance Risk Management
You can also watch this YouTube video to understand the Risk Management with Support and Resistance (Link: https://youtu.be/iF2rVerxg_s)
Support Resistance Indicator for MetaTrader (Paid)
We provide the Support Resistance Indicator that are cost effective and highly accurate using the original concept of the Trigger Level. You can use the following Support Resistance Indicator for MetaTrader. You can start to trade like Pro.
Support Reistance Risk Management MT4 for MetaTrader 4: https://www.mql5.com/en/market/product/77887
Support Resistance Risk Management MT5 for MetaTrader 5: https://www.mql5.com/en/market/product/77886
Landng Page for Support Resistance Risk Management: https://algotrading-investment.com/portfolio-item/support-resistance-risk-management/
Peak Trough Analysis For MetaTrader (Free)
If you want to use the support and resistance indicator for free, we recommend using the peak trough anlaysis indicator to draw the support and resistance. Peak trough analysis is the good indicator to identify the important support and resistance. We developed the Peak Trough Analysis indicator and We provide the peak trough analysis for free for every one. You will probably want to know the difference between Peak Trough Analysis (Free) and Support Reistance Risk Management Indicator (Paid). In fact, the Support Reistance Risk Management Indicator includes Peak Trough Anslysis + Risk Management Tool within one indicator, which helps you to draw the support resistance lines as well as calculating your risk reward ratio for your trading based on the identified support and resistance lines.
https://algotrading-investment.com/2019/08/29/how-to-download-peak-trough-analysis-tool/
Trading with Diagonal Support and Resistance (or Trend Line)
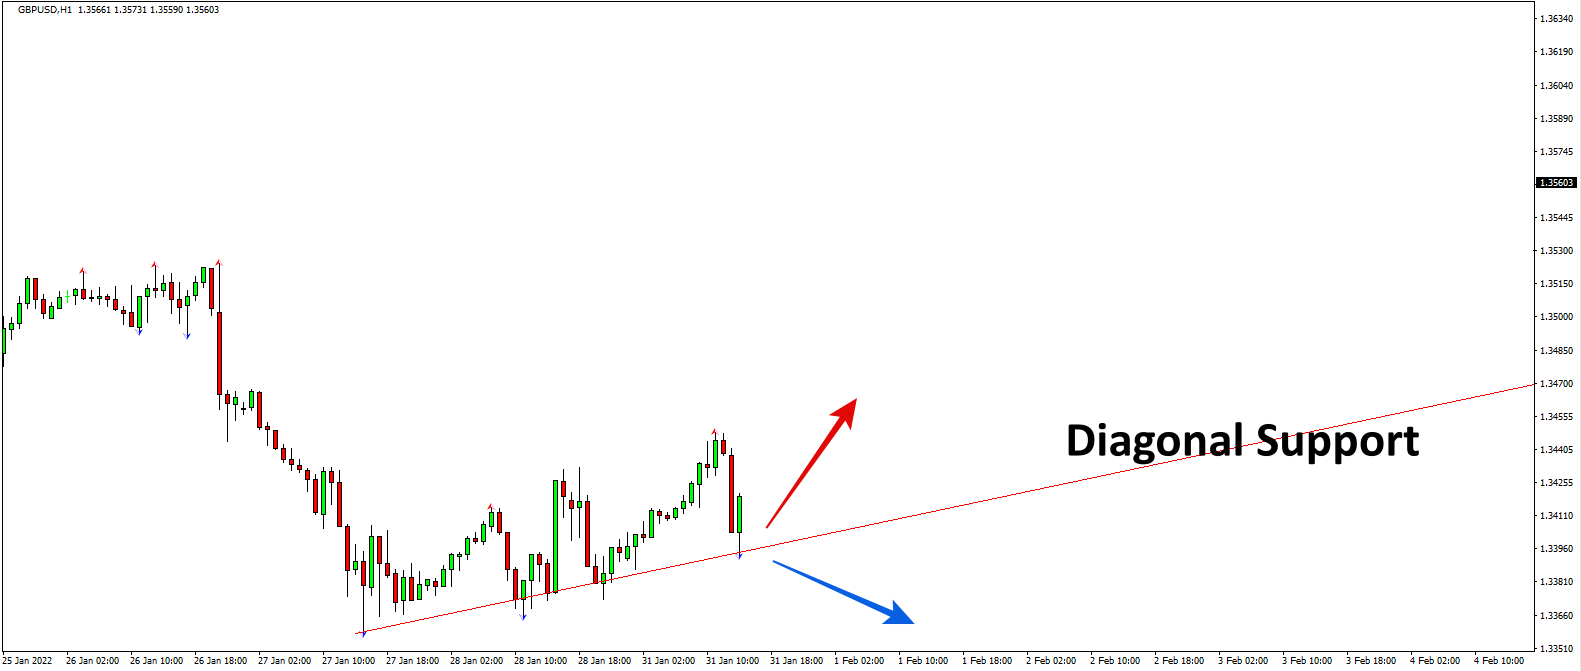
The concept of Trigger Level can be extended further with trading with Diagonal Support and Resistance lines. Sometimes, the diagonal support and resistance lines are called trend lines. Although it requires more skills to trade, the diagonal support and resistance can provide sufficiently good trading opportunities if you can spot some continued trend patterns. However, just like the case of horizontal support and resistance, the risk management part is left in the grey area. The Trigger Level concept can provide the solid trading models for the diagonal support and resistance. For example, consider that you have identified following diagonal support line or continung trend pattern. That was a really good attempt that you have spotted this trading opportunity.
Even after you have drawn this important line, you still have to ask few other important questions. The questions like, when you will enter ? or Which direction you will follow ? Which price level we should take profit ? or Which price level we should take the loss ? and so on. The Trigger Level concept will provide you the answers to all these remaining questions. For example, with the Symmetrical Trigger Level tool, your chart will look like this. With one button click, you can draw all these important graphics like your entry price, profit target and stop price automatically.
You can do the same with Symmetrical Fibonacci Retracment tool. If you prefer to use the Fibonacci Ratio over the proportion rule, then it is more than fine. You can also drop this graphics with one button click with the Support Resistance Risk Managment MT4/MT5. Then you can use each price levels to determine your entry, profit target and stop price. You can even find out the possible entry for third wave if you like.
Related Products


