Identifying Order and Disorder in Chaotic Market with Elliott Wave
In this article, we will explain how to identify order and disorder in the chaotic market with Elliott Wave Analysis. As a trader, you will agree that scientific method can improve your profits. Whether you are using correlation, geometric patterns, or statistics, they are based on science. Even latency arbitrages are just a sort of computer science or engineering, one could dig deeper on how to fine-tune the algorithm, network and internet speed to beat others. If any trading strategy has persistent dynamics towards profitability, we can formulate or describe their working mechanism using known science and engineering principle. Hence, we can reproduce the profit using the same mechanism repeatedly. Most winning trading strategies can be described by a science or engineering principle. Profit will never come by a chance. The profit comes from our understanding of the market.
Topic in this article is partly about chaos theory. As one knows, chaos theory as in nonlinear dynamics is a hard-core math topic. However, we will not touch the complex theory because this article is for average trader. The focus of this article is to provide some intuition over this hard science, chaos theory but without getting into the hard science. Chaos theory reveals several characteristic for some dynamic system like stock or currency market. Here is the list of four important characteristics:
- Highly sensitive to initial condition (i.e. Butterfly effect)
- Feedback loop
- Order/Disorder
- Fractals (i.e. self-similarity)
- Etc
Firstly, scientist often uses the term butterfly effect. This term describes the situation in which a butterfly flapping its wings in New Mexico cause a hurricane in China. A different way to express this is that small changes in the initial condition can lead to drastic changes in the results. We can meet full of similar examples in our life. One example of butterfly effect is that the rejection of an art application lead to World War Two. This is probably the most widely known butterfly effect. In 1905, Adolf Hitler applied to the Academy of Fine Arts in Vienna. He was rejected twice. After his rejection, he was forced to live in the slums of the city and his anti-Semitism grew. He joined the German Army instead of fulfilling his dreams as an artist. World would been changed a lot if Academy of Fine Arts accepted him.
Secondly, feedback loop describe that systems often become chaotic when there is feedback present. A good and relevant example is the stock market. As the value of a stock rises or falls, stock traders tend to buy or sell that stock. This feedback from stock traders will further affect the price of stock going up and down chaotically. This feedback loop produces the fractal wave or equilibrium fractal wave in the market.
Thirdly, chaos is not necessarily disorder although people use the term chaos interchangeably with disorder. Instead, chaos suggests that a system can transition between order and disorder. In turn, order and disorder is connected to the predictability and unpredictability of the financial market. In some science, this is called entropy. In fact, this is the main topic of this article. We will get back to this later.
Fourthly, a chaotic system can exhibit fractal pattern. We have wrote the comprehensive description on how to use this characteristic in our trading. Please refer to the book: Financial Trading with Five Regularities of Nature: Scientific Guide to Price Action and Pattern Trading. We will not reintroduce this in this article.
We have briefly covered four main characteristics of a chaotic system. Stock and forex market are the live example of a chaotic system. Order and disorder in chaos theory describe that the financial market can transition from order to disorder or from disorder to order. Order and disorder are highly related to the predictability and unpredictability of market. Ordered market is much easier to predict whereas disordered market is hard to predict. Every trader will agree that sometimes market is easy to predict with some simple technical analysis. Sometimes, the market is almost unpredictable no matter what kind of information or analysis on your hands. If you felt this, then you are probably right. This is the corresponding behaviour of order and disorder described in chaos theory.
As a trader, your will be better off to avoid highly disorder market but to trade on highly ordered market. Unfortunately, order and disorder does not provide the rigid binary states, where you can pick up one or the other. We can only tell that degree of order and disorder. For educational purpose, I always like to present Hurst exponent. Hurst exponent will provide the some indication if the market is predictable or not predictable.
Even though I like to use Hurst exponent for an educational purpose, I do not use Hurst exponent for my trading. Some years ago, inspired from this order and disorder concept, me and my friend tried to use Hurst exponent for several month. Unfortunately, we did not gain much benefit from Hurst exponent for our trading. There can be few reasons for this. Firstly, Hurst exponent was not designed for trading. Secondly, Hurst exponent is not a timing tool for trading. You are fine to use it for some retrospective study in your theoretical research or some educational purpose. However, we do not recommend using it for live trading because the range analysis requires sufficient samples to derive the accurate result. You will experience the typical lagging from the averaging algorithm. Hence, it is more theoretical tool.
As a trader, you will never use lagging indicator because you will sell when market is going up and you will buy when market is going down. Then what could be alternative indicator or analysis to gauge the predictability of the financial market? Here we are talking about techniques we can use for our live trading.
The discovery really came to me by chance. I found that density of specific geometric patterns could be used to effectively spot the predictability of the financial market. Now let us disclose what the specific geometric patterns are first. Now think about the trend with feedback loop in a chaotic market. For uptrend, the price series will move in zigzag form as in Figure 1. While we are reaching the top of our trend, the price will go through several patterns as in Figure 2. Initially it will form 1 triangle, then price will expand to form 2 triangles and 3 triangles. Finally, it will form the 4 triangles (Figure 2). R. N. Elliott saw this much earlier than myself in 1930s in his Elliott Wave patterns. One thing he did not see was that the density of these geometric patterns can indicates the predictability of the market. The “density of these geometric patterns” is simply the count of these geometric patterns at specific time. We use the density or count as to gauge the degree of predictability in the financial market. Probably not every trader would be able to see this in the past. The idea is simple but producing such a tool to count these geometric patterns is a complicated business. I only discovered this while I was developing the template and pattern approach for the scientific Elliott wave counting.
Let us think about how this works. In my opinion, each pattern in Figure 2 represents some degree of order in the financial market. Especially when we observe two, three, or four triangles moving in the path of trend, we can tell that there is high order. At the same time, the fractal nature of financial market exhibits these patterns in many different scales. At the specific time, small and large scale of these patterns can be overlapping to form more solid evidence of order as shown in Figure 4.
What is the practical implication of this for our trading? The density of these geometric patterns tells us when the financial market is highly predictable and when not (Figure 7). As we have mentioned, you will be better off to trade when the market is more predictable of course.
Trader might ask question if the ratio in each pattern in Figure 2 is matter because they trade often with Fibonacci ratios. The answer is no in this case because we are only concerning the trend movement. In the trend movement, the direction of triangle is matter but the triangle can be formed in any ratios. However, if you are counting the specific Elliott Wave pattern, then you have to use a specific ratio to predict the trading direction. This is a separate concern from identifying high order or highly predictable market state. Elliott Wave trading principle is well built inside our Elliott Wave Trend. There is no need to worry about this.
In addition, be precise that the density of these geometric patterns concerns the order and predictability of the financial market. Knowing the predictability will not cover your entire trading setup. For detailed trading entry or exit, you will need to use the specific entry and exit tool.
For example, of course, you can use Elliott wave pattern to make your trading entry and exit complete. That is already built inside Elliott Wave Trend. For example, in Figure 5, we have shown that the turning point is coincided with the Wave 4 location of Elliott Wave 1234 pattern. You can setup buy entry with this logic.
However, Elliott Wave pattern is just one of the trading strategy you can use. Once you have identified that market is in high order or highly predictable state, you can always use other proven trading strategies. For example, in Figure 6, we can see that AB=CD pattern gave us the identical buy signal too. What trading strategy you are using is really depending on your skills and discipline.
If you still want even simpler explanation, then use this two-step trading process.
- Identify the high order or highly predictable timing in the market (Figure 7).
- Apply your favourite trading strategy for the detailed market entry and exits including Elliott wave, harmonic pattern, supply demand or price breakout patterns, etc.
Finally, one might ask if they can go beyond 4 triangles like or 5 triangles or 8 triangles to calculate the density. From my empirical study, it is rare to see anything above 4 triangles. In this point, my empirical study and R. N. Elliott observation agrees. That is why Elliott comes up with Elliott Wave 12345 pattern and not Elliott Wave 12345678 pattern.
Final Note:
We hope this is useful for your profitable trading. Elliott Wave Trend has the following automatic features:
- Detect the density of geometric patterns (identifying order and disorder of financial market.)
- Automatic Elliott Wave Counting for trading.
- Manual Elliott Wave Counting for trading.
- Automatic Wave Structure Score calculation.
Here is the links to our Elliott Wave Trend for MetaTrader 4 and MetaTrader 5.
https://www.mql5.com/en/market/product/16479
https://www.mql5.com/en/market/product/16472
https://algotrading-investment.com/portfolio-item/elliott-wave-trend/

Zig Zag price movement
Figure 1: Zig Zag price movement for uptrend.

price patterns in the course of trend movement.
Figure 2: Four geometric price patterns in the course of trend movement.

the price patterns in chart
Figure 3: Count of the price patterns in chart.

the geometric patterns in chart
Figure 4: Count of the geometric patterns in chart.

Elliott Wave 1234 identification
Figure 5: Elliott Wave 1234 identification.

AB=CD pattern at highly predictable time
Figure 6: AB=CD pattern at highly predictable time.
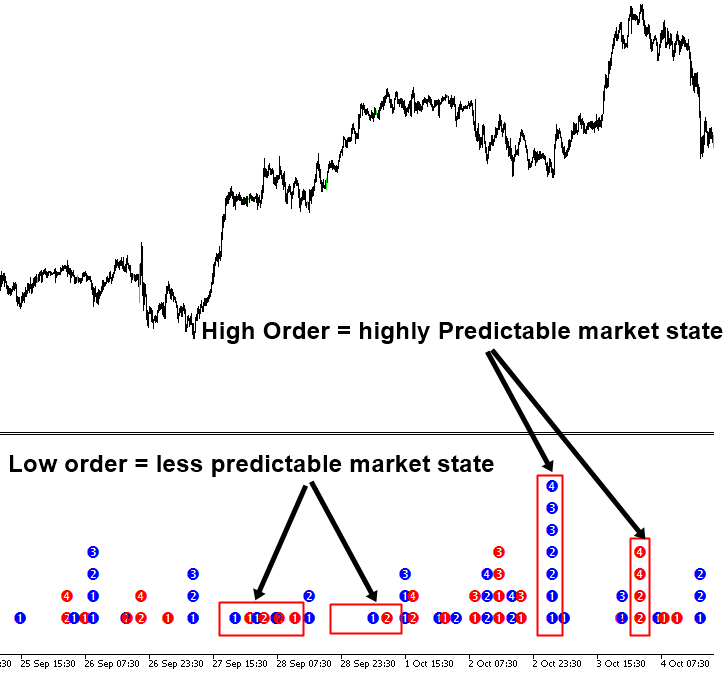
Order and Disorder identification from Elliott Wave
Figure 7: Order and Disorder identification from Elliott Wave Trend
Related Products