Correlation Matrix Based Trend Indicator
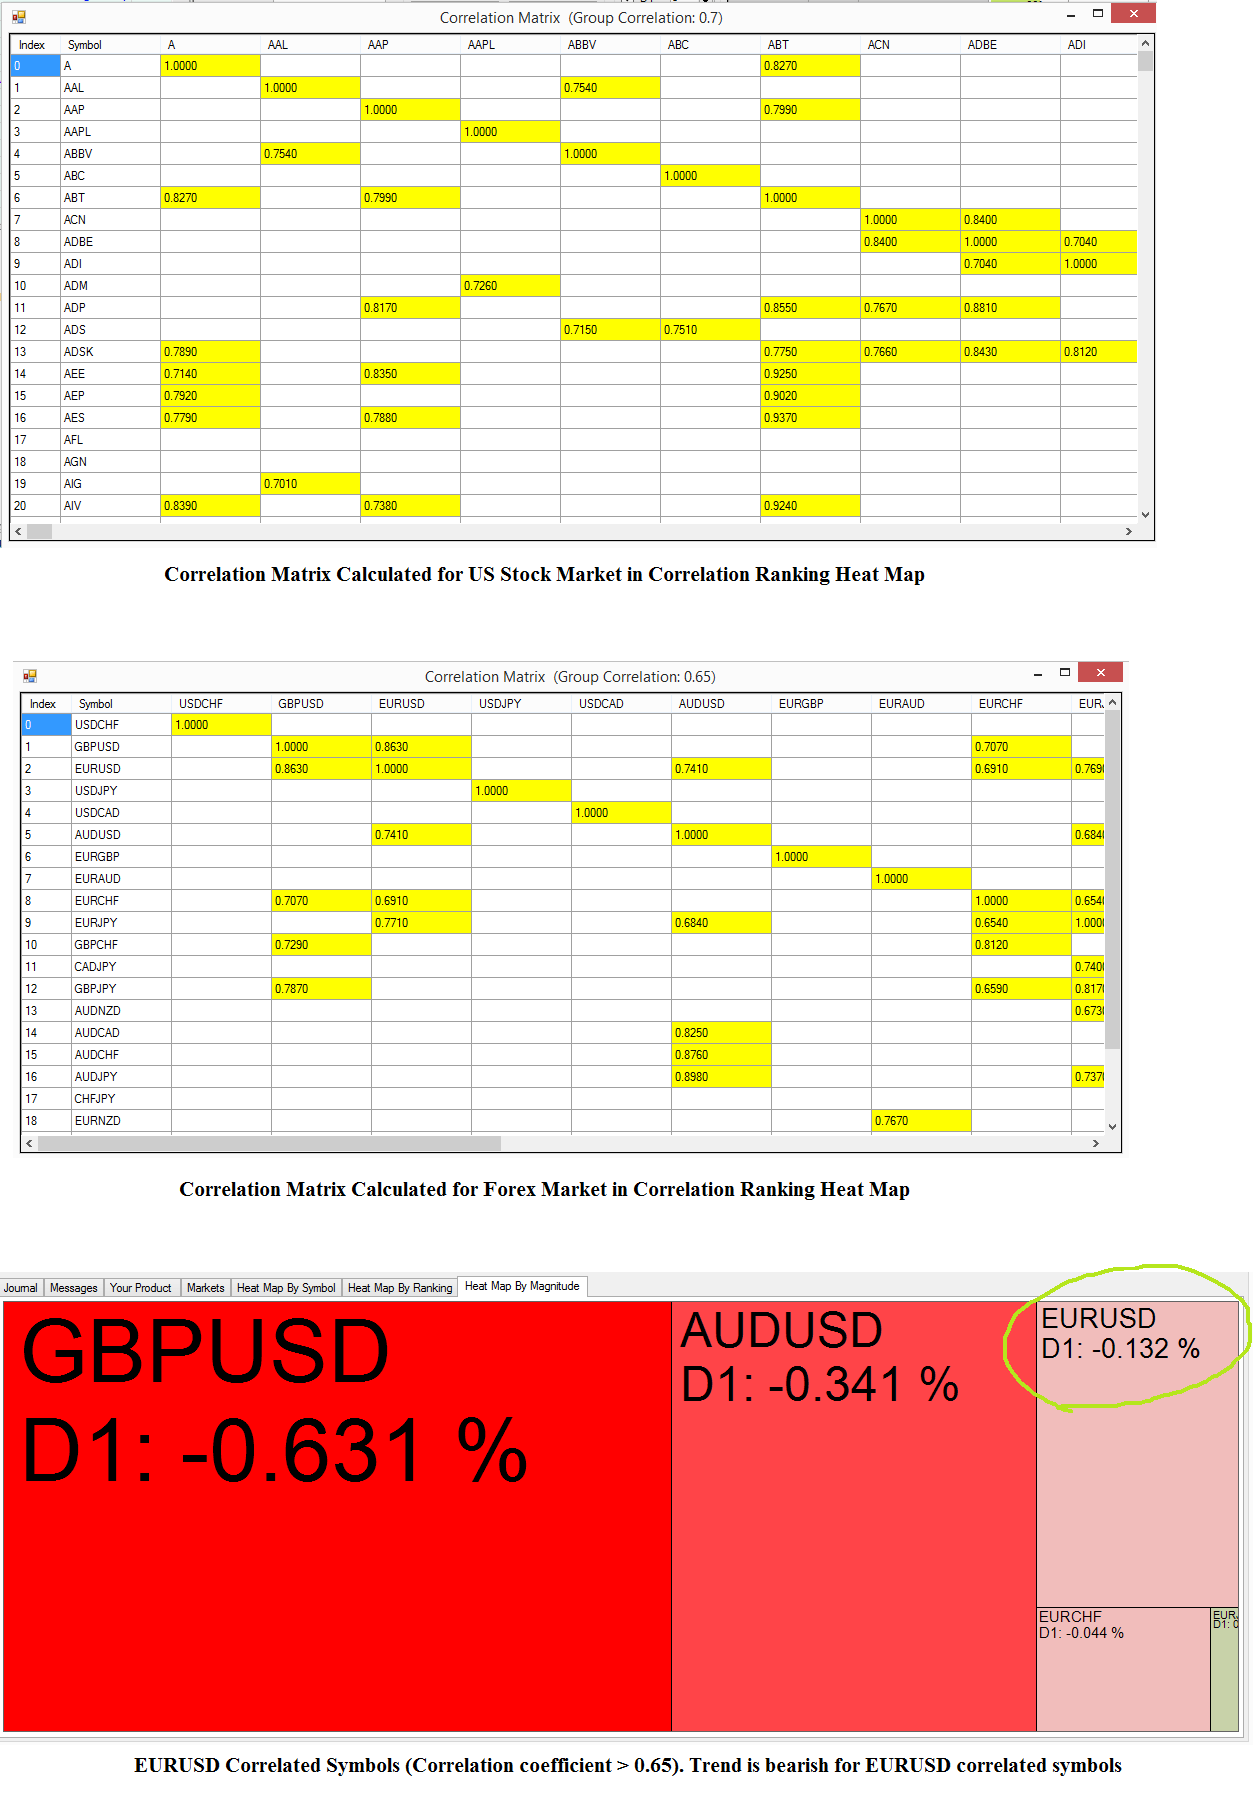
Correlation Ranking Heat Map is the Correlation Matrix based Trend indicator. Correlation Ranking Heat Map calculates the cross correlation of all possible combination of entire market data. Then after, you can use these useful relationship among symbols to identify the potential market direction of any symbol you want. Yet, the rigorous calculation is done at the background. For your trading, you just need to press few buttons to bring the essential information for your trading.
Then how do we use the cross correlation to find out the trend or trend strength of each symbol. Correlation basically find out the relationship or co-movement of two or more symbols. When they are highly correlated, we can group these similar behaving symbols in one basket. What does this mean for your trading ?
To explain in layman’s term, say that, John is first year student in the Aspire Primary School. Now, you know that Mary, also another first year student in the Aspire Primary School, is going to picnic to Disney land tomorrow. Then without even asking to John, we can guess or predict that John is also in the group going to Disney land tomorrow.
Of course, the chance of John joining to the picnic group is subject to some probability because he might be sick on the day. But still, the chance of John joining to the picnic group is higher than not. In summary, correlation helps us to predict the behavior of individual.
This is the underlying idea behind this Correlation Matrix Based Trend Indicator. Instead of looking at one symbol, you are looking at multiple of highly related symbols to find out their trading direction.
Considering most of technical indicator is calculated on one symbol data, this correlation strategy utilizes multiple of symbol data to find out more accurate trend direction than typical technical indicator. In correlation ranking heat map, we do not mix it up with other lagging indicator but we just make the direct use of price movement itself in deciding trend direction. So the strategy is also partly related to the price action across multiple symbols.
For your information, Correlation Ranking Heat Map is the exclusively developed propriety trend indicator in house from concept to application. The Correlation Ranking Heat Map is the first and only one technical indicator fully utilizing the power of correlation matrix.
Here is the link to our Correlation Ranking Heat Map.
https://algotrading-investment.com/portfolio-item/correlation-ranking-heat-map/
https://algotrading-investment.com
Related Products


