How to Stop Bad Harmonic Pattern Trading with Correlation Analysis
In this article, we will be discussing how to filter out some of bad harmonic pattern trading with the relationship between different instruments. When I use Harmonic Pattern alone for my trading, probably with some technical indicators together, I feel guilty. It is because many textbooks will recommend you to use the inter-market analysis as part of our prediction.
Including myself, most of readers reading this article will probably not able to go that far with the inter-market analysis. I will explain the reason why in step by step.
Firstly, this is the simple definition of inter market analysis from:
https://stockcharts.com/school/doku.php?id=chart_school:market_analysis:intermarket_analysis
“Inter-market analysis is a branch of technical analysis that examines the correlations between four major asset classes: stocks, bonds, commodities, and currencies.”
I think this definition is brief and practical too. I like it personally. However, can anyone practice this inter-market analysis readily? Maybe yes or no? Which side are you on? Probably more Nos, I guess.
To use this sort of analysis in our trading, we need to have both the market data in real time plus skills to analyse them. So having skills and the real time market data is the first obstacle for us.
Then what is next obstacle? Let us say that we have real time market data in Excel or Matlab or SAS, or SPSS? What then? You need to start to create bunch of Excel formula or try to write scripts in Matlab to setup data streaming from whatever sources.
Then you need to decide on how to deal with those missing data because Stock, exchange rate and bonds data are never clean. It is just headache after headache.
To get started, we need many hard efforts in first place. If you are trained proficiently in using one of those script language or Excel formula is another significant matter. Understanding correlation is one thing but if your technical skills does not support you, then your understanding on correlation is probably useless. Therefore, your technical skills might be your second obstacle in going forward with inter-market analysis.
I think there are more obstacles here but let us just move on because these obstacles are enough to give us headache anyway. In fact, I think most of us are not ready to use the inter-market analysis.
However, everyone wants to produce more profits. We know that relying on just one currency symbol or one stock market symbol is not sufficient, or at least if you want to go ahead of other trader.
Harmonic pattern trading is good but still its signal is based on one symbol data (or one price series) without looking other data.
This is exactly why I created the Correlation Ranking Heat Map. The concept is probably not exactly same as the inter market analysis. Still it is similar in a way it utilize the insights from multiple symbols as part of our strategy. This is different type of information from technical indicators or patterns, etc because they based on one price series of one symbol.
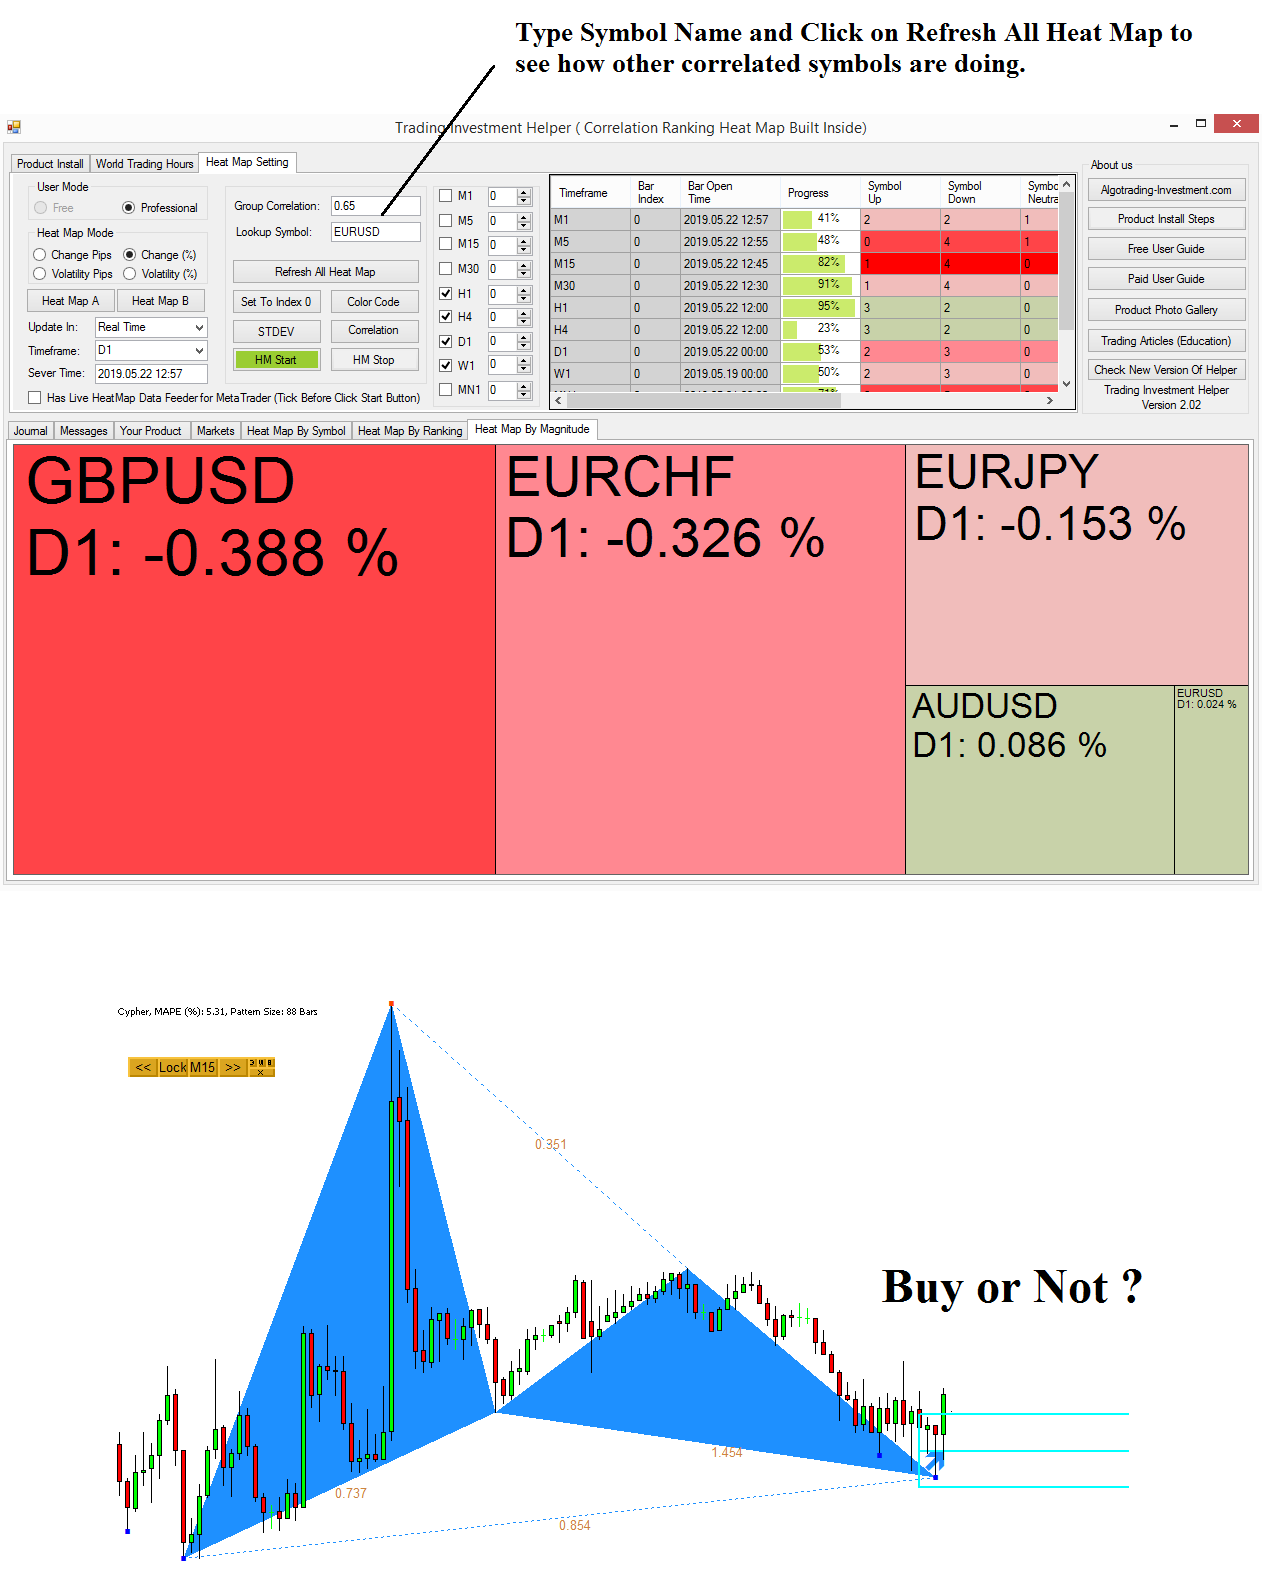
So let us see how this fresh piece of information can improve our harmonic pattern trading. In Correlation Ranking Heat Map, you can quickly search how other correlated symbols are doing in regards to your trading symbol.
Say that you have the bullish harmonic pattern in EURUSD in M15 Chart as shown in screenshot. After you have applied some other technical indicators, now you are thinking to buy or not. Then next, you should check how other correlated symbols like GBPUSD, EURCHF, EURJPY, AUDUSD, etc are doing with EURUSD.
If these symbols (i.e. correlated group) are more of bearish, then at least you should not aiming to hold your buy position long. If the correlated symbols of GBPUSD, EURCHF, EURJPY, AUDUSD are strongly bearish, then it is better to skip your buy trade.
Then what is the logic behind this? In the financial market, any news or economic data release affect part of the market instead of just one single symbol. Hence, highly correlated symbols will move in the same direction together when there is influencing news or during any economic data release. In fact, using correlation, we are checking what part of the market was influenced or moved by these financial news or economic data release.
Analogically, this type of analysis can be done manually using some sort of supply and demand relationship by professionals. They will start to collect the highly influential news or economic data release first, and then they will start to analyse how those news or data will affect the supply and demand of the symbol they want to trade.
In our Optimum Chart, you can access to the full version of correlation Ranking Heat Map.
https://algotrading-investment.com/2019/07/23/optimum-chart/
If you are looking for the price pattern analysis instead of intermarket analysis. Then, here is the link to our Excellent Harmonic Pattern Indicators for MetaTrader 4/MetaTrader 5. Harmonic Pattern Indicator is the good turning point predictor for Forex trading.
https://algotrading-investment.com/portfolio-item/harmonic-pattern-scenario-planner/
https://www.mql5.com/en/market/product/6101
https://www.mql5.com/en/market/product/6240
Related Products


