Turning Point and Trend
If you want to become the profitable trader, the first thing you need to understand is turning point and trend in the financial market. If you read many trading articles and books, you will find the diverse opinion over turning point and trend. Many people view turning point and trend as two separate subjects. However, it might be better to understand turning point and trend as two parts inside one body. Let us try to understand the trend. To do so, let us take human as an analogical example. We are born, we grow up, we become mature, and then we die. During this process, we can observe that there are four main stages. These four stages are universal across many creatures and objects observable in the earth.
Birth – Growth – Maturity – Death
Trend also goes through these four stages. Let us take an example in the financial market. For example, if we hear that Apple has some temporary problem in their smartphone supply line, this could stir up the Samsung’s Stock price because the demand for Samsung’s smart phone will be increased. Once this news is spread on the financial market, the upward trend will be born for Samsung’s stock price. At the beginning, this news could be known by few people. Later, more and more people could hear this news. Hence, Samsung’s stock price can build up upward momentum. However, this momentum will not last forever. Once people start to recognize that price rallied too high and some people start taking the profit by selling the stocks, the upward momentum can slow down. Especially, if we hear that Apple recovered the temporary problem in their smartphone supply line, the trend could die completely. As shown in this example, Birth, Growth, Maturity, and Death are the life cycle of trend.
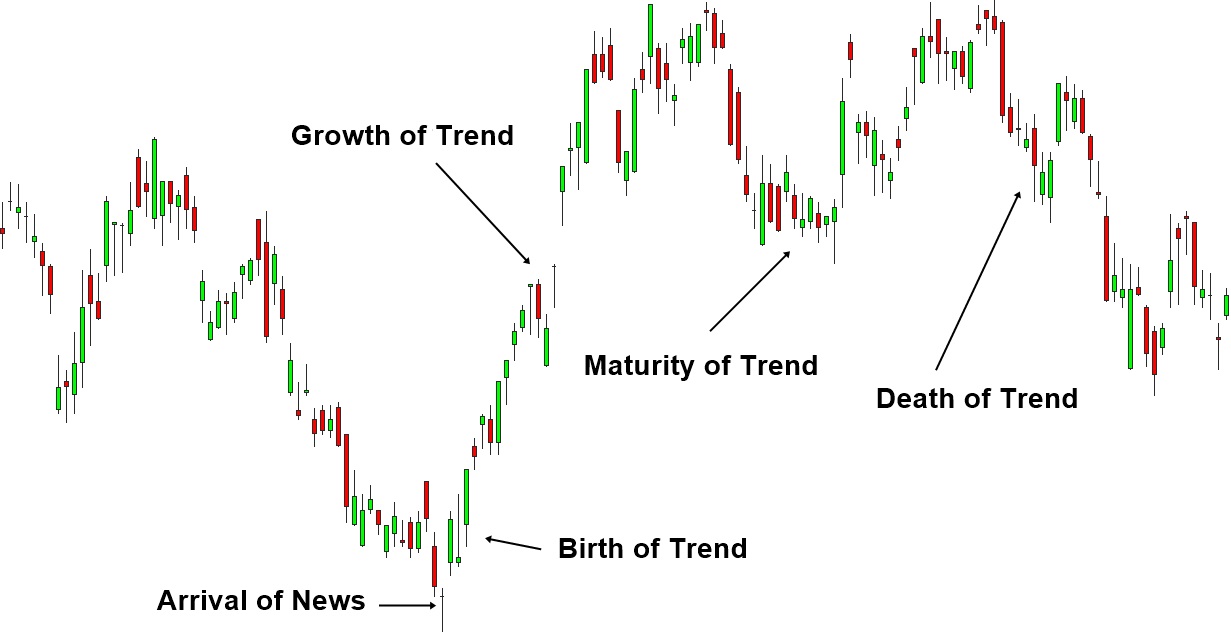
Birth, Growth, Maturity and Death of Trend
Figure 1: Birth, Growth, Maturity and Death of Trend
Now let us revisit the definition of turning point and trend. Turning point is the beginning of new trend after the old trend died off. Hence, turning point strategy refers to the strategy that tries to pick up this new trend as early as possible. This sometimes involves picking up the turning point at the birth stage of the trend. In financial trading, trend strategy typically refers to the strategy that tries to pick up established trend during the growth stage. Most of trend strategy is in fact momentum strategy. When the growth of trend is strong, many technical indicators are designed to react on this strong growth. For example, if you trade on the buy signal when 20 moving average line crosses over the 50 moving average line, you do need strong upwards movement to lift the 20 moving average line over the 50 moving average line.
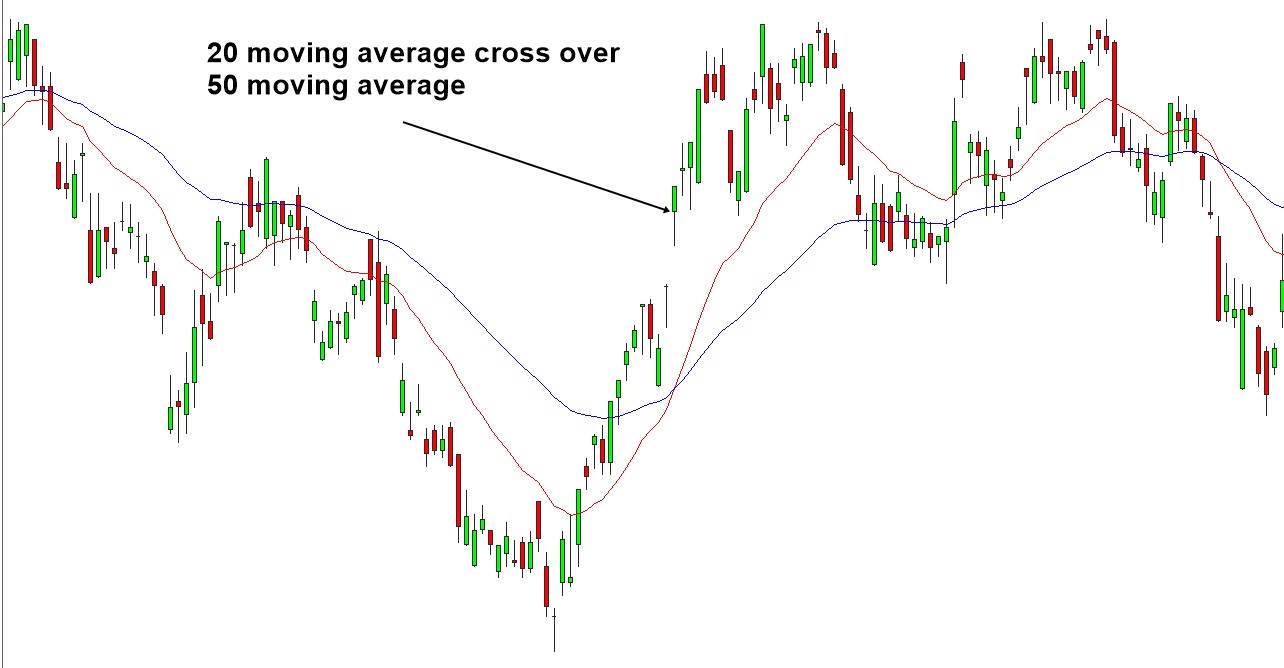
Moving Average Cross Over Trading Signal Example
Figure 2: Moving Average Cross Over Trading Signal Example
In contrast to this, in turning point strategy like Fibonacci price patterns, Harmonic patterns and Elliott wave patterns, we are looking for the newly born trend instead of the trend in growth stage. Hence, the main difference in turning point and trend strategy is when to enter during the life cycle of trend. Typically, we are seeking to enter near the birth of trend in the turning point strategy. In trend strategy, we are seeking to enter at the growth strategy of trend.
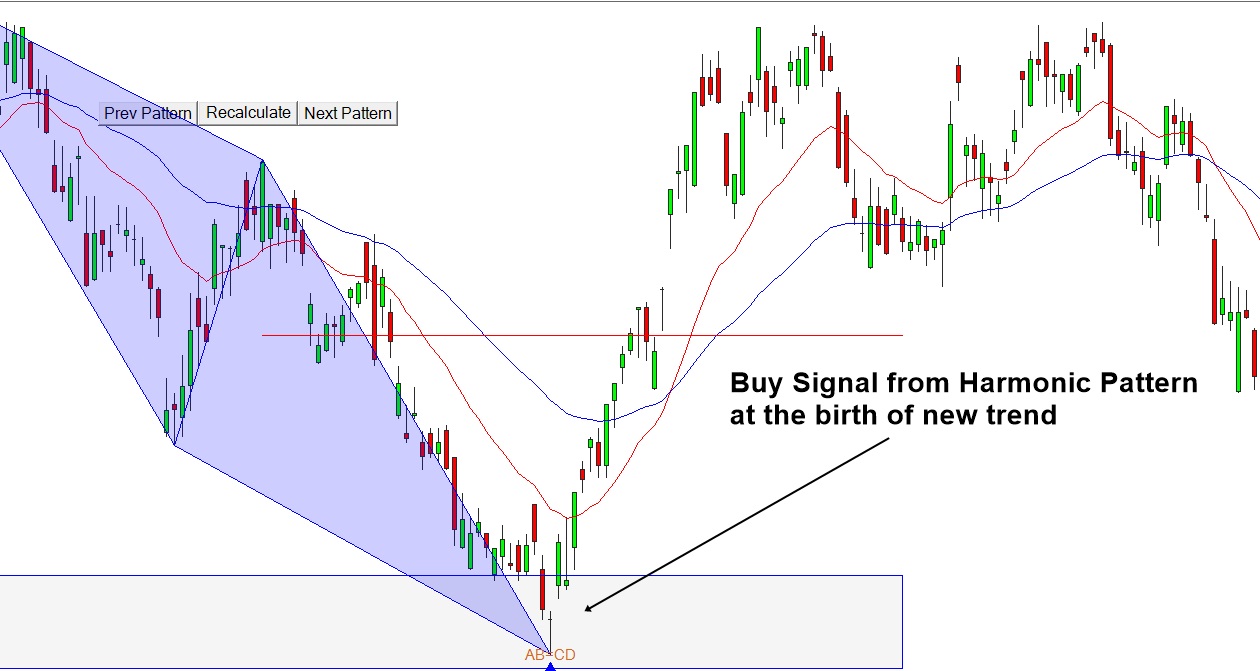
Harmonic Pattern Signal Exmaple
Figure 3: Harmonic Pattern Signal Exmaple
In our example, we considered only one trend. In practice, situation is tougher because we will have many financial, economical and political news released in 24/7 days. Hence, we will deal with the collection of trends instead of one trend. Some trends will be cancelled off each other and some trends will be adding up to form bigger trend. As a result, sometimes, this collective trend can have a clear direction. However, sometimes, we may not see clear direction from this collective trend but just ranging movement. At the same time, we could have many short-lived trends confusing our entries. Therefore, our trading strategy is subjective to probability of success rate regardless of you are using turning point strategy or trend strategy.
In trend strategy, your entry will be at the strong trend movement during the growth phase. This might be good if our entry is not too late. However, if we are late, then we will encounter the loss from early enterers starting to materialize their profits. In turning point strategy, we are trying to pick up the new trend as early as possible in their birth stage. Therefore, it gives you the opportunity to become early enterer. Hence, the profitable range is longer than typical trend strategy.
This longer profitable range means that we need fewer trades to achieve good profits. At the same time, there are some weaknesses of the turning point strategy too. For example, turning point strategy might signal buy or sell entry too early while the ongoing trend was not finished. Since both trend and turning point strategy have their own strength and weakness, it is possible that you can compromise between turning point strategy and trend strategy too. For example, you do not immediately trade at the turning point signal but you can wait until you observe that some price movement is following the new trend direction. Therefore, this becomes semi-turning point strategy. Many of good traders use semi-turning point strategy since they are the hybrid of turning point strategy and trend strategy. The fact is that skills to predict the turning point is necessary for successful trading regardless of you are trading with turning point strategy or semi-turning point strategy. Even though you are trading with trend strategy, it is still advantageous to have good skills of predicting turning point. Hence, the methodology of predicting turning point was sought after by many legendary traders in the financial market nearly 100 years.
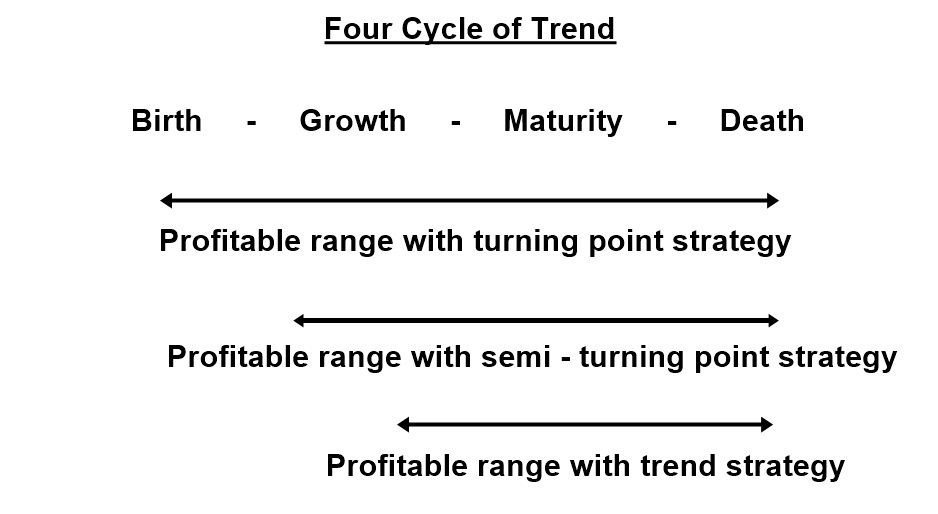
Trend Strategy and Turning Point Stretegy Comparison
Figure 4: Trend Strategy and Turning Point Stretegy Comparison
To give you more insight about turning point and trend in terms of trading strategy, we have summarized the important terms as follows:
- Trends: a trend is a tendency for prices to move in a particular direction over a period. Depending on its period, trends can be short term, med term and long term. Depending on its direction, trends can be categorized into upward trends, downward trends and even sideways.
- Turning Point (General Term): A turning point is a price point from which a minor or major trend reversal happens.
- Turning Point (Scientific Term): A turning point is a price level in which the market can change its direction from bearish to bullish or from bullish to bearish. In fact, the turning point can be considered as the peak and trough in cycle. To visualize it, just consider a simple cycle like a sine curve or cosine curve ranging betweeen 1 and -1 in y axis. Then you can mark the peak at 1 and you can mark the trough at -1 in the curve.
- Stochastic cycle: Turning point becomes a powerful weapon when you understand the market cycle in Forex and Stock market. However the market cycle is not like a simple cycle like a sine curve or cosine curve. Instead, the market cycle is the stochastic cycle. For example, a sine curve is a determininstic cycle, whose cycle period is fixed. In stochastic cycle, the cycle period is not fixed but probablistic meaning that the cycle period can be alternating around the mean or average. The harder part is that, there are multiple of stochastic cycles in the market cycle of Forex and Stock market.
- Fractal Wave: Fractal wave is one tool that can study or predict all the stochastic cycles present in the market in both using statistical and non statistical methods. Fractal wave is simple and effective method proven for many decades along with the evolution of the financial market since Bernoit Mandelbrot dedicated most of his life to the study of fractals, as well as the mathematics of roughness and self-similarity.
- Fractal Wave for Non statistical method: Fibonacci trading, Support and resistance trading, Harmonic Pattern, Elliott Wave pattern and X3 Chart Pattern can be considered as the chart pattern analysis using the Fractal Wave concept.
- Fractal Wave for statistical method: Firstly, Fractal Wave theory can be used to perform the Fractal Decomposition technique to extract each market cycle (=stochastic cycle) in Forex and Stock market. Secondly, once the Fractal Decomposition is done, one can visualize each stochastic cycle using Fractal Cycle Analysis.
- Turning Point Probability: turning point probability is the probability measured in each stochastic cycle extracted and visualized in the Fractal Cycle Analysis to indicate the potential turning point to make a buy or sell decision. Just like other probability, the turning point probability ranges between 0 and 1 or between 0% and 100%.
- Trend Probability: Although there are many ways to calcualte the trend probability, one can simply calculate the trend probabilty in the Stochastic cycle uisng this simple equation: “the trend probability = 1.0 – the turning point probability”.
About this Article
This article is the part taken from the draft version of the Book: Profitable Chart Patterns in Forex and Stock Market: Fibonacci Analysis, Harmonic Pattern, Elliott Wave, and X3 Chart Pattern. Full version of the book can be found from the link below:
To accomplish the technical analysis of turning point and trend, you can use the chart pattern indicator like Fibonacci Analysis, Harmonic pattern and Elliott Wave pattern. You can use three techncial indicators to make buy and sell trading decision based on the turning point and trend.
X3 Chart Pattern Scanner
Below is the link to X3 Chart Pattern Scanner in MetaTrader 4 and MetaTrader 5 platform. X3 Chart Pattern Scanner is non repainting and non lagging Harmonic Pattern Indicator. In addition, each Harmonic Pattern in X3 Chart Pattern Scanner can be customized to improve trading performance. With tons of powerful features toward the day trading, this is the next generation Harmonic Pattern Indicator.
https://www.mql5.com/en/market/product/41993
https://www.mql5.com/en/market/product/41992
https://algotrading-investment.com/portfolio-item/profitable-pattern-scanner/
In addition, we will introduce two Harmonic Pattern Indicator including Harmonic Pattern Plus and Harmonic Pattern Scenario planner. These Harmonic Pattern Indicator is repainting. However, they provide tons of powerful features at affordable price. Hence, if you do not mind the repainting Harmonic Pattern Indicator, then you can use these two tools. In addition, you can use X3 Chart Pattern Scanner together with Harmonic Pattern Plus or Harmonic Pattern Scenario Planner.
Harmonic Pattern Plus (Type 1)
Harmonic pattern plus is extremely good product for the price. With dozens of powerful features including Pattern Completion Interval, Potential Reversal Zone, Potential Continuation Zone, Automatic Stop loss and take profit sizing.
Below are the Links to Harmonic Pattern Plus
https://www.mql5.com/en/market/product/4488
https://www.mql5.com/en/market/product/4475
https://algotrading-investment.com/portfolio-item/harmonic-pattern-plus/
Harmonic Pattern Scenario Planner (Type 1 + Predictive feature)
With additional features of predicting future harmonic patterns, this is very tactical harmonic pattern indicator with advanced simulation capability on top of the powerful features of harmonic pattern plus.
Below are the Links to Harmonic Pattern Scenario Planner
https://www.mql5.com/en/market/product/6101
https://www.mql5.com/en/market/product/6240
https://algotrading-investment.com/portfolio-item/harmonic-pattern-scenario-planner/
Below is the landing page for Optimum Chart (Standalone Charting and Analytical Platform). Optimum Chart provides both X3 Chart Pattern Scanner and the repainting Harmonic Pattern Scanner. It provides one button click trading signal generator across all symbols and all timeframe. This feature makes the Optimum Chart the top pick for the serious Forex Trader.
https://algotrading-investment.com/2019/07/23/optimum-chart/
YouTube Video About Turning Point and Trend
YouTube Link: https://www.youtube.com/watch?v=mtqmOiN13lk
Related Products


