Patterns are the Good Predictor of Turning Point
We will discuss several pattern analysis to predict the turning point in Forex and Stock market, covering the Fibonacci retracement, Harmonic Pattern and Elliott Wave Analysis. To have the good skills in predicting turning point, it is important to understand why turning point occurs in the financial market. Now let us question backwards “Do we have any stock price in smooth growth curve or smooth declining curve?” Smooth curve or straight line is good because it is easy to predict their next movement. Unfortunately, we will never have this sort of easy situation for our trading.
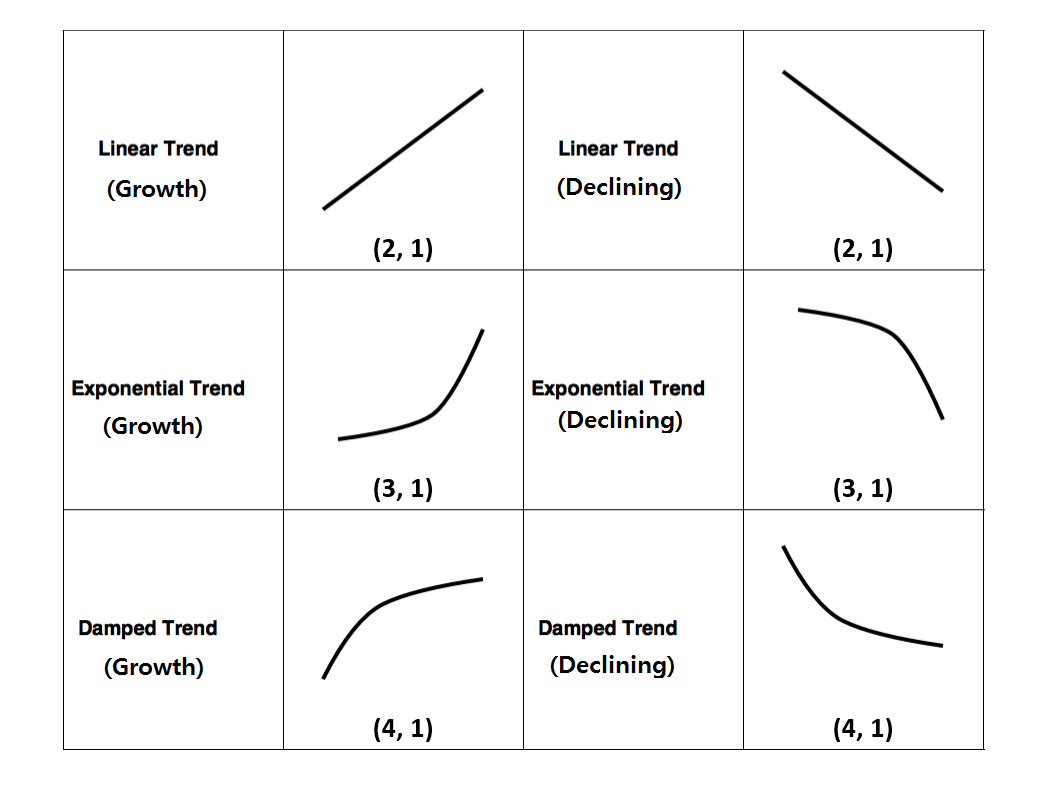
Type of Trend
Even though some company’s stock price grown up for last 10 years like Google (Alphabet Inc.), we will continuously see down price move (i.e. swing low) after up price move (i.e. swing high) and vice versa. To the chartist, this sort of move is defined as price swings or zigzag movement. The zigzag price path is due to both fundamental reason and psychological reason. People do not like if the stock price is over-valued or under-valued under the given fundamental of the stock. For example, if the company has the surprise earnings, then stock price can go up high. However, once people think it went too much, price would start to come down. People do not see attractive price if the stock price is going up too quickly in the short period. In this case, without too much valid reason, stock price can just come down. We are just scared to see anything goes too extreme psychologically. Likewise, if stock price is going down fast due to some bad fundamental news, in theory, we should not buy the stock. In practice there are some people think that stocks are cheap to buy. Hence, price start to make its own correction. Like this, financial market has the endless feedback loop ensuring the price is not moving in one direction. Instead, price will move down after bullish rally and price will move up after bearish rally. This mechanism forms the zigzag price path. Hence, stock and currency price series will continuously show turning point, either high to low or low to high. Financial trader will face much tougher choice between these alternating turning points.
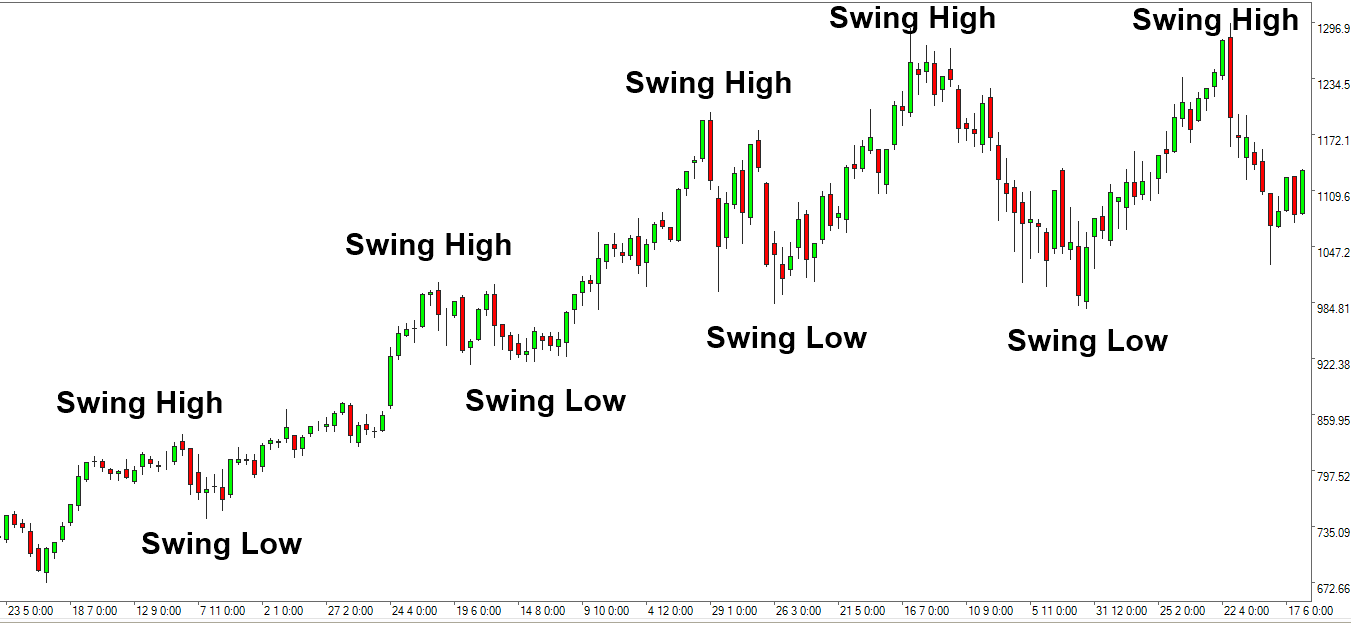
Swing High and Swing Low
So what are the good ways of handling the buy and sell decision in stock and currency market? Fortunately, you are not the only one suffering from this decision problem. Many pioneer traders visited the same question before. In their conclusion, to study this sort of zigzag price path, the best way is to look at the patterns that are made up from zigzag price path. Hence, we will be cutting out some of the patterns from the long price series and then we will exam the cut out patterns with a special microscope designed for this purpose. Many legendary traders opened up ways to study these patterns. Focus in the pattern study is to find repeating patterns that are able to capture the profit in good success rate. Fortunately, we have over 100 years of established methods to deal with this sort of complex price patterns.
Firstly, the simple and easiest method is the Fibonacci price patterns. In Fibonacci price patterns, we cut out the patterns made up from three or four zigzag points to predict the potential turning point, respectively for retracement and for expansion. The peculiar point to the Fibonacci price patterns is that we use Fibonacci ratios derived from Fibonacci sequence numbers. Common Fibonacci ratios used by traders include 0.382, 0.500, 0.618, 0.782, 1.000, 1.272, 1.618, etc.
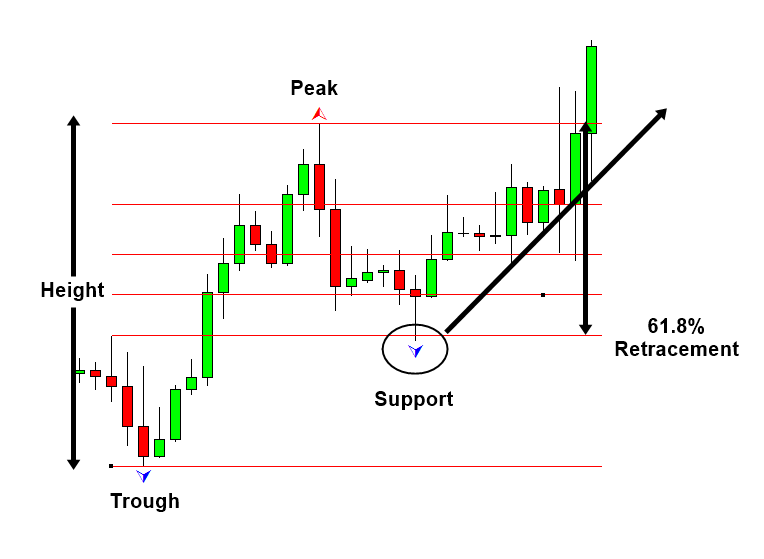
Fibonacci Retracement
The second method to study the patterns that are made up from zigzag price path is Harmonic Pattern. In harmonic pattern, we will cut out the patterns made up from four to five zigzag points to predict market turning point. The history of the harmonic pattern goes back to the Gartley’s book “Profits in the Stock Market” in 1935. At that time, Gartley described the trend reversal pattern, made up from five points, on page 222 of his book. The pattern become popular in 1990s (Pesavento and Shapiro, 1997). Since then, many traders developed the common interest in looking for the similar patterns described by Gartley’s book. Since harmonic pattern uses Fibonacci ratios, you can also consider Harmonic patter as an advanced Fibonacci price patterns loosely speaking.
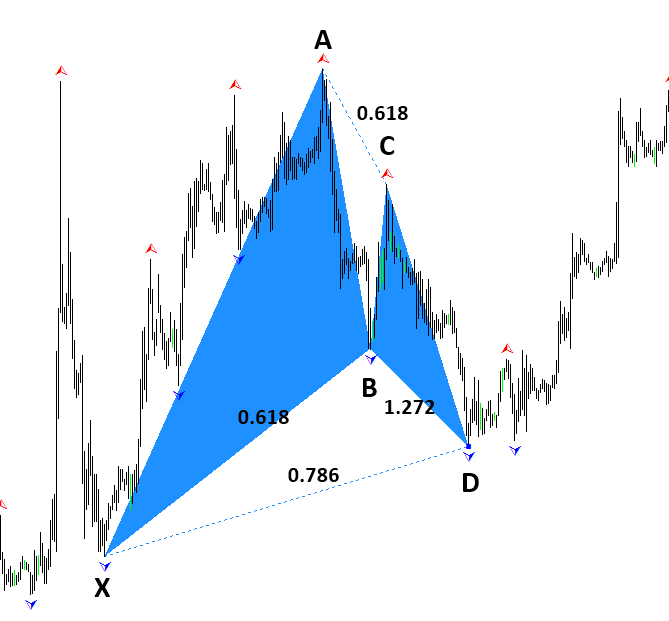
Harmonic Pattern
The third method to study the patterns that are made up from zigzag price path is Elliott Wave theory. Unlike previous two methods exam the cut out patterns from the long price series, Elliott created the more general theory in studying zigzag patterns. This general theory is called Wave principle. The advantage of Elliott Wave theory is that it is comprehensive as the theory provides multiple trading entries on different market conditions. Disadvantage of Elliott Wave theory is that it is more complex comparing to other trading techniques.
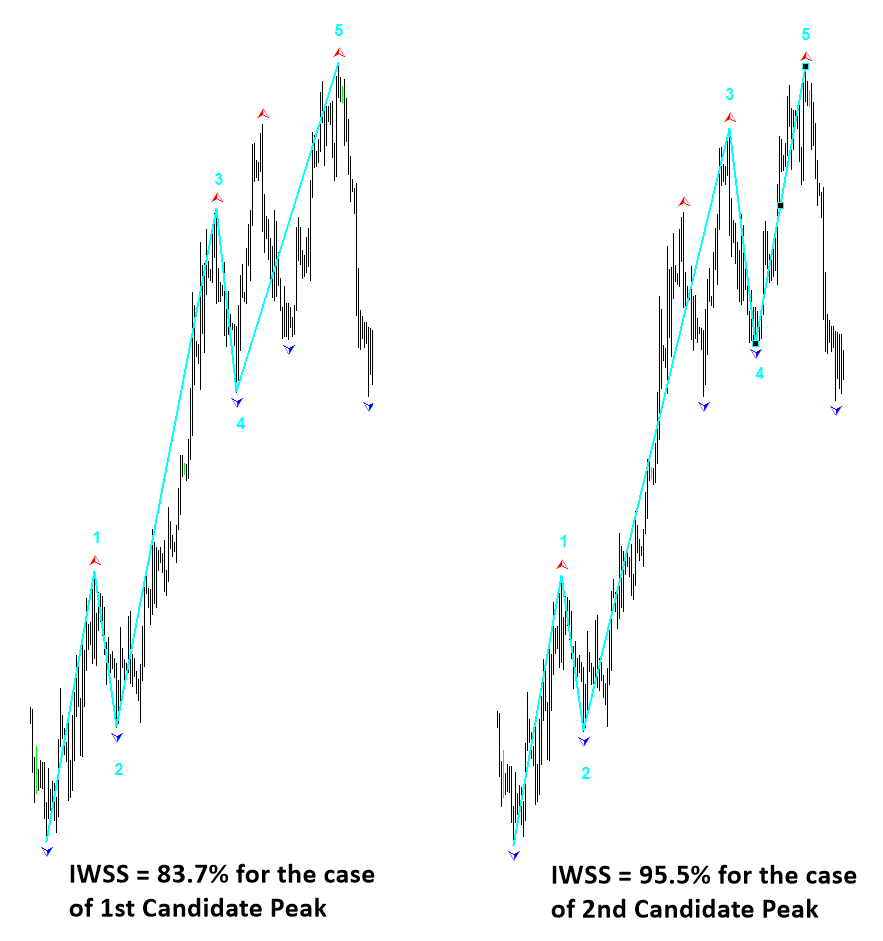
Elliott Wave Analysis
The fourth method to study the patterns that are made up from zigzag price path is X3 Pattern framework. X3 Pattern framework is the latest pattern detection methodology. It lands on “RECF” pattern notation to define various profitable patterns in simple and intuitive manner. X3 Pattern framework allow you to define the patterns that are made up from zigzag price path in one unified pattern framework. In addition, X3 pattern framework allow you to explore the classic patterns and non-classic patterns that are not described in the Fibonacci price patterns, Harmonic patterns and Elliott Wave patterns. Once you have learned the basic logic of defining profitable patterns using X3 Pattern framework, you would be able to customize the existing patterns and to create new patterns to improve their trading performance.
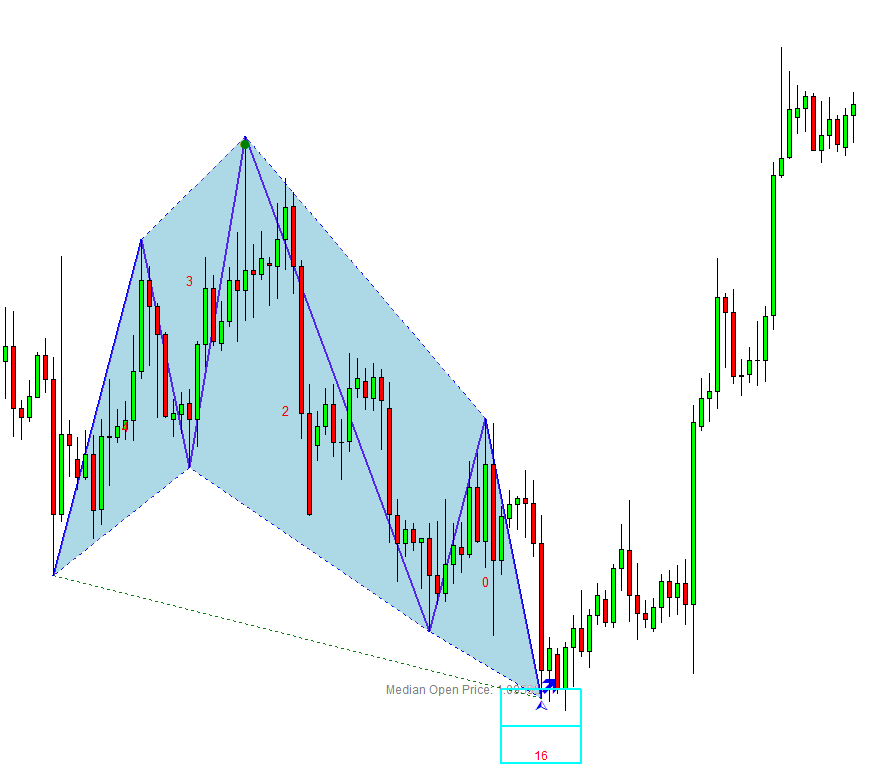
X3 Chart Pattern
About this Article
This article is the part taken from the draft version of the Book: Profitable Chart Patterns in Forex and Stock Market: Fibonacci Analysis, Harmonic Pattern, Elliott Wave, and X3 Chart Pattern. Full version of the book can be found from the link below:
You can also use Harmonic Pattern Scenario Planner in MetaTrader to accomplish your technical analysis. Here is a link to the Harmonic Pattern Scenario Planner.
https://algotrading-investment.com/portfolio-item/harmonic-pattern-scenario-planner/
https://www.mql5.com/en/market/product/6101
https://www.mql5.com/en/market/product/6240
Below is the landing page for Optimum Chart (Standalone Charting and Analytical Platform).
https://algotrading-investment.com/2019/07/23/optimum-chart/
Related Products


