Profitable Patterns in Financial Market
We have dicussed the predictive power of pattern to predict turning point. In this article, we will discuss the profitable patterns in Forex and Stock market. Price is the data recorded by financial exchange. The financial exchange distributes this real time price to trader electronically during market hours. Then trader will make buy or sell decision depending on their perception of the latest price. If they feel the price is low, then they will buy the currency or stock. If they feel price is too high, then they will sell the currency or stock. Once thing we need to know is that diversified reactions exists about good buying and selling price. We can have millions of different opinions about 200 dollar stock price for Facebook today. Some people will think that 200 dollar is good price to buy and some people will think the opposite. Some people might be neutral. Next price of Facebook will be determined by trading volume of buy and sell orders. If buy-trading volume is dominating over the sell-trading volume, then price will go up. If sell-trading volume is dominating over the buy-trading volume, then price will go down. You can think that each price recorded is in fact the record of the crowd reaction.
For our analysis, financial exchange also records the series of price in regular time interval like hourly, daily, or weekly, etc. Sometimes they record tick-by-tick data. They electronically store these historical data and distribute them to traders. Then trader uses these historical data to draw chart for further analysis of the price. In modern electronic trading environment, it is very rare to make buy and sell decision without looking at chart. Price series contain complex information. If we want to find out any useful information from price series, then we need to work backwards from price series into whatever information we need to seek. Extracting useful information from price series typically requires some mathematical tools.
Depending on what is our question, we need to apply different tools to exam price series. For example, if you want to know the common statistics for Facebook stock price, then you can calculate the mean, median, and standard deviation of the price series. If you want to find out good cycles to trade, then you need to apply Fourier transformation or some sort, to extract the cycles of Facebook price series. Likewise, if we want to find out profitable patterns, then we need to apply Peak Trough transformation or some sort to the price series. When we apply Peak Trough Transformation, we turn price series into the infinitely repeating triangles, which are called Fractal wave. Typically, Zig Zag indicator and Renko chart are used to turn price series into fractal wave.
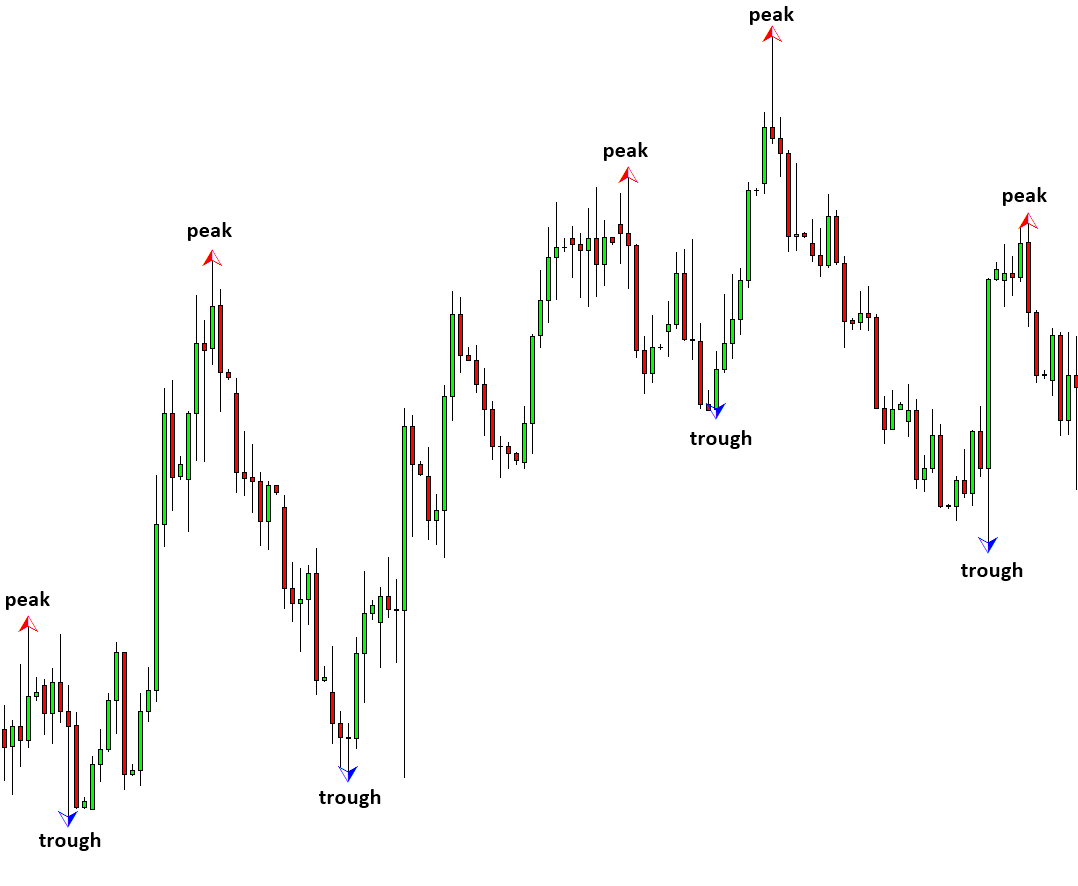
Peak and Trough Analysis
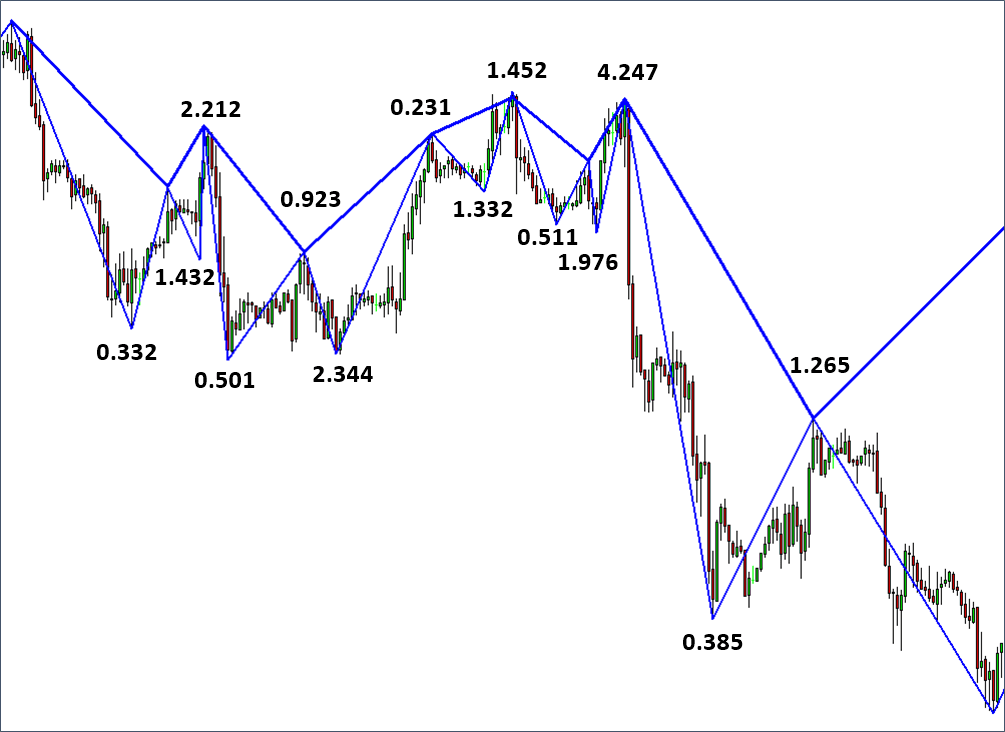
Fractal or Fractal wave is commonly observable in nature like snowflake, in tree leaves, in heartbeat rate, in coastal line. Hence, many traders believe that the identifying profitable patterns in price series are the same as spotting natural order. By definition, Fractal wave is infinitely repeating self-similar patterns in time domain. The main regularity in Fractal wave is the shape of the pattern. Typically, this shape of pattern is referenced for some geometric shapes like triangle, circle, square, etc. In Fractal wave, we can have both strict self-similar and loose self-similar patterns. If the repeating patterns have the same geometric shape and all individual patterns have matching parameters in that shape, we call this as strict self-similarity. If repeating patterns have the same geometric shape but majority of individual patterns have non-matching parameters in that shape, then we call this as loose self-similarity. Fractal wave in Forex and Stock market price series have triangle as the geometric shape. However, individual triangle can be wider, narrower, longer, and shorter than other triangles. Hence, Fractal Wave in Forex and Stock market data possess the loose self–similarity. Loose self-similarity does not mean that all the triangles are non-identical in shape. Even in loose self-similarity, we can have some triangles in identical shape or at least within allowed range in precision.
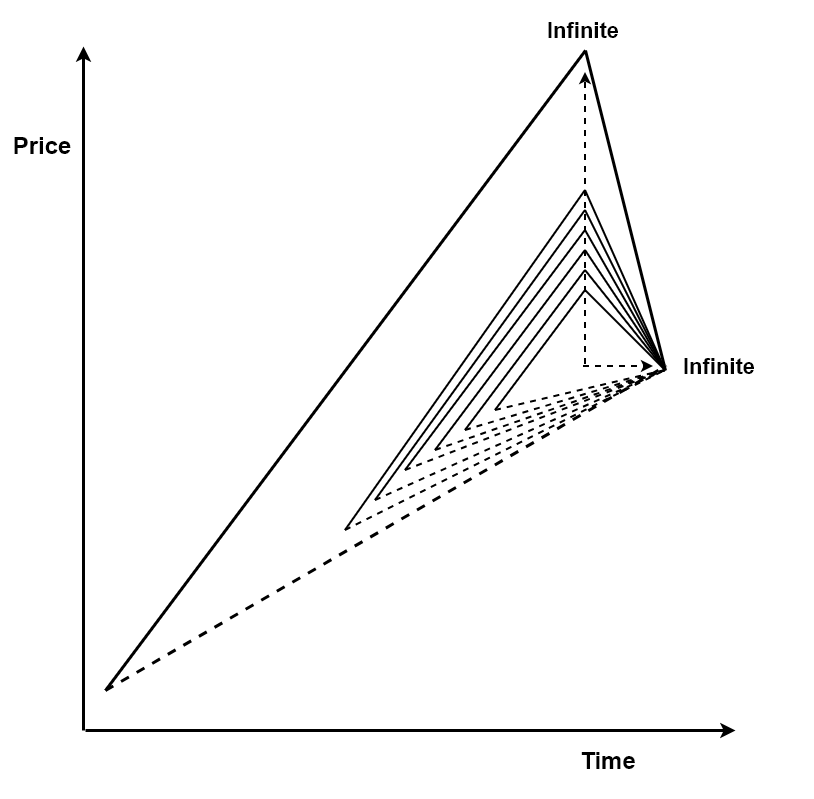
Fractal Wave
First important characteristic of fractal wave is the infinite scales. In theory, repeating triangles in forex and stock market can have infinite variation of scales from very small to extremely large triangles. For example, one day we can observe one triangle formed in thirty seconds but another triangle can be formed in thirty days. In our pattern study, scale is an independent factor from geometric shape. As long as triangles are identical in shape, or within allowed range in precision, triangle formed in thirty seconds is treated as identical to the triangle formed in thirty days, regardless of their size. For some practical example, Fibonacci price pattern with 61.8% retracement formed in twenty-candle bar in hourly timeframe is an identical pattern to the other 61.8% retracement pattern formed in thirty six candle bar in daily timeframe.
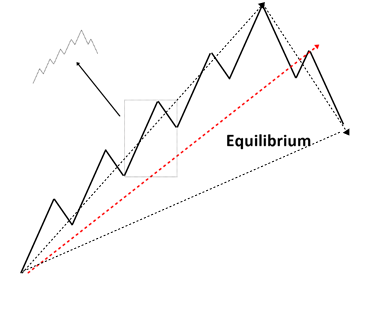
Fractal Geometry
Second important characteristic about Fractal wave pattern is that many small pattern are jagged together to make bigger patterns. For example, in triangular fractal wave as in financial market, bigger triangle will be made from many small triangles. In our pattern study, we often seek this sort of jagged patterns for our trading opportunity. Especially, in Harmonic pattern, Elliott Wave patterns, and X3 patterns, this sort of jagged pattern are commonly utilized to find the profitable patterns with good success rate.
Pattern inside Pattern
About this Article
This article is the part taken from the draft version of the Book: Profitable Chart Patterns in Forex and Stock Market: Fibonacci Analysis, Harmonic Pattern, Elliott Wave, and X3 Chart Pattern. Full version of the book can be found from the link below:
Supply Demand Analysis is based on Fractal geometry of the market. Hence, it makes use of Peak and Trough analysis. You can use Ace Supply Demand Zone Indicator in MetaTrader to accomplish your pattern analysis. Ace Supply Demand Zone indicator is non repainting and non lagging supply demand zone indicator with a lot of powerful features built on.
https://www.mql5.com/en/market/product/40076
https://www.mql5.com/en/market/product/40075
https://algotrading-investment.com/portfolio-item/ace-supply-demand-zone/
Below is the landing page for Optimum Chart (Standalone Charting and Analytical Platform).
https://algotrading-investment.com/2019/07/23/optimum-chart/
Related Products


