Defining Profitable Patterns
Profitable patterns have the pattern structure. In this article, we will look at how to define profitable patterns used in Forex and Stock trading. To study profitable patterns, we start it by cutting out the specific size of patterns from long price series whether we are dealing with Forex or Stock market data. In doing so, we need to have ways of defining the structure of those specimen patterns. We introduce RECF Pattern Notation, as this is simple and intuitive for our trading. We can apply this notation to any patterns including Fibonacci Price patterns, Harmonic Patterns, Elliott Wave Patterns, X3 patterns, or any new patterns.
Once price series is transformed to fractal wave using Peak Trough Transformation. Price series will be transformed into series of small and large triangles. Easiest way to utilize this in your chart is to read the price from trough to peak in alternation or peak to trough in alternation. In defining each triangle, you need to know that one triangle represents two swings (i.e. right and left swings) and three points in price movement. Each triangle consists of one swing high and one swing low.

Price Swing
Each triangle can have two unique quantities to describe themselves. One is retracement ratio and the other one is expansion ratio. Retracement ratio concern only one triangle. The formula to calculate Retracement ratio is as below:
Retracement Ratio = right swing of first triangle (Y0)/ left swing of first triangle (Y1).
Sample Calculation: Let us say that Facebook have right swing (i.e. swing low) of 100 dollar and left swing (i.e. swing high) of 200 dollar. We can calculate the Retracement ratio as below:
R = 100/200 = 0.5

Price Retracement
Expansion ratio is calculated over two successive triangles. The formula to calculate Expansion ratio is as below:
Expansion ratio = right swing of first triangle (Y0)/ left swing of second triangle (Y2)
Sample Calculation: Let us say that Apple stock price has right swing (i.e. swing high) of 50 dollar in first triangle and left swing (i.e. swing high) of 50 dollar in second triangle. We can calculate the Expansion ratio as below:
E = 50/50 = 1.000
During calculation, you might be wondering what the right swing of the second triangle is. In fact, the right swing of the second triangle is identical to the left swing of first triangle. Hence, two neighboring triangles always share middle swing in between them.

Price Expansion
After checking out retracement ratio and expansion ratio, you might be wondering why we use ratios to study patterns instead of some other quantities. Because ratio is scale independent, it is suitable to study fractal wave patterns. For example, in our ratio study, if price goes up 50 dollar and then goes down 25 dollar, then this triangle pattern has the retracement ratio 0.5 (R=0.5). Likewise, if price goes up 100 dollar and then goes down 50 dollar, then this triangle pattern has the retracement ratio 0.5 (R= 0.5). Even though the size of triangle is different, these two are the same pattern with retracement ratio 0.5. We say this as being independent to scale. Many other mathematical tools are not independent to scale. For example, assume that you are trying to study fractal wave patterns with sine and cosine wave. In sine and cosine wave, you have two basic quantities including the fixed time interval and price height.
With these two quantities, the two previous triangles would be defined as different structure because price height is different in the two triangles. In fractal wave, we have to deal with many repeating patterns in different size. For this reason, it is hard or almost impossible to study fractal waves using sine and cosine wave if they are depending on scale.

Ratio Analysis
Profitable patterns can be jagged triangles and Jagged triangles can serve as good entries and exits for our trading. For example, several harmonic patterns with five points are in fact one big jagged triangle made from three small triangles.
If we have one big triangle made up from small three triangles, we can still calculate the retracement ratio for big triangle in the same way as in the individual triangle. However, it is useful to make note that this retracement was made up from three small triangles. Regardless of how many triangles inside big triangle, the formula to calculate retracement ratio is the same as before. You will divide the price height of right swing by the price height of left swing.
Closing Retracement Ratio = Right swing in first three triangles (Y0) / left swing in first three triangles (Y1)
Sample Calculation: Let us say that Facebook have right swing of 26 dollar over three small triangles and left swing of 41.2 dollar over three small triangles.
C = 26/41.2 = 0.631 (from triangle 0 to 2 or T0:3 using short notation)

Harmonic Pattern Structure

Harmonic Pattern Example
In fact, we can have any number of small triangles inside big triangle. Let us say that we have five small triangles inside one big triangle. Then we will calculate the closing retracement ratio as below:
Closing Retracement Ratio = Right swing in first five triangles (Y0) / left swing in first five triangles (Y1)
Sample Calculation: Let us say that Facebook has right swing of 50 dollar over five small triangles and left swing of 42.67 dollar over five small triangles.
C = 50/42.67 = 1.173 (from Triangle 0 to 4 or T0: 5 using short notation)

X3 Chart Pattern Structure

X3 Chart Pattern Example
As in the closing retracement ratio, we might need the expansion ratio for multiple of triangles too instead of two successive triangles. In fact, this sort of relationship is found often in Elliott Wave patterns. I call this quantity as Factored expansion ratio. The way we calculate the factored expansion ratio is identical to the previous expansion ratio formula. However, we need to specify which triangle is in consideration when we calculate this Factored expansion ratio.
For example, let us say that we have eight successive triangles in price series. We want to measure the expansion ratio of first triangle and last triangle.
Factored Expansion ratio = right swing in first triangle / left swing in eighth triangle.
Sample Calculation: Let us say that the right swing of the first triangle is 100 dollar and left swing of the last triangle was 100 dollar, then our Factored expansion ratio can be calculated as below:
F = 100/100 = 1.000 (triangle 0 by triangle 7 or T0: 1 by T7: 1 using short notation)

Elliott Wave Structure
There are cases that are more complex too. For example, we might want to calculate the expansion ratio of first four triangles against last two triangles. Sounds complicated but the way we calculate the expansion ratio is as simple as right swing of first four triangles / left swing of last two triangle.
Sample Calculation: Let us say that the right swing of the first four triangles is 16.18 dollar and left swing of the last triangle was 10 dollar, then our Factored expansion ratio can be calculated as below:
F = 16.18/10 = 1.618 (triangle 0 to 3 by triangle 6 to 7 or T0: 4 by T6: 2 using short notation)

Elliott Wave Example
So far, we have introduced four quantities including retracement ratio, expansion ratio, closing retracement ratio and factored expansion ratio. Sometimes, to describe profitable patterns, we need to have multiple of these quantities in combinations. When you have to use multiple of these quantities, then you can just introduce lag operator. Set the latest quantity to Lag operator 0 and then set Lag1, 2, 3, etc to older quantities. For example, if you have two triangles and you want to describe the retracement ratio of these two successive triangles, then you can calculate retracement ratio as below:
R0 = Y0/Y1
R1 = Y1/Y2

Figure 5-10: Graphical representation of two successive retracement ratio
For example, if you have three triangles and you want to describe the retracement ratio of these three successive triangles, then you can calculate retracement ratio as below:
R0 = Y0/Y1
R1 = Y1/Y2
R2 = Y2/Y3

In summary, we can describe any profitable patterns using Retracement ratio (R), Expansion ratio (E), Closing Retracement ratio (C), and Factored expansion ratio (F). All the four quantities share the same formula:
R, E, C, and F = Price Height of Right Swing / Price Height of Left Swing
To understand these quantities, you do not need to understand a rocket science. As long as you understand that each triangle consists of right and left swing, rest of the calculation will be just followed. You just need to think about which triangle’s left and right swing you need to input for the calculation. Most of time profitable patterns including simple and complex one can be defined in using these four quantities.
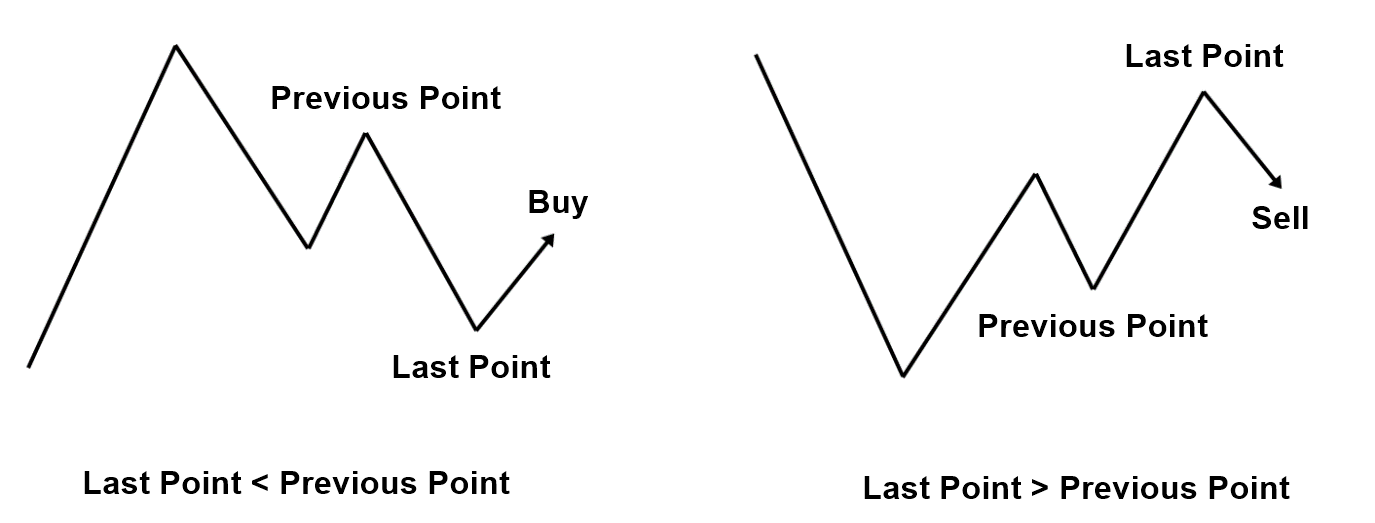
After you have defined your patterns, you need to know which direction you need to trade. Recognizing the trading direction is simple with patterns. If the level of final point is above previous point, then the pattern tells you the bearish turning point that is sell opportunity. If the level of final point is below previous point, then the pattern is the bullish turning point that is buy opportunity. This rule applies to Fibonacci Price Patterns, Harmonic Patterns, Elliott Wave Patterns, and X3 Patterns in common.
About this Article
This article is the part taken from the draft version of the Book: Profitable Chart Patterns in Forex and Stock Market: Fibonacci Analysis, Harmonic Pattern, Elliott Wave, and X3 Chart Pattern. Full version of the book can be found from the link below:
You can also use X3 Chart Pattern Scanner in MetaTrader to accomplish your technical analysis. Here is the product page for the X3 Chart Pattern Scanner. Enjoy the powerful non repainting and non lagging Harmonic Pattern and Elliott Wave Pattern indicator.
https://www.mql5.com/en/market/product/41993
https://www.mql5.com/en/market/product/41992
https://algotrading-investment.com/portfolio-item/profitable-pattern-scanner/
Below is the landing page for Optimum Chart (Standalone Charting and Analytical Platform).
https://algotrading-investment.com/2019/07/23/optimum-chart/
Related Products


