Harmonic Patterns, Elliott Wave Patterns and Chart Patterns
Harmonic Pattern, Elliott Wave and Chart Pattern are the types of technical analysis that can help traders identify and predict price movements in the Forex and Stock market. We will provide a brief overview about each technical Analysis. You need to think about each technical analysis in terms of their similarity and difference. Especially, we added X3 Chart Pattern to help you understand these chart pattern in the collective manner.
- Harmonic Pattern: This is a method of finding geometric patterns in price charts that are based on Fibonacci ratios and numbers. These patterns can indicate potential reversal points or continuation of the current trend. Some examples of harmonic patterns are Gartley, Bat, Crab and Butterfly.
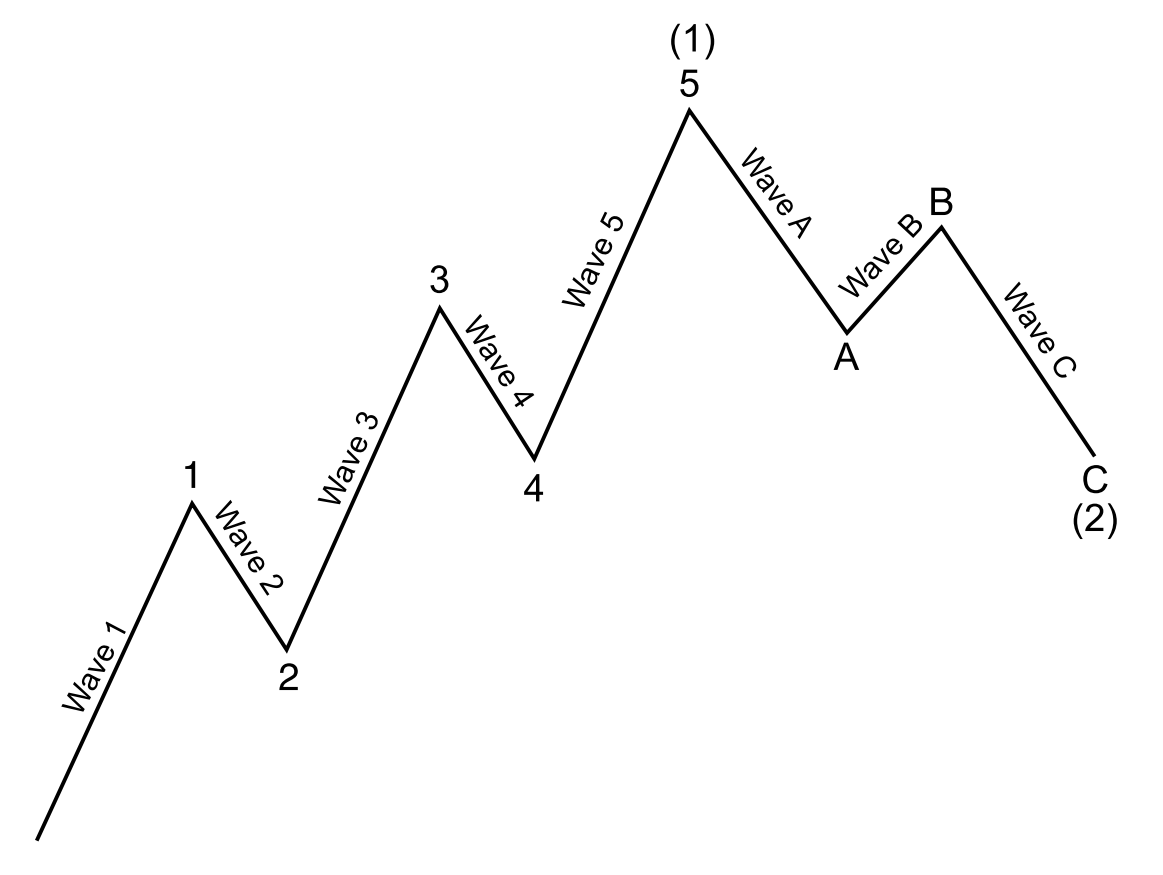
- Elliott Wave: This is a method that suggests that market movements are driven by collective psychology and follow a fractal structure of waves. Each wave consists of smaller sub-waves that have specific characteristics and rules. The main idea is that markets move in five waves in the direction of the main trend and three waves in the opposite direction.
- Chart Pattern: This is a general term for any recognizable shape or formation in the price chart that can provide clues about the future direction of the market. Chart patterns can be classified into two categories: continuation and reversal. Continuation patterns indicate that the current trend is likely to resume after a brief pause, while reversal patterns signal that the trend is about to change. Some examples of chart patterns are triangles, wedges, channels, head and shoulders, and double tops and bottoms.
- X3 Chart Pattern: X3 Chart Pattern indicates any chart patterns who made up from triangles, also known as fractal waves more technically or zigzag pattern informaly. X3 actually means the three points of the triangle. You can call these three points as Zig Zag if you wish. Reflecting this point, in fact, X3 Chart Pattern includes harmonic patterns, elliott wave patterns, and chart patterns. Probably, X3 chart patterns include all of the Harmonic patterns, Elliott Wave patterns and Chart Pattern as typically they consists of fractal wave. So what is difference between X3 Chart Pattern and Chart Pattern ? You can consider X3 Chart Pattern as more technical or scientific notion of Chart Pattern or Price Pattern. Theoretically, they have a different ways of explaining the same chart patterns. For example, X3 Chart Pattern tends to provide more mathematical description for the Harmonic Pattern, Elliott Wave and Chart Pattern. As a trader, to pin point the exact structure of these repeating chart patterns over and over, we need a mathematical description like Fibonacci Ratio, Retracement Ratio, Expansion Ratio, Swing Distance in time, Swing distance in price, etc.
To help you understand these price patterns, we brought up several images. Especially, we will help you to understand all these Harmonic patterns, Elliott Wave patterns and Chart Pattern in the collective manner using the notion of X3 Chart Pattern. So let us dig deeper on the concept of the triangle or fractal wave. Now, the first image below demonstrate the continous form of the Fractal Wave, or triangles that shows the trajectory of the price movement in Forex and Stock market.
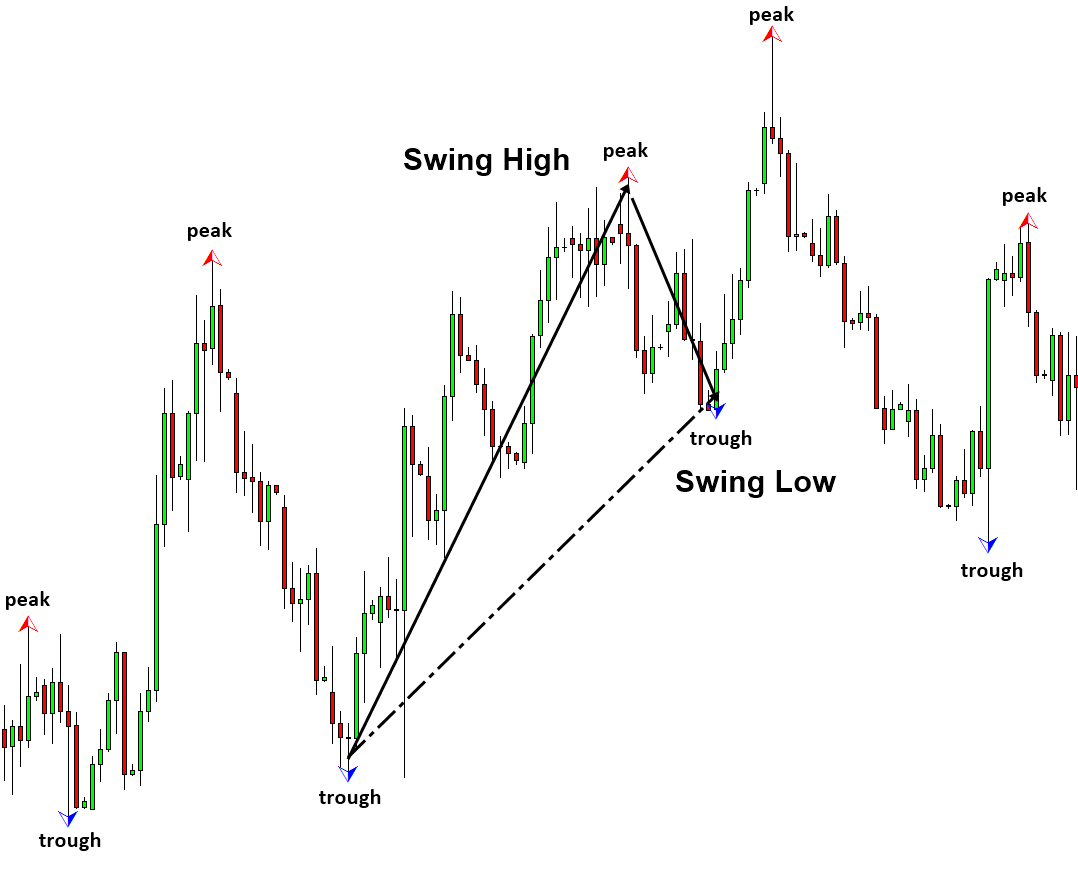
Now second image below shows the anatomy of single triangle or fractal wave. They have a peak trough peak structure or trough peak trough structure. The fractal wave or triangle has swing high and swing low pattern in alternating manner always. This is sometimes called “Zig Zag pattern”.
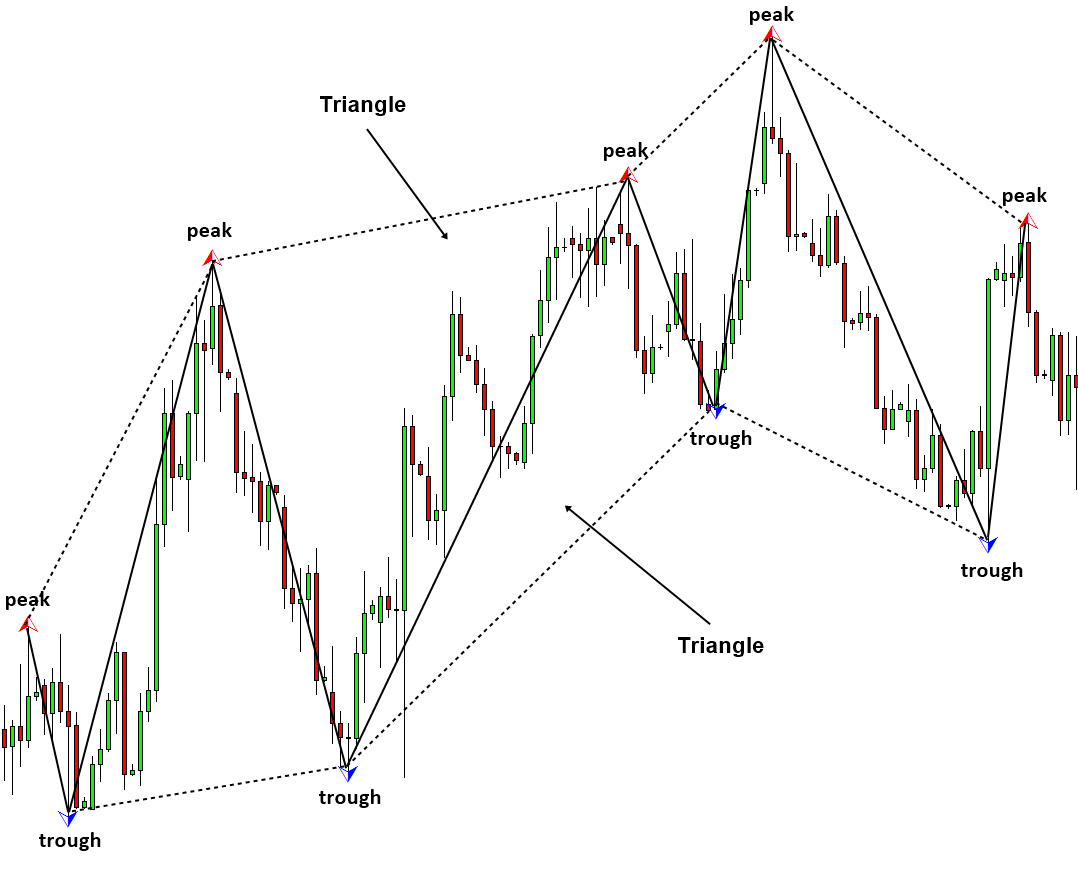
Now thrid image below shows the several combined triangle or fractal waves in the Forex and Stock chart. In fact, these combined triangle or fractal wave are used among the technical analyst to identify the structure of the Harmonic patterns, Elliott Wave patterns and Chart Patterns. They can add ratio using swing high and swing low as in Harmonic Pattern and Elliott Wave patterns. In addition, they can draw envelops around these triangles or fractal wave to identify ascending triangles, descending triangle, falling wedges, rising wedges, channels, head and shoulders, and double tops, double bottoms, and so on. It does not matter what books you are reading on to master these chart patterns. The first step to apply these chart patterns best in Forex and Stock trading is to understand their natural geometry, which is known as Fractal Wave.
Now you can see the point that Profitable Chart patterns including Harmonic patterns, Elliott Wave patterns, X3 Chart Patterns are considered as the advanced trading strategy. Profitable chart pattern uses the natural structure present in the price movement. These chart pattern land you most predictive power when you want to predict next move of the Forex and Stock market.
More and more day trader uses these chart patterns as the tool to find profitable entry and exit. To help you to achieve the financial freedom, we provided the through instruction of using profitable pattern for your trading. All profitable patterns can be expressed in the structure = right swing /left swing in RECF notation. You can check the structure of profitable patterns in this article.
https://algotrading-investment.com/2019/07/09/defining-profitable-patterns/
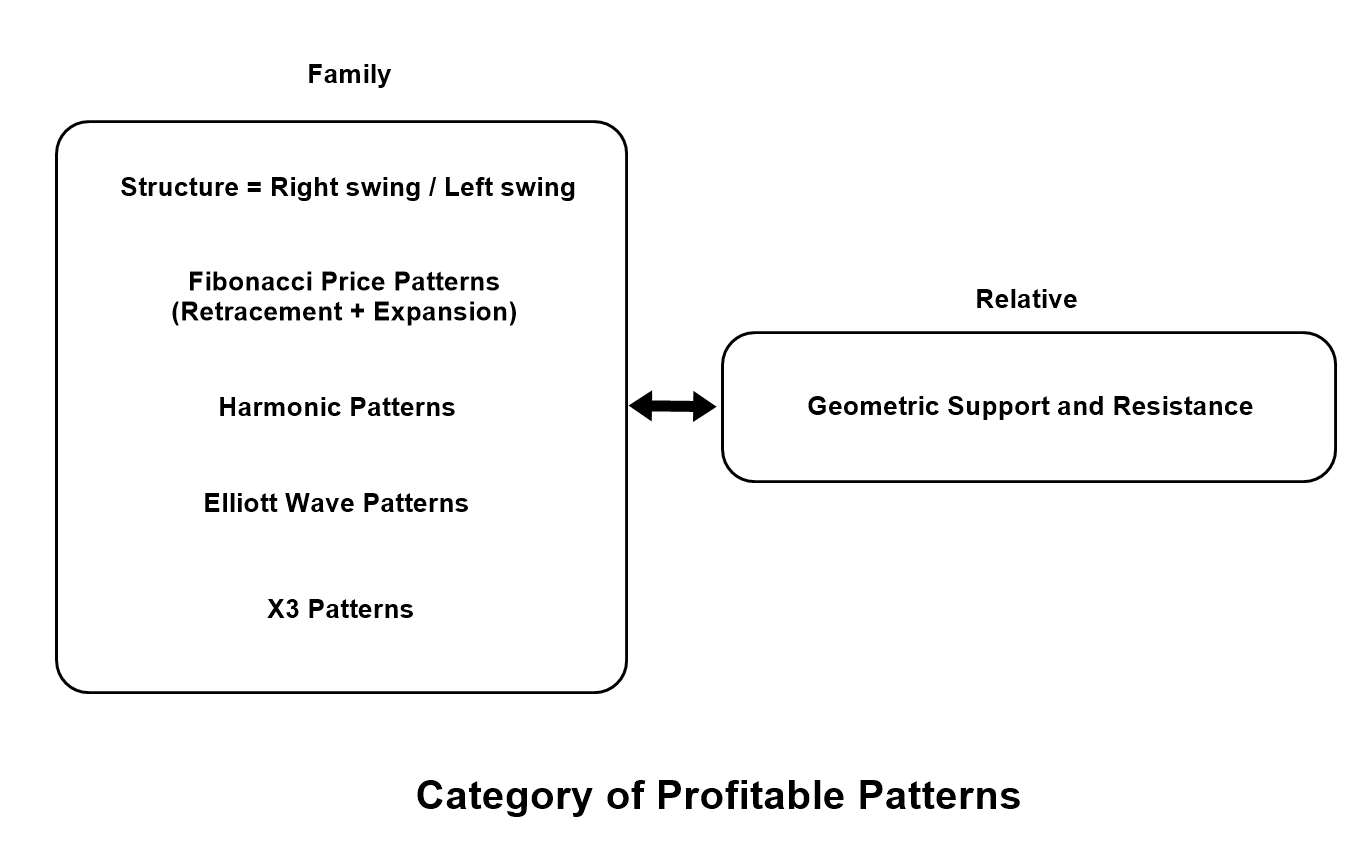
Hence, Fibonacci price patterns (retrenchment and expansion patterns), Harmonic Patterns, Elliott Wave patterns and X3 patterns are family in this respect. As I have wrote in my book, geometric support and resistance is the relative of the family.
Profitable Pattern Pattern Scanner provides a approach to control all these profitable patterns except geometric support and resistance. Easiest way of explaining is that take all these patterns as each portfolio of your trading venture. You do not have to keep all these patterns in your portfolio. As Profitable Pattern scanner provides the way to switch on and off each pattern.
First way to manage your pattern portfolio is that to switch off patterns you do not like and keep the patterns you like only. As non repainting and non lagging indicator, you are able to test each pattern through historical patterns visually in your chart. No need to resource anything else.
Second way to manage your patterns portfolio is that to switch off patterns by their category. For example, if you are familiar and big fan of harmonic patterns, then just switch off Elliott Wave pattern category and X3 pattern category. Keep Harmonic Pattern Category in your pattern portfolio.
Third way to manage your patterns portfolio is that to modify and change patterns according to your preferences. In doing so, you need some knowledge of RECF notation. This is probably the most advanced level of managing your pattern portfolio.
https://algotrading-investment.com/2019/07/09/defining-profitable-patterns/
Also you read the book: Profitable Chart Patterns in Forex and Stock Market for more complete explanation and complete management of your portfolio with profitable patterns.
These are the three options to manage your pattern portfolio. The profitable patterns are better when they are used together with support and resistance. This is another good point you should make a note in your trading.
Harmonic Pattern Category
* AB=CD
* Butterfly Pattern
* Gartley Pattern
* Bat Pattern
* Alternate Bat Pattern
* Shark Pattern
* Crab Pattern
* Deep Crab Pattern
* Cypher Pattern
* 5-0 Pattern
* 3 Drives Pattern
Elliott Wave Pattern Category
* Elliott Wave .1234 Pattern
* Elliott Wave .12345 Pattern
* Elliott Wave .12345AB Pattern
* Elliot Wave .12345ABC Pattern
X3 Pattern Category
* Star River Pattern
* Trident Pattern
* Horse Pattern
* Eagle Pattern
* Phoenix pattern
X3 Chart Pattern Scanner is the most powerful pattern recognition software to detect Harmonic Pattern, Elliott Wave Pattern and X3 Chart Pattern. X3 Chart Pattern Scanner automatically scan all these patterns in one button clicks. No more tedious manual chart pattern detection for you. Here is the link to X3 Chart Pattern Scanner for MetaTrader 4 and MetaTrader 5 platform.
https://www.mql5.com/en/market/product/41992
https://www.mql5.com/en/market/product/41993
https://algotrading-investment.com/portfolio-item/profitable-pattern-scanner/
Related Products


