Momentum Trading and Volume Spread Analysis
In this article, we will discuss how to use momentum trading with volume spread analysis together in the context of Forex and Stock Trading. Especially, we will take this from the angle of the excessive momentum, which is very important concept to predict the future movement of the Forex and Stock Market. Excessive momentum could possibly point out some anomaly movement or anomaly momentum in the financial market. Excessive momentum can provide you good entry for your trading. During Excessive momentum, this balance is broken. It means that the continuation force was greater than reversal force since the trends was driving further beyond the defined range. Now probably you are starting to make some sense about excessive momentum. That is good. Your intuition will start to tell you that this excessive momentum is significant joint in the price movement where forces are conflicting.
Two potential scenarios can cause the occurrences of Excessive momentum. Firstly, the excessive momentum could be caused by some irrational price reaction like the late comers buying stocks after the stock have gone up too much. Secondly, the excessive momentum could be caused by strong belief of the crowd that the price will continue to go in the same direction. Whichever scenario is driving the excessive momentum, it is where we can observe the crowd psychology clearly. Hence, excessive momentum provides the great market timing before things are exploded. Whichever direction price would explode, you can get the first ticket to the ride the profit.
To make your understanding little bit easier with excessive momentum, I will explain trading concept in terms of volume spread analysis.

Figure 1: Excessive momentum with highest price move above ZigZag peak.

Figure 2: Excessive momentum with lowest price move below ZigZag trough.
To explain the associated trading strategy with Excessive momentum, it is best to point out the four-market phase concept by Richard D. Wickoff (1873-1934). His framework is widely known as the Volume Spread Analysis. His four-market phase description is the most interesting subject among many traders. It is one of the most intuitive explanation behind the market dynamics.
The four-market phase includes accumulation, mark up, distribution and mark down (Figure 4). Four-market phase is the systematic view of market cycle. Volume spread analysis further extends accumulation and distribution areas into sub phase A, B, C, D and E (Figure 6 and Figure 7). These sub phase zone looks like some sort of sideways market. To be honest, I do not use the sub phase A, B, C, D and E for my trading because identifying these phase can be subjective and it is difficult to achieve them in systematic manner. Our focus here is more on accumulation and distribution area, the pattern made up from supply and demand fluctuations.
I believe that accumulation and distribution area can serve as useful entries in our trading operation. One thing trader should know is that Wyckoff Price Cycle is schematic and conceptual. In real world, we can not expect accumulation and distribution to arrive in turn always. Be more realistic. Figure 4 is only schematic diagram. In real world, any stock price can go up, rest and can go up again for fundamental reason. Likewise, stock price can go down, rest and can go down further. We can not expect that accumulation will always arrive after distribution. In fact, we can have as many accumulations as possible after accumulation. We can also have as many distributions as possible after distribution. I have drawn more realistic view of accumulation and distribution to prevent newbie’s getting wrong picture on the market behaviour around accumulation and distribution area (Figure 5). The difference is in your trading direction. When we have accumulation area after accumulation area, we will have continuous buy trend. When we have distribution area after distribution area, then we will have continuous sell trend. When we have accumulation and distribution area in turn, then we will have reversal opportunity. We will trade at turning point.
Simply speaking, sideways market zone in Figure 6 and Figure 7 can always serve as the springboard for the previous trend as well as for the reversal point. In addition, we could assume that accumulation area is where demand is exceeding the supply. Hence, price will go up after accumulation area. The distribution area is where supply is excessing the demand. Hence, price will go down after the distribution area. It is undeniable that these accumulation and distribution areas are important because this is where we get strong fresh momentum to start new trend or reversal. Placing your entry around these areas will increase your odd to win in the financial market. When these areas are identified correctly, market is much more profitable for your trading.

Figure 3: Four market phase concept in Volume Spread Analysis (source from StockCharts.com).

Figure 4: Realistic View of Four market phase concept in Volume Spread Analysis.
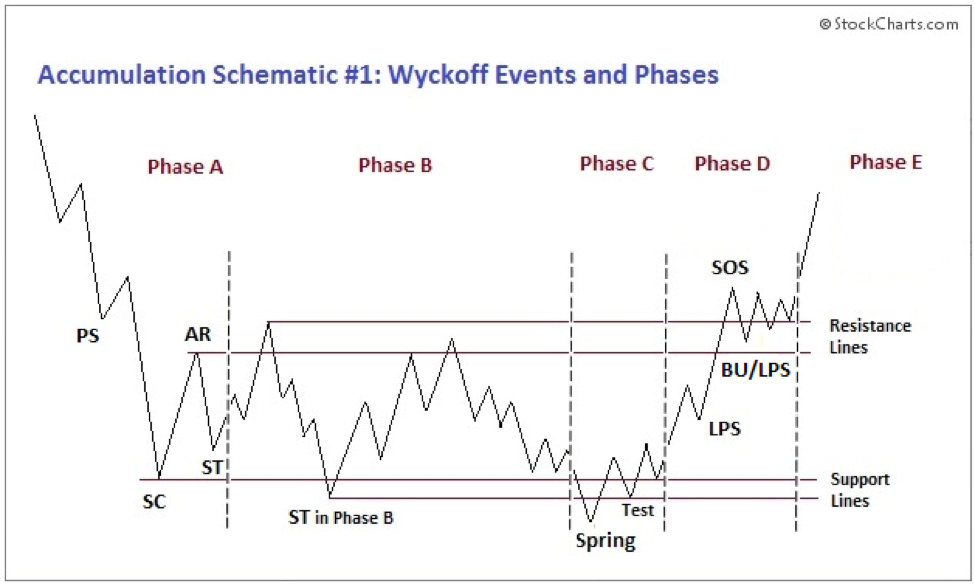
Figure 5: Sub phase A, B, C, D and E for Accumulation Area (source from StockCharts.com).

Figure 6: Sub phase A, B, C, D and E for Distribution Area (source from StockCharts.com).
Now if you are convinced how important these zones are, let us get back to the Excessive momentum. Excessive momentum can serve you as the systematic tool to detect these accumulation and distribution areas. Individual excessive momentum can be considered as an accumulation or distribution zone described in the four-phase market. You can consider the C point of Excessive momentum as either selling climax or buying climax. The difference is that some zone will provide you the reversal trading opportunity. Some other zone will provide you the continuation trading opportunity.
For example, in Figure 8, we can observe that excessive momentum detects the accumulation and distribution in turn. In this case, excessive momentum zone will provide you the reversal trading opportunity. You will trade against previous trend. Besides that, in Figure 9 and Figure 10, we can see continuation zone examples. In both case, excessive momentum detects the starting point of the fresh momentum of previous trend. In this case, our trading direction is the same as previous trend. Good news is that detection of excessive momentum is systematic using the trend filtered ZigZag indicator. Hence, detecting Wyckoff phase is no longer subjective but it is fully automatic now. Another added bonus is that excessive momentum produces two reliable breakout levels for your trading (Figure 10). The breakout levels are the point C and point D of excessive momentum zone. Beside your knowledge of accumulation and distribution area, these two breakout levels will provide you more solid evidence towards your trading direction. You can use these breakout levels for high probability trading setup.
Here is the summary for your potential volume spread trading setup with Excessive momentum zone. At the simplest trading setup, you can just use the two price levels at point C and point D in your breakout trading. This is easy and simple for any trader. However, this is rather short-sighted approach. Real benefit comes when you are able to identify accumulation and distribution area accurately with excessive momentum zone. With this long-sighted approach, you would try to make a big picture if the zone is continuous or reversal. With this knowledge, you can increase your odd win.
In conclusion, volume spread analysis setup with excessive momentum zone is not a rocket science although detection of excessive momentum requires the sophisticated algorithm. Your trading will start by identifying excessive momentum zone in the first place. Trading execution is a lot like the breakout trading throughout the zone at first. When you spot the direction of accumulation and distribution area correctly, you would be able to move your stop as the price move according to your prediction. Since it will detects these important zones automatically. Your trading will be much easier but more accurate.

Figure 7: Accumulation and distribution area detected for Reversal opportunity by Excessive momentum indicator.

Figure 8: Distribution zone for continuation detected by Excessive momentum indicator.

Figure 9: Distribution zone for continuation detected by Excessive momentum indicator.

Figure 10: Two referencing price levels for breakout.
You can also watch the Video titled as Excessive Momentum Indicator to accomplish your understanding with this powerful Momentum Indicator. Here is the link to the video on YouTube.
https://www.youtube.com/watch?v=oztARcXsAVA
Below is link to the landing page of the Excessive Momentum Indicator available in MetaTrader 4 and MetaTrader 5:
https://algotrading-investment.com/portfolio-item/excessive-momentum-indicator/
Related Products


