Pattern Scanner List for MetaTrader 4
In this article, we list the Pattern Scanners for MetaTrader as well as covering some basics of Price Pattern in Forex and Stock Trading. Pattern detection is an important task for your winning trading. Pattern detection is one way to solve the puzzle of market geometry, which is often not solvable with technical indicators mainly operating with smoothing algorithm like the Moving Average indicator or other simple oscillator. How about automatic pattern detection for your trading ? Before going into the automated solution, let us cover some basics of Price Pattern in Forex and Stock market trading.
Learning the geometric shape of the price patterns might be not sufficient to apply them well in the financial market. If we understand why the price patterns exist in the financial market, we can use them more accurately. Hence, it is important to understand the underlying science behind the price patterns. In doing so, we need to understand the trend and cycle. Then we need to see the connection of fractal wave with trend and cycle. Finally, when we recognize the fractal wave as the superior analytical method to the existing methods, we will understand why price patterns were used in the financial market over 100 years. With understanding of the turning point in connection with economics, this can advance your knowledge and practice for your day trading and investing.
As long as the price continuously rises and falls, we can utilize the fractal wave in our price analysis. After extensive price rise, the price must fall to realize the overvaluation of the price. Likewise, after extensive price fall, the price must rise to realize the undervaluation of the price. This price mechanism builds the complex zigzag path of the price movement in the financial market. Most of price data in the Forex and Stock market tend to follow this. Therefore, price pattern analysis are often heavily used to predict the price movement. Prior to apply these price patterns in the scientific way, the peak trough transformation is required. Peak trough transformation is the mathematical techniques to identify the peak and trough in turn to visualize the fractal wave in the price series. Some mathematical and technical analysis can be used as the peak trough transformation. This was explained in detail in the book: Scientific Guide to Price Action and Pattern Trading (Young Ho Seo, 2017). For example, the ZigZag indicator and the Renko chart is the popular peak trough transforming tools used by the trading community. In addition, Benoit Mandelbrot used the mathematical interpolation to explain the fractal wave in the price series. Since the mathematical interpolation is not popular among the trading community, we will focus on the ZigZag indicator and the Renko chart.
The ZigZag indicator and the Renko chart can be used to “peak trough transform” the price series. However, there are some important difference. For example, in the Renko chart, time is compressed as price gets transformed. The degree of time compression depends on the brick height chosen in the chart. This is not the case for the ZigZag indicator. In the ZigZag indicator, the price is only transformed while there is no change in time. Therefore, some traders prefer to use the ZigZag indicator while some others prefer to use the Renko chart. In this book, we recommend using the ZigZag indicator as we have seen that both price and time play an important role in the market prediction. Hence, we will stick with the ZigZag indicator. You will also find using the ZigZag indicator is straightforward and easy. For further understanding on the peak trough transformation, we can compare the Fourier transform and the Peak Trough transform in analogy. Fourier transform is heavily used in the cycle analysis. It extracts the cyclic features like wavelength and amplitude from price series. The techniques are useful for the data type in the second, third and fourth column in the price pattern table. On the other hands, the peak trough transform is heavily used in the geometric pattern analysis. This technique is useful for the data type in the fifth column in the price pattern table. You can tell both Fourier transform and Peak Trough transform as the sort of exploratory analysis performed before the main analysis. When we apply the peak trough transformation to the price series, we will be ready to perform the fractal wave analysis in our chart. The fractal wave analysis for our trading include the following methods.
- Horizontal support and resistance
- Diagonal support and resistance (i.e. trend lines)
- Triangle pattern
- Rising wedge and falling wedge patterns
- Supply demand zone analysis
- Fibonacci analysis
- Harmonic Pattern
- Elliott Wave Theory
- Gann’s methods
- Point and Figure Chart
- X3 Chart Pattern
We provide the list of various pattern scanner for your MetaTrader 4 platform.
1. Harmonic Pattern Plus for MetaTrader 4
Harmonic Pattern Plus is the harmonic pattern scanner. It can detect 11 most popular harmonic patterns with well-defined trading entries and stops. Pattern Completion Interval, Potential Reversal Zone and Potential Continuation Zone are supported. In addition, other dozens of powerful features are added like Japanese candlestick detection, etc.
https://www.mql5.com/en/market/product/4488
https://algotrading-investment.com/portfolio-item/harmonic-pattern-plus/
2. X3 Chart Pattern Scanner for MetaTrader 4
X3 Chart Pattern Scanner is non repainting and non lagging pattern scanner for Harmonic Pattern, Elliott Wave pattern and X3 patterns. As a bonus, this tool can detect around 52 bearish and bullish Japanese candlestick patterns + advanced Channel features. This is the most advanced Harmonic and Elliott wave scanner in the market. You must try.
https://www.mql5.com/en/market/product/41992
https://algotrading-investment.com/portfolio-item/profitable-pattern-scanner/
3. Advanced Price Pattern Scanner
Advanced Price Pattern Scanner is the automatic price pattern scanner. It is designed to scan the Triangle, Falling Wedge, Rising Wedge, Double Top, Double Bottom, Head and Shoulder, Reverse of Head and Shoulder, Cup and Handle or Cup with Handle, Reverse of Cup and Handle or Cup with Handle. What is even better? This is non-repainting and non-lagging indicator. Here is link for more information
https://www.mql5.com/en/market/product/24679
https://algotrading-investment.com/portfolio-item/advanced-price-pattern-scanner/
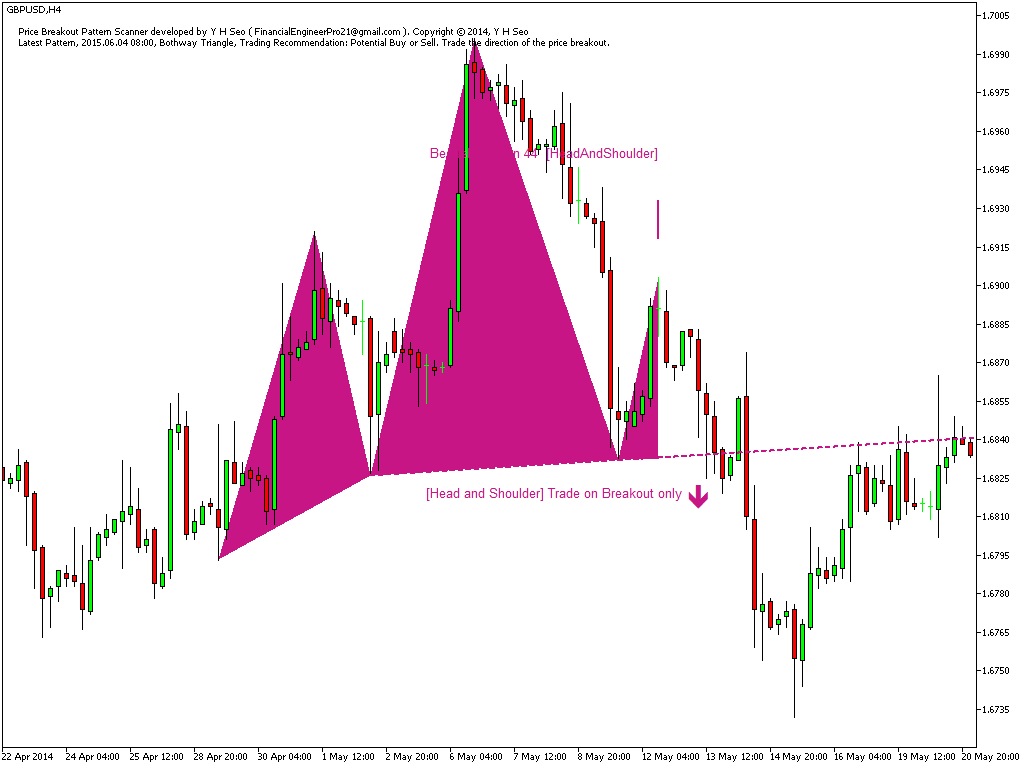
4. Price Breakout Pattern Scanner
Price Breakout Pattern Scanner is the automatic pattern scanner designed to detect the Triangle, Falling Wedge, Rising Wedge, Double Top, Double Bottom, Head and Shoulder, Reverse of Head and Shoulder. Although this scanner is repainting, this scanner comes with powerful built in features like Japanese candlestick pattern detection + Smart Renko features. With all these features together, this pattern scanner forms the powerful trading system for Forex market.
https://www.mql5.com/en/market/product/4859
https://algotrading-investment.com/portfolio-item/price-breakout-pattern-scanner/
5. Fractal Pattern Scanner
Fractal Pattern Scanner is our next generation price breakout pattern scanner. Unlike previous two price breakout pattern scanner detect price patterns like triangle and wedge patterns, Fractal Pattern Scanner detect the price breakout pattern using Statistical method with Elliott Wave like concept (i.e. Mother Wave and Child Wave). Hence, there is a huge difference in the detection of breakout patterns in Fractal Pattern Scanner from rest. However, Fractal Pattern Scanner is the powerful breakout pattern scanner as it provides the reversal (i.e. turning point) trading opportunity as well as breakout trading signals. Fractal Pattern Scanner also support Multiple timeframe pattern scanning with fully automated breakout signal generations.
https://www.mql5.com/en/market/product/49170
https://algotrading-investment.com/portfolio-item/fractal-pattern-scanner/
Related Products


