Trading Price Patterns
Trading price patterns in forex involves identifying repetitive formations or structures on price charts that indicate potential future price movements. These price patterns are formed by the collective actions of market participants, reflecting their sentiments and expectations about the future direction of the currency pair.
Here are some commonly traded price patterns in Forex and Stock Market:
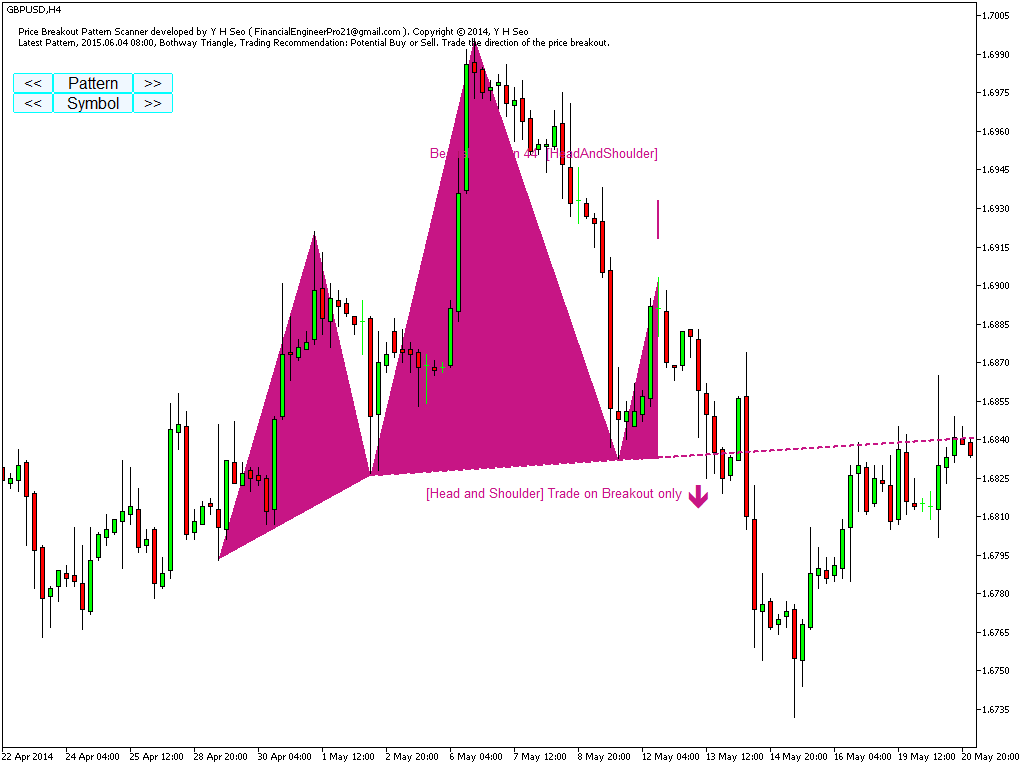
- Head and Shoulders: This pattern consists of three peaks – a higher peak (head) between two lower peaks (shoulders). It indicates a potential reversal from an uptrend to a downtrend, or vice versa.
- Double Top and Double Bottom: These patterns occur when the price forms two peaks or troughs at approximately the same level. A double top suggests a reversal from an uptrend to a downtrend, while a double bottom suggests a reversal from a downtrend to an uptrend.
- Triangles: Triangles are continuation patterns that indicate a period of consolidation before the price resumes its previous trend. There are three main types of triangles: ascending triangles, descending triangles, and symmetrical triangles.
- Flags and Pennants: Flags and pennants are short-term continuation patterns that form after a strong price movement. Flags are rectangular-shaped, while pennants are small symmetrical triangles. Both patterns indicate a brief pause in the trend before the price continues in the same direction.
- Wedges: Wedges are similar to triangles but with converging trendlines that move in the same direction. Rising wedges occur in uptrends and usually lead to a reversal, while falling wedges occur in downtrends and often result in a bullish reversal.
- Cup and Handle: This pattern resembles a tea cup with a handle. It is a bullish continuation pattern that forms after a prolonged uptrend, indicating a brief consolidation before the price continues higher.
- Engulfing Patterns: Engulfing patterns occur when a candlestick completely engulfs the previous candlestick, indicating a reversal of the prevailing trend.
When trading price patterns in forex, traders typically look for confirmation signals such as volume patterns, momentum indicators, or additional chart patterns. It’s important to combine price patterns with other technical analysis tools and risk management strategies to improve the probability of successful trades. Additionally, traders should always consider the broader market context and fundamental factors that may influence currency prices.
Trading price patterns in Forex and Stock market require some skills to read the patterns in the trading chart. Before using price patterns, we need to understand what exactly the price patterns are. We can start from the price itself and then we can extend the price into various price patterns we use for the day trading. As long as the price continuously rises and falls, we can utilize the fractal wave in our price analysis. After extensive price rise, the price must fall to realize the overvaluation of the price. Likewise, after extensive price fall, the price must rise to realize the undervaluation of the price. This price mechanism builds the complex zigzag path of the price movement in the financial market. Most of price data in the Forex and Stock market tend to follow this. Therefore, price pattern analysis are often heavily used to predict the price movement. Prior to apply these price patterns in the scientific way, the peak trough transformation is required. Peak trough transformation is the mathematical techniques to identify the peak and trough in turn to visualize the fractal wave in the price series. Some mathematical and technical analysis can be used as the peak trough transformation. This was explained in detail in the book: Scientific Guide to Price Action and Pattern Trading (Young Ho Seo, 2017). For example, the ZigZag indicator and the Renko chart is the popular peak trough transforming tools used by the trading community. In addition, Benoit Mandelbrot used the mathematical interpolation to explain the fractal wave in the price series. Since the mathematical interpolation is not popular among the trading community, we will focus on the ZigZag indicator and the Renko chart.
The ZigZag indicator and the Renko chart can be used to “peak trough transform” the price series. However, there are some important difference. For example, in the Renko chart, time is compressed as price gets transformed. The degree of time compression depends on the brick height chosen in the chart. This is not the case for the ZigZag indicator. In the ZigZag indicator, the price is only transformed while there is no change in time. Therefore, some traders prefer to use the ZigZag indicator while some others prefer to use the Renko chart. In this book, we recommend using the ZigZag indicator as we have seen that both price and time play an important role in the market prediction. Hence, we will stick with the ZigZag indicator. You will also find using the ZigZag indicator is straightforward and easy. For further understanding on the peak trough transformation, we can compare the Fourier transform and the Peak Trough transform in analogy. Fourier transform is heavily used in the cycle analysis. It extracts the cyclic features like wavelength and amplitude from price series. The techniques are useful for the data type in the second, third and fourth column in the price pattern table. On the other hands, the peak trough transform is heavily used in the geometric pattern analysis. This technique is useful for the data type in the fifth column in the price pattern table. You can tell both Fourier transform and Peak Trough transform as the sort of exploratory analysis performed before the main analysis. When we apply the peak trough transformation to the price series, we will be ready to perform the fractal wave analysis in our chart. The fractal wave analysis for our trading include the following methods.
- Horizontal support and resistance
- Diagonal support and resistance (i.e. trend lines)
- Triangle pattern
- Rising wedge and falling wedge patterns
- Supply demand zone analysis
- Fibonacci analysis
- Harmonic Pattern
- Elliott Wave Theory
- Gann’s methods
- Point and Figure Chart
- X3 Chart Pattern
Advanced Price Pattern Scanner and Price Breakout Pattern Scanner are the powerful tools to trade with Price Patterns. Simply speaking, Advanced Price Pattern Scanner and Price Breakout Pattern Scanner are the automated pattern scanner. To improve its trading performance, you might use other technical indicators to assist your trading decision. However, you can also use Peak Trough Analysis tool together.
I use this Peak Trough Analysis together with Advanced Price Pattern Scanner and Price Breakout Pattern Scanner. I basically try to find the intersection or overlapping of the patterns detected by indicator and by peak trough analysis. This approach hybridizes the price pattern trading. This approach can help to detect the true breakout direction.
Here is the download link for the free Peak Trough Analysis Tool for MetaTrader 4 and MetaTrader 5. They are absolutely free. Make sure to spend some time on Peak Trough Analysis tools to get comfortable with them.
https://www.mql5.com/en/market/product/23797
https://www.mql5.com/en/market/product/22420
https://algotrading-investment.com/portfolio-item/peak-trough-analysis-tool/
Below are the links to Advanced Price Pattern Scanner ( =Chart Pattern Scanner )
https://www.mql5.com/en/market/product/84567
https://www.mql5.com/en/market/product/84568
https://algotrading-investment.com/portfolio-item/advanced-price-pattern-scanner/
Below are the links to Price breakout Pattern Scanner
https://www.mql5.com/en/market/product/4859
https://www.mql5.com/en/market/product/4858
https://algotrading-investment.com/portfolio-item/price-breakout-pattern-scanner/
Related Products


