Harmonic Pattern – Predict Turning Point
In Forex and Stock trading, predicting turning points using harmonic patterns involves several steps.
- Identify Harmonic Patterns: The first step is to recognize potential harmonic patterns forming on price charts. Common patterns include ABCD, Gartley, Butterfly, Bat, and Cypher patterns. Traders often use charting software that can automatically detect these patterns or manually identify them by analyzing price movements.
- Confirm Pattern Completion Zone: Once a potential harmonic pattern is identified, traders confirm its completion by validating key Fibonacci ratios and geometric relationships between the pattern’s legs.
- Look for Confluence Zones: Traders often look for confluence zones where multiple harmonic patterns, Fibonacci levels, or other technical indicators align. These areas are considered stronger potential turning points as they provide additional confirmation.
- Use Oscillators and Momentum Indicators: Traders may use oscillators and momentum indicators, such as the Relative Strength Index (RSI) or Moving Average Convergence Divergence (MACD), to confirm potential turning points indicated by harmonic patterns. Divergence between price and these indicators can signal weakening momentum and support the likelihood of a reversal.
- Consider Price Action Signals: Price action signals, such as bullish or bearish candlestick patterns, can provide further confirmation of potential turning points indicated by harmonic patterns. For example, a bullish engulfing pattern or hammer candlestick forming at a confluence zone can strengthen the case for a bullish reversal.
- Manage Risk: Implementing proper risk management strategies is essential when trading based on harmonic patterns. Traders should set stop-loss orders to limit potential losses if the market moves against their predictions. Additionally, they should consider position sizing and risk-reward ratios to ensure that potential profits outweigh potential losses.
- Monitor Market Conditions: Market conditions can change rapidly, so traders should continuously monitor price action, news events, and other factors that may impact their trading decisions. Flexibility and adaptability are key to successfully trading harmonic patterns.
It’s important to remember that no trading strategy, including harmonic pattern trading, guarantees success. Traders should thoroughly backtest their strategies, practice risk management, and remain disciplined in their approach to trading. Additionally, staying informed about market dynamics and continuously improving one’s trading skills can enhance the effectiveness of using harmonic patterns to predict turning points.
Before using Harmonic Patterns, it is necessary to ask the rational behind the harmonic pattern, which is closely related to the prediction of the turning point. In fact, you will do the same for any trading strategy. You should never blindly trade because some one recommend you any particular strategy or you read some articles on website. You need to take sufficient time to understand the rational behind the trading strategy and then you will move on to the operation with the trading strategy.
Manual Detection of Harmonic Patterns is much more challenging exercise than Fibonacci Price patterns. However, it is still doable. Especially, if you have done through-exercise with Fibonacci Price patterns, then you can manage to detect Harmonic patterns. Many people might prefer to use automated harmonic pattern scanner instead of manual pattern detection. However, as we mentioned before, it is still better if you know the structure of the pattern and how to detect these patterns manually, then you can get more benefit from automated pattern scanner too. So we will introduce the structure of each pattern beiefly using simple Fibonacci Retracement and Expansion Notation. R is denoted for the ratio in Fibonacci Retracement.
There are two important points in regards to Fibonacci patterns. Firstly, you need to spot swing high and swing low in price series to identify Fibonacci price patterns. The easiest way of doing this is just to apply Peak Trough Transformation using either ZigZag indicator or Renko chart. Therefore, you start with predefined swing points in your chart. Secondly, Fibonacci retracement technique will concern one triangle that is two price swings. Fibonacci expansion technique will concern two triangles that are three price swings. Most importantly, calculation of Fibonacci retracement and expansion is identical to the retracement ratio and expansion ratio calculation in RECF definition. Sometimes, we might use percentage format instead of decimal format. However, two quantities are the same. For example, the Golden ratio 0.618 is the same as 61.8%.
Butterfly Pattern has the three-triangle structure. The three triangles are enclosed by one bigger triangle with one closing retracement ratio. Pattern definition of Butterfly Pattern can be described as below:
- C0: 1.270 to T0: 3,
- R0: 1.618 or 2.240, R1: 0.382 or 0.886, R2: 0.786
Gartley Pattern has the three-triangle structure. The three triangles are enclosed by one bigger triangle with one closing retracement ratio. Pattern definition of Gartley Pattern can be described as below:
- C0: 0.786 to T0: 3,
- R0: 1.130 or 1.618, R1: 0.382 or 0.886, R2: 0.618
BAT Pattern has the three-triangle structure. The three triangles are enclosed by one bigger triangle with one closing retracement ratio. Pattern definition of BAT Pattern can be described as below:
- C0: 0.886 to T0: 3,
- R0: 1.618 or 2.618, R1: 0.382 or 0.886, R2: 0.382 or 0.500
Alternate BAT Pattern has the three-triangle structure. The three triangles are enclosed by one bigger triangle with one closing retracement ratio. Pattern definition of Alternate Bat Pattern can be described as below:
- C0: 1.130 to T0: 3,
- R0: 2.000 or 3.618, R1: 0.382 or 0.886, R2: 0.382
Shark Pattern has the three-triangle structure. The three triangles are enclosed by one bigger triangle with one closing retracement ratio. Pattern definition of Shark Pattern can be described as below:
- C0: 0.886 – 1.130 to T0: 3,
- R0: 1.618-2.240, R1: 1.130-1.618
Crab Pattern has the three-triangle structure. The three triangles are enclosed by one bigger triangle with one closing retracement ratio. Pattern definition of Crab Pattern can be described as below:
- C0: 1.618 to T0: 3,
- R0: 2.618 or 3.618, R1: 0.382 or 0.886, R2: 0.382 or 0.618
Deep Crab Pattern has the three-triangle structure. The three triangles are enclosed by one bigger triangle with one closing retracement ratio. Pattern definition of Deep Crab Pattern can be described as below:
- C0: 1.618 to T0: 3,
- R0: 2.000 or 3.618, R1: 0.382 or 0.886, R2: 0.886
5 to 0 Pattern has the three-triangle structure. There is no closing retracement for 5 to 0 pattern. Pattern definition of 5 to 0 Pattern can be described as below:
- R0: 0.500, R1: 1.618 – 2.240, R2: 1.130-1.618
Now, let us have a look at why the harmonic pattern works in Forex and Stock market and why many chartiest uses the Harmonic Pattern to profit. This article “Patterns are the Good Predictor of Market Turning Point” is such an article helping you to understand the rational behind the harmonic patterns and its trading strategy. If you are harmonic pattern trader, then you must read this article.
In addition, you can watch the YouTube Video titled feel what is the automated harmonic pattern indicator like. For your information, we provides two YouTube videos with title and links below.
YouTube “Harmonic Pattern Indicator”: https://youtu.be/CzYUwk5qeCk
YouTube “Non Repainting Non Lagging Harmonic Pattern Indicator”: https://youtu.be/uMlmMquefGQ
=============================
Here are some list of the harmonic pattern indicators available in MetaTrader 4 and MetaTrader 5 platform. We also include some description for each harmonic pattern indicator.
Harmonic Pattern Plus
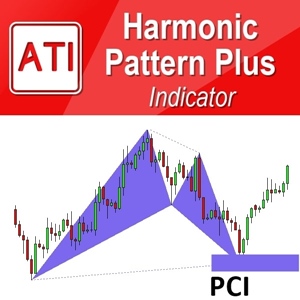
One of the first automated Harmonic Pattern detection tool released in 2014. It can detect 11 most popular harmonic patterns with well-defined trading entries and stops. Pattern Completion Interval, Potential Reversal Zone and Potential Continuation Zone are supported. In addition, other dozens of powerful features are added like Japanese candlestick detection, etc. Because of affordable price, this harmonic pattern detection indicator is loved by many traders. Please note that this is repainting and non lagging harmonic pattern trading system.
https://www.mql5.com/en/market/product/4488
https://www.mql5.com/en/market/product/4475
https://algotrading-investment.com/portfolio-item/harmonic-pattern-plus/
Harmonic Pattern Scenario planner
It is an advanced Harmonic Pattern indicator. On top of the features of Harmonic Pattern Plus, you can also predict future harmonic patterns through simulation. This is the tactical harmonic pattern tool designed for Professional harmonic pattern trader. Because of affordable price, this harmonic pattern detection indicator is loved by many traders. Please note that this is repainting and non lagging harmonic pattern trading system.
https://www.mql5.com/en/market/product/6240
https://www.mql5.com/en/market/product/6101
https://algotrading-investment.com/portfolio-item/harmonic-pattern-scenario-planner/
Both Harmonic pattern plus and Harmonic Pattern Scenario planner are the excellent trading system at affordable cost. However, if you do not like repainting Harmonic pattern indicator, then we also provide the non repainting and non lagging harmonic pattern trading. Indeed, the X3 Chart Pattern Scanner is the most advanced Harmonic Pattern and Elliott Wave pattern scanner. Just check the X3 Chart Pattern Scanner below.
Link to X3 Chart Pattern Scanner
https://www.mql5.com/en/market/product/41993
https://www.mql5.com/en/market/product/41992
https://algotrading-investment.com/portfolio-item/profitable-pattern-scanner/
Related Products


