Semi Automatic Way of Applying Harmonic Pattern
Optimum Chart provides more than ten different ways of applying harmonic patterns in your chart. Optimum Chart provides both manual and automated approach. You can always choose what works for you the best.
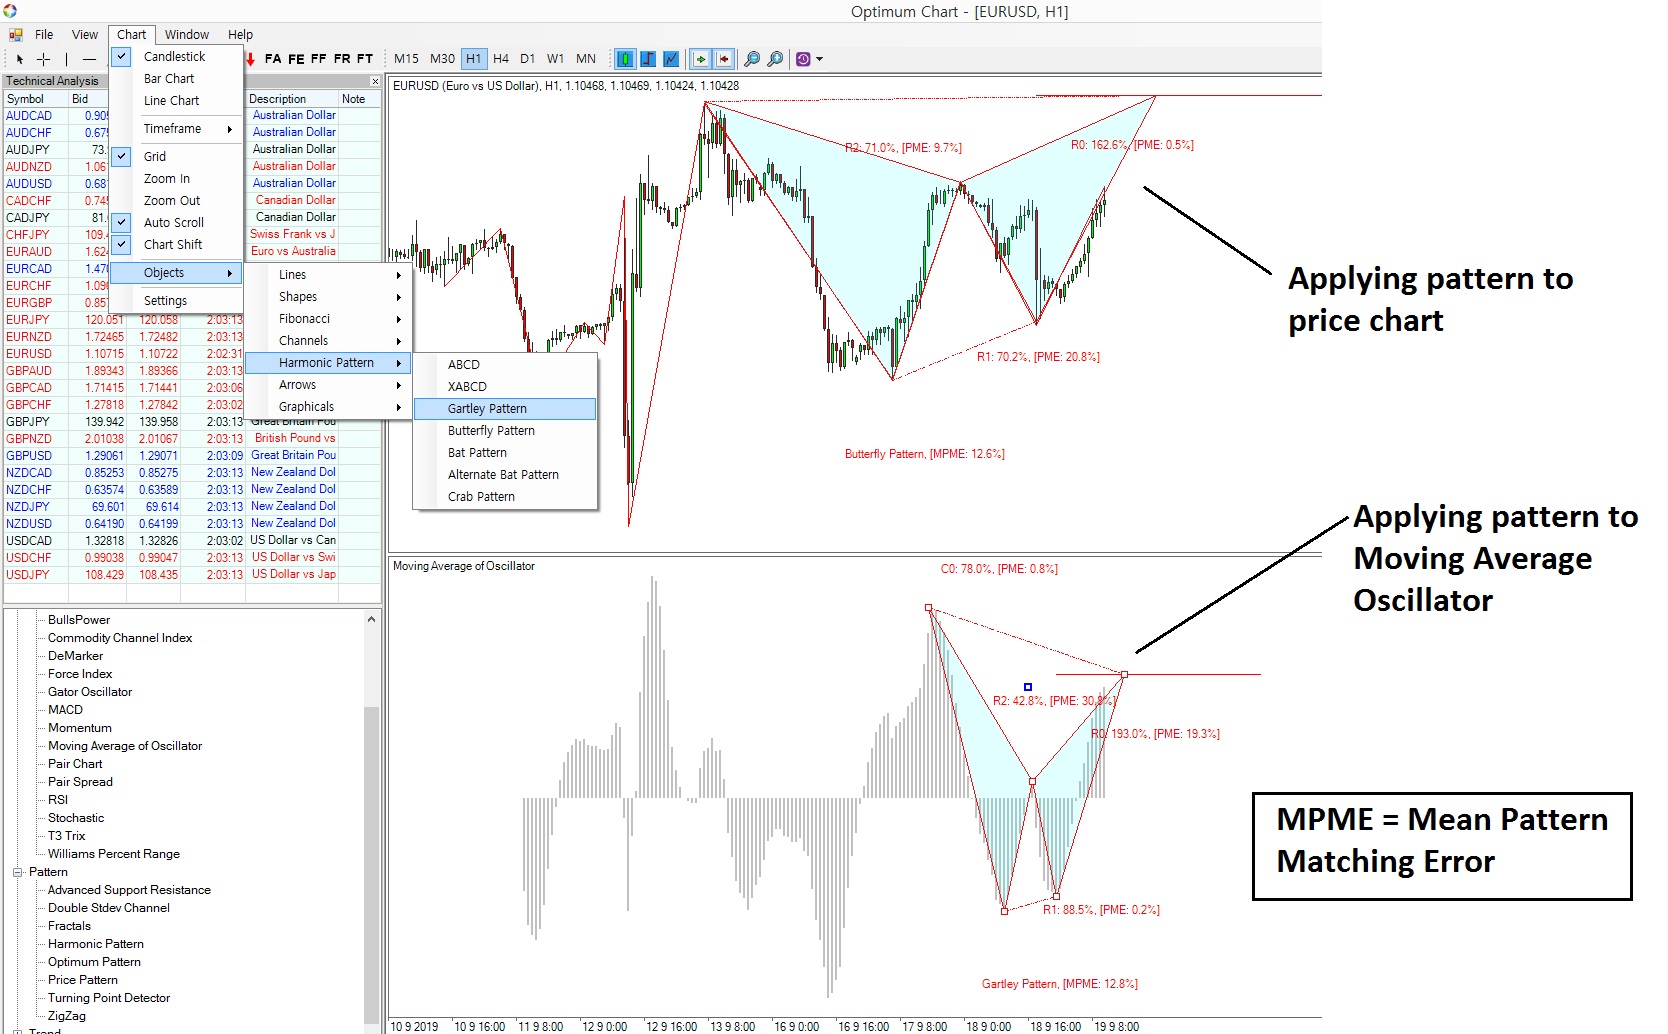
In this article, we will show you semi automatic way of applying Harmonic pattern. This semi automatic approach requires to pick up the points by yourself. However, this approach will provide you more flexible options in applying Harmonic Pattern. For example, with this approach you can apply Harmonic Pattern to Price Chart and Indicator Chart at the same time.
In this example, we picked up some portion of history chart. we have applied Butterfly pattern to price chart. We have applied Gartley pattern to Moving Average of Oscillator indicator. You can use other technical indicators like RSI, CCI and etc.
Here is the steps in projecting potential reversal zone.
1. Pick five points in your chart (these points are typically swing highs and swing lows)
2. Check PME and MPME to asses your pattern and minimize them below 15%.
PME stands for Pattern Matching Error and MPME stands for Mean Pattern Matching Error. In detecting pattern, you will be minimize both PME and MPME as small as possible. Typically you won’t get anything near zero. But you should aim to reduce this PME and MPME below 15% as we have shown in our screenshot.
Here is simple math to describe PME and MPME
- PME = Pattern Matching Error = 100% – PME = Pattern Matching Accuracy
- MPME = Mean Pattern Matching Error = Average Pattern Matching Error over all five points
Some people might like to work with PMA = Pattern Matching Accuracy. But do professional use Pattern Matching Error more to avoid any confusion between success rate and Pattern Matching Accuracy. They are not the same thing. You only work with PMA if they represents the probabilistic outcome. Since not in this case, we just use PME for some good reason.
Since you apply the pattern for both price and indicator level, you could improve the chance of winning. This confluence where two pattern meets, you will be able to enter at more accurate timing.
Here is some tips. Sometimes, you can apply the same pattern to both price and indicator chart. However, most of time, you will apply different pattern. This is because of price dynamics and indicator dynamics are different. Also pattern size in both price and indicator chart can be different. Sometimes, there is some trader just applying Harmonic Pattern to indicator only. You can develop your own preferences using the provided simulator in Optimum Chart. See which one works the best for your trading.
Optimum Chart provide automated Harmonic Pattern indicator, Pattern Scanner dashboard and even non repainting algorithm. You have the array of choice in using Harmonic pattern for your trading. However, this semi automatic approach has its own ground. Professional trader likes to this sort of approach in spite of having fully automated indicator on their hands. So we provide this approach as well.
Optimum Chart is the most powerful Price Action and Pattern Trading platform.
Below is the link to Optimum Chart.
https://algotrading-investment.com/2019/07/23/optimum-chart/
https://algotrading-investment.com/
Related Products


