Average Price and Time of Turning Point to Understand Stochastic Cycle
Stochastic cycle analysis is a technical analysis tool used in financial markets to identify potential turning points in price trends, for example in Forex and Stock trading. It’s based on the concept that market prices tend to move in cycles, oscillating between periods of expansion and contraction.
The “average price” in terms of stochastic cycles refers to the mean price level observed during the cycles. It can be calculated by summing up the prices at different points within the cycle and dividing by the total number of observations. This average price provides insight into the typical price level around which the cycle oscillates.
The “average time of turning point” in terms of stochastic cycles refers to the typical duration of a cycle before a significant turning point occurs. It can be calculated by averaging the time intervals between successive turning points within multiple cycles. This average time helps traders and analysts anticipate when the next turning point might occur in the market.
Both the average price and average time of turning points in stochastic cycles can be valuable for traders and analysts in timing their entries and exits in the market. However, it’s important to note that these averages are based on historical data and may not always accurately predict future market behavior. Therefore, they should be used in conjunction with other technical indicators and risk management strategies for effective trading decisions.
Financial market possesses the hardest level of cycle problem, known as Stochastic cycle, which has the distinguishable attributes over the regular cycle problem in the technical analysis. For example, in the technical analysis, the technical indicator or algorithm to handle regular cycle problem often fails to provide any advantage in Forex and Stock market because they are not designed to handle stochastic cycle but regular cycle only. First of all, you may need to understand the difference between Stochastic cycle and regular cycle. Furthermore, if you aim to keep consistant trading performance, you need to fulfill two things. Firstly, understanding the stochastic cycle is a important factor for your success in Forex and Stock trading. Secondly, it is advantegeous if you have the tool that can measure the stochastic cycle. In this article, we will provide you the basic explanation through the stochastic cycle in Forex and Stock market to help your day trading. Let us start with some basics.
If the price data in forex and stock market possess the deterministic cycle, the algorithm like Fourier transformation, Wavelet transformation or Singular Spectrum Analysis could provide us the wavelength and amplitude of the specific cycle we want to trade. This could make our trading much easier and profitable. However, forex and stock market are affected by too many internal and external variables. The market are rather impulsive and fuzzy. In another words, the amplitude and wavelength of a cycle can not be guaranteed. Therefore, the deterministic cycle approach might be not the viable option for the choice of trading strategy.
Fractal wave in the price data possess the statistical self-similarity. This is close to the stochastic cycle rather than the deterministic cycle. In the stochastic cycle, the wavelength and amplitude of a cycle are not fixed but they can vary. The peak trough transformation introduced in this book is the effective method to extract the stochastic cycle in the financial market. In another words, we can measure the probability of a cycle after the price data is transformed to the peaks and troughs. Although we are likely to have the triangular fractal wave, this is hardly not a problem. We can still calculate the probability of the wavelength and amplitude of the specific cycle. In real world, the price data will show complex structure, which the triangular fractal wave is combined with some trends. Hence, they are not stationary. We have shown the combined data structure of the fractal wave and a trend in the fifth column of the price pattern table.
We can predict when a peak or trough will arrive in the price data with a probability. This was referred to as the turning point probability in the book: Predicting Forex and Stock Market with Fractal Pattern (Young Ho Seo, 2020). For example, when price is moving up from the trough, we can make the prediction when the peak will arrive by measuring the change in price and time. In another words, we can predict the position of swing high from the previous swing low in the statistical sense.
Likewise, when price is moving down from the peak, we can make the prediction when the trough will arrive by measuring the change in price and time. In another words, we can predict the position of swing low from the previous swing high in the statistical sense. This turning point probability is the statistical prediction made after the peak trough transformation of the price data. Since there are multiple of fractal wave cycles in the price data, we can calculate the turning point probability for each fractal wave cycle. In the book: Predicting Forex and Stock Market with Fractal Pattern (Young Ho Seo, 2020), the technique was referred to as the Fractal Cycle Analysis or FCA. Just like the Fourier transformation, Wavelet transformation or Singular Spectrum Analysis provide the analysis over multiple deterministic cycles, Fractal Cycle Analysis provides the analysis over multiple stochastic cycles. Fractal Cycle Analysis is the good technique to use when the deterministic cycle analysis is not applicable to the data.
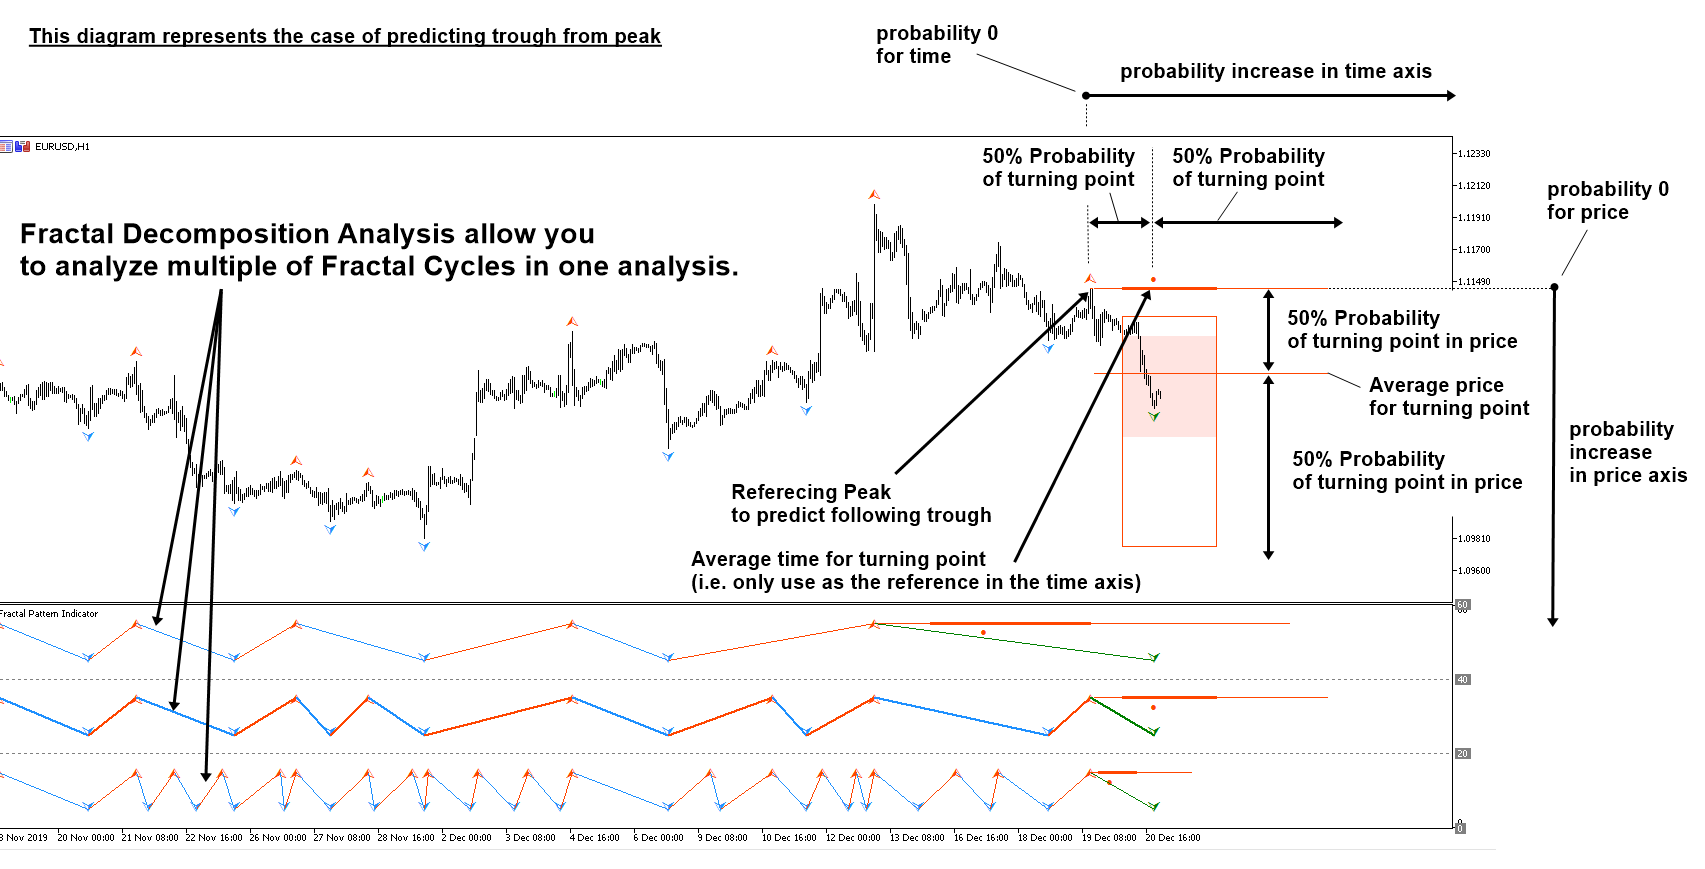
Fractal Decomposition Analysis (FDA) is the first technique that allow us to view the turning point in the financial market through the detailed probability analysis. since FDA allow us to use multiple of Fractal Cycle analysis, you can also called this technique as Fractal Cycle Analysis (FCA). Here we will share some of its anatomy involved in predicting Turning point using probability using FDA. In the screenshot, we shows the average price and time of turning point. Average price of turning point is where it divides the price axis into two section with equal 50% probability. Likewise, average time of turning point is where it divides the time axis into two section with equal 50% probability. Also average price can be considered as the expected price range before turning point occurs. Likewise, average time can be considered as the expected time range before turning point occurs. When we say expected values in statistics, it means that actual turning point occurrences can be fluctuating around these expected values (=mean).
As you can see from the screenshot, average price and time is not in the middle of the distribution. You wonder why this is the case. The distribution, empirical distribution measured, is not symmetric. Distribution is skewed. Hence, we have thin and long right tail. Theoretically speaking, small Fractal cycle would be slightly more accurate. However, medium and large cycle are both good reference for our trading and predicting next turning point. We recommend to overview all these three cycles when you make the trading decision.
As a default setting, we have inner probability and outer probability as 68% and 95% respectively. These two probability setting can be used to filter out some of the probability you do not want to use. At the same time, you can change the inner probability and outer probability as any values you want as long as inner probability is smaller than outer probability. You might consider using 80% and 90% values for the setting.
Here is the landing page for Fractal Pattern Scanner for MetaTrader 4 and MetaTrader 5.
https://www.mql5.com/en/market/product/49170
https://www.mql5.com/en/market/product/49169
https://algotrading-investment.com/portfolio-item/fractal-pattern-scanner/
Related Products


