Equilibrium Fractal Wave for Technical Analysis
Equilibrium Fractal Wave (EFW) is a technical analysis tool used by traders and analysts to identify potential price reversals and trends in financial markets. Equilibrium Fractal Wave is based on fractal geometry and the concept of equilibrium, aiming to capture the cyclical nature of market movements.
Here’s a breakdown of the key components and principles of Equilibrium Fractal Wave:
- Fractals: Fractals are geometric patterns that repeat at different scales. In financial markets, fractals can represent recurring price patterns that indicate market behavior. EFW identifies these fractal patterns within price charts.
- Equilibrium Zones: Equilibrium zones are areas on a price chart where buying and selling pressures are relatively balanced. These zones are crucial as they often indicate potential turning points in the market.
- Wave Analysis: EFW uses wave analysis to identify patterns of price movement within the market. It seeks to capture the rhythm of market cycles, which can range from short-term fluctuations to longer-term trends.
- Support and Resistance: EFW helps traders identify support and resistance levels within the market. Support levels are where buying pressure is expected to be strong enough to prevent the price from falling further, while resistance levels are where selling pressure is expected to cap further price gains.
- Predictive Analysis: By analyzing the fractal patterns and equilibrium zones, EFW attempts to predict future price movements in the market. Traders use this information to make informed decisions about buying, selling, or holding positions.
- Risk Management: Like any technical analysis tool, EFW is also used for risk management purposes. Traders may use it to set stop-loss orders or determine the optimal entry and exit points for their trades.
It’s important to note that while Equilibrium Fractal Wave can be a valuable tool for technical analysis, it is not infallible. Like all technical analysis methods, it relies on historical price data and patterns, which may not always accurately predict future price movements. Therefore, traders often use EFW in conjunction with other technical analysis tools and fundamental analysis to make well-rounded trading decisions.
In this artcicle, we will describe the common wave patterns found in Forex and Stock data, also known as Equilibrium Fractal-Wave, in terms of the Technical Analysis and Technical Indicator. For example, we will explain Equilibrium Fractal Wave in regards to Fibonacci Analysis like Fibonacci Retracement and Fibonacci Expansion. Application wise, if you want to understand why past market cycle is very similar to current market cycle, but you can not do anything about it, this article will provide you some insight. However, we recommend reading the book: Scientific Guide To Price Action and Pattern Trading: Wisdom of Trend, Cycle, and Fractal Wave for the complete understanding of the topic.
Like Equilibrium Wave Process, Equilibrium Fractal-Wave process combines Equilibrium process with Fractal-Wave process (trend and fractal wave). Simply speaking, Equilibrium Fractal-Wave will show the trend patterns together with self-repeating wave patterns. Many financial prices series exhibit Equilibrium Fractal-Wave process in Stocks, Forex and Futures markets. In Chapter 8, we have shown how heartbeat and financial price series differ from each other even though they contain Fractal-Wave. In addition, in the analytical note, we have shown that in nature the building block of the fractal geometry can take many forms from line to square. In fact, this geometry is corresponding to Fractal dimension quantity. Here is one important question before proceeding. What would be the building block of the fractal geometry in the financial market?
We have already shown in Table 8-1 that Fractal Dimension of Financial market is between 1.2 and 1.5. This is close value to other Fractal geometry, whose building blocks are triangle. It is in the middle between line 1.0 and square 2.0 of fractal geometry. The basic building block of the fractal geometry in the financial market is most likely the triangle. The triangle is made up from two price moves in the financial market. Since these triangles are propagating to reach the market equilibrium price, we can call these triangles as the equilibrium fractal wave. We have already covered the difference between Fractal wave and Equilibrium Fractal Wave. It depends on that price series has the horizontal patterns or not. For example, if the price series is fluctuating around the fixed mean, it is Fractal wave. If the price series is not bound to fixed mean and it has an open and unknown final destination, then it is Equilibrium Fractal Wave. In fact, for our financial trading, we need to concern more on equilibrium fractal wave than fractal wave.
To give you some idea on equilibrium fractal wave in the financial market, let us have some real world example using currency pairs. Regardless of how long the market goes on, the market can be described with few equilibrium fractal waves. For example, the financial prices series with 20 years of history can be described using two equilibrium fractal waves. Likewise, the price series with 2 weeks historical data can be described using two equilibrium fractal waves too. The main difference is that there are more jagged triangles inside the financial price series for 20 years comparing to the two weeks data.
To use Equilibrium Fractal Wave for our trading, we have to understand the characteristics of equilibrium fractal wave. In this book, we outline the five most important characteristics for your trading. When you trade with a single equilibrium fractal wave or multiple of equilibrium fractal waves (i.e. Elliott wave or harmonic patterns), you will find out that the trading strategies are based on one or few of these characteristics.
The first characteristic of equilibrium fractal wave is the repeatability. While the price is moving to its equilibrium price level, we observe the zigzag path of the price movement. After extensive price rise, the price must fall to realize the overvaluation of the price. Likewise, after extensive price fall, the price must rise to realize the undervaluation of the price. This price mechanism builds the complex zigzag path of the price movement. During the zigzag path, the price shows the four possible triangle shapes. These four equilibrium fractal waves are the mirrored image of each other. Therefore, they are the fractal. The complex price path in the financial market is in fact the combination of these four equilibrium fractal waves in alternation. Whenever the price needs to move on to the equilibrium level, the price will travel in the zigzag path through the combination of these four equilibrium fractal waves in alternation.
The second characteristic of equilibrium fractal wave is that equilibrium fractal wave can be extended to form another bigger equilibrium fractal wave. During economic data release or market news release, financial market can experience a volatility shock. When market experiences the volatility shock, the last leg of equilibrium fractal wave can extend to adapt the shock introduced in the market. Even after the extension, the equilibrium fractal wave still maintains its fractal geometry, the triangle. Hence, the fractal nature of financial market is unbreakable. This price extension often determines the reversal or breakout movement around the important support and resistance levels. One possible way of trading with this second characteristic is to trade on the potential size of equilibrium fractal wave. In the case of reversal, we are betting on that the size of wave will be small. In the case of breakout, we are betting on that the size of wave will be big. This characteristic is also the basis for the straddle trading strategy during the important economic data release.
Third characteristic of equilibrium fractal wave is that smaller equilibrium fractal waves can combine to form a bigger Equilibrium Fractal Wave. Imagine, when the equilibrium fractal wave is propagating, it will start with smaller equilibrium fractal waves first. After the appearance of the several equilibrium fractal waves, we can draw the bigger equilibrium fractal wave by joining these smaller waves. These kinds of jagged patterns are repeatedly found in the financial market. This third characteristic is often used by a professional trader to improve the predictability of the financial market. For example, instead of puzzling with a set of small equilibrium fractal waves, it is much more accurate to puzzle with both small and big equilibrium fractal waves together to predict the market direction. If you want to become a successful trader, you will need a discipline on how to combine small and big equilibrium fractal waves for your trading. Of course, later, we will show you how to improve your trading performance using this principle.
The fourth characteristic of equilibrium fractal wave is the infinite scales. The infinite scales mean that you will see the similar patterns repeatedly in the price series while their sizes are keep changing. The repeating pattern can come in any size from small to large. For example, if we stack the varying size of equilibrium fractal waves with the particular shape ratio, then literarily we can stack the infinite number of triangle. This implies the infinite number of cycle periods. This is exactly why “Equilibrium Fractal-Wave” process is much harder to be handled by traditional technical indicators because they were not designed to deal with the infinite scaling problem most of time.
The fifth characteristic of equilibrium fractal wave is the loose self-similarity (heterogeneity). In nature, it is easy to find the strict self-similarity. However, we can only expect the loose self-similarity in the financial market due to the highly diverse players, participating in the market. Even though all the equilibrium fractal waves will have the triangular form, their shape ratios will be different. For example, if we display all shape ratios in price series, we will expect the different shape ratios to its adjacent one. This does not mean that we will never have the similar or identical shape ratios in history. In fact, we get lots of them repeating in the history. For example, we get to see the shape ratio of 0.618 all the time in the financial market. However, we are just saying that the same shape ratios will not often come in the successive manner. This heterogeneous characteristic also implies that the financial market have some shapes more frequently occurring than some other shapes. This also has an important implication for our trading. Imagine that we have a financial market with three shape ratios 0.450, 0.850 and 1.300. We only found the shape ratio 0.450 and 1.300 repeated ten times in the historical data whereas the shape ratio 0.850 repeated 100 times in the historical data. Which shape ratio shall we trade with? Of course, we will trade with the ratio 0.850. Likewise, last hundreds years, traders had a solid belief in using the Fibonacci ratios like 0.618, 0.382 and 1.618 for their trading. This belief is based on the assumption that the Fibonacci ratios 0.618, 0.382 and 1.618 occurs more frequently comparing to other non-Fibonacci ratios like 0.567, 0.855, 1.333, etc in the financial market. This loose self-similarity (heterogeneity) is the rationale behind the Fibonacci ratio analysis and other Fibonacci ratio based strategies like Elliott Wave and Harmonic Pattern. The main idea is that, among many shape ratios, we need to choose the most frequently occurring shape ratio for our trading.
Each equilibrium fractal wave can be combined to form the patterns that are more complex. Several popular tradable patterns can be derived by combining several equilibrium fractal waves. For example, Harmonic patterns are typically made up from three equilibrium fractal waves. Impulse Wave 12345 pattern in Elliott Wave Theory is typically made up from four equilibrium fractal waves. Corrective Wave ABC pattern in Elliott Wave Theory is made up from two equilibrium fractal waves. Like the case of Elliott Wave patterns and Harmonic patterns, some derived patterns can have some definite number for equilibrium fractal wave for the defined patterns. However, there are some derived patterns does not have the definite number of equilibrium fractal wave. For example, rising wedge, falling wedge and triangle patterns does not require the definite number of equilibrium fractal wave. Rising wedge, falling wedge and triangle patterns are envelops connecting highs and lows of each equilibrium fractal wave.
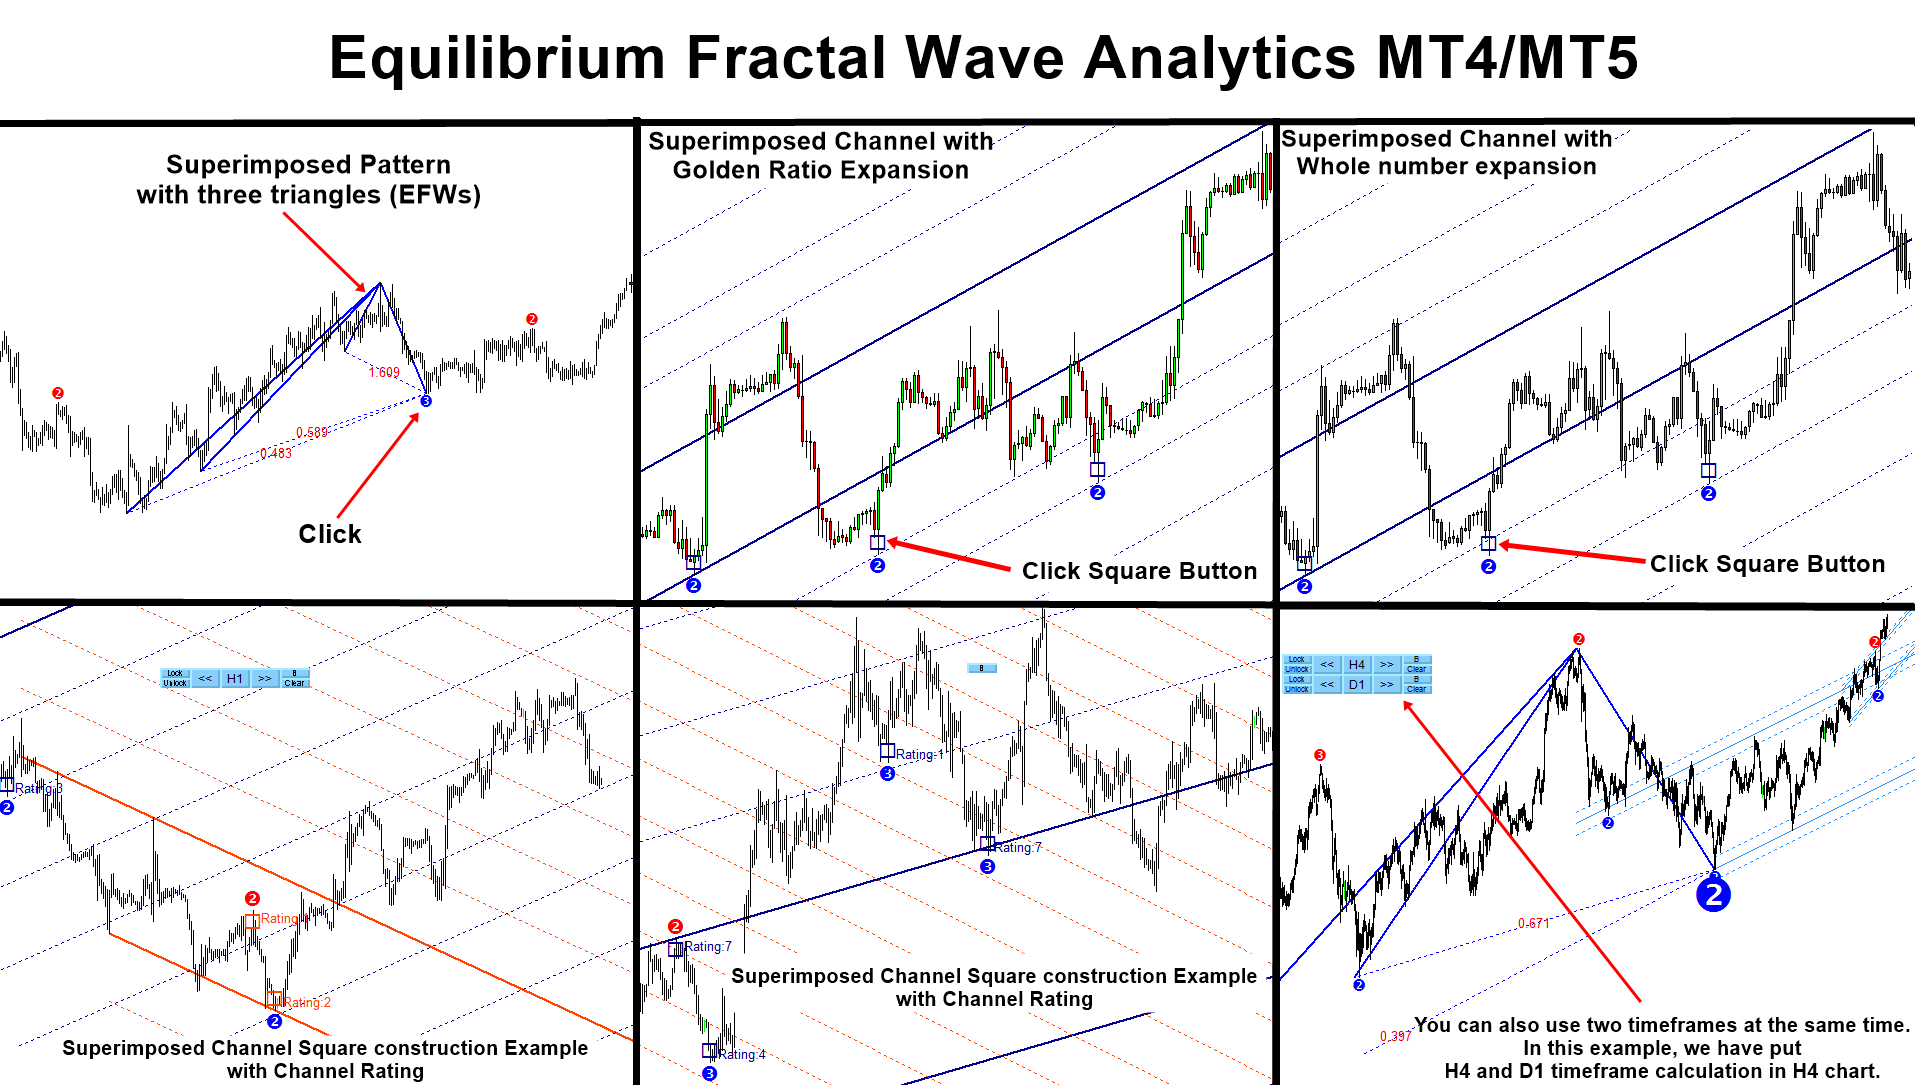
EFW Analytics was designed to accomplish the statement “We trade because there are regularities in the financial market”. EFW Analytics is a set of tools designed to maximize your trading performance by capturing the repeating fractal geometry, known as the fifth regularity in the financial market. The functionality of EFW Analytics consists of three parts including:
1. Equilibrium Fractal Wave Index: exploratory tool to support your trading logic to choose which ratio to trade
2. Superimposed Pattern Detection as turning point analysis
3. Superimposed Channel for market prediction with Golden ratio expansion
4. Superimposed Channel for market prediction with whole number expansion
5. Equilibrium Fractal Wave (EFW) Channel detection
6. Superimposed Channel Rating (Higher rating = higher predictive power)
EFW Analytics provide the graphic rich and fully visual trading styles. In default trading strategy, you will be looking at the combined signal from Superimposed pattern + EFW Channel or Superimposed pattern + Superimposed Channel. In addition, you can perform many more trading strategies in a reversal and breakout mode. You can also run two different timeframes in one chart to enforce your trading decision. Sound alert, email and push notification are built inside the indicator.
Below is the link to the EFW Analytics:
https://algotrading-investment.com/portfolio-item/equilibrium-fractal-wave-analytics/
https://www.mql5.com/en/market/product/27703
Related Products


