Fibonacci Ratio with Probability
Combining Fibonacci ratios with probability can be a powerful approach, especially in fields like trading, technical analysis, and forecasting. Here’s a breakdown of how you can combine these two concepts:
Understanding Fibonacci Ratios: Fibonacci ratios, derived from the Fibonacci sequence, are mathematical relationships that occur frequently in nature and financial markets. The key Fibonacci ratios include 0.236, 0.382, 0.500, 0.618, and 0.786. These ratios are often used to identify potential support and resistance levels in financial instruments.
- Identifying Fibonacci Levels: Start by identifying significant highs and lows in the price movement of a financial instrument. Then, apply Fibonacci retracement or extension tools to these points. Retracement levels are typically used to identify potential areas of support or resistance, while extension levels are used to project potential price targets.
- Confirming with Probability: While Fibonacci levels can provide valuable insights, they should ideally be confirmed by other technical indicators or analysis methods to increase the probability of a successful trade or forecast. This can include indicators like moving averages, trendlines, volume analysis, or chart patterns.
- Using Probability in Trade Management: Probability can also be integrated into trade management strategies. For example, traders can use probability analysis to determine the likelihood of a trade reaching certain price levels based on Fibonacci retracement or extension levels. This information can then be used to set profit targets and stop-loss levels accordingly.
- Risk Management: Probability analysis should also inform risk management decisions. Traders should assess the probability of a trade’s success relative to its potential risk, ensuring that the risk-reward ratio is favorable. This involves setting appropriate position sizes and adjusting them based on the perceived probability of success.
- Continuous Learning and Adaptation: Financial markets are dynamic and subject to change. Traders and analysts should continuously learn and adapt their strategies based on evolving market conditions, new information, and advancements in analysis techniques.
By combining Fibonacci ratios with probability analysis, traders and analysts can develop more robust trading strategies and make more informed decisions in the financial markets. However, it’s essential to remember that no strategy can guarantee success, and risk management remains paramount in any trading approach.
In this article, we will share the tips using Fibonacci Ratio with Probability calculated from Fractal Pattern for Forex Trading and Stock trading. In our last article, we have shown that good trading strategy (i.e. good market prediction) essentially requires both relative term and absolute term.We will not explain how both relative term and absolute term works for your trading in this article as we have explained it another article. You can find more information about relative term and absolute term from below article.
https://algotrading-investment.com/2020/01/23/fibonacci-retracement-in-forex-and-stock-market/
Let us start. In fact, Fibonacci pattern analysis in financial trading is extremely popular. As with support and resistance analysis, Fibonacci analysis is probably the most popular technical analysis among traders. There are two important techniques in Fibonacci analysis. First technique is Fibonacci retracement. Second technique is Fibonacci expansion. In fact, former is just one triangle pattern and latter is two triangle patterns. Hence, you can consider these two as Fibonacci price patterns. These two price patterns share the identical concept to the retracement ratio and expansion ratio introduced earlier.
There are two important points in regards to Fibonacci patterns. Firstly, you need to spot swing high and swing low in price series to identify Fibonacci price patterns. The easiest way of doing this is just to apply Peak Trough Transformation using either ZigZag indicator or Renko chart. Therefore, you start with predefined swing points in your chart. Secondly, Fibonacci retracement technique will concern one triangle that is two price swings. Fibonacci expansion technique will concern two triangles that are three price swings. Most importantly, calculation of Fibonacci retracement and expansion is identical to the retracement ratio and expansion ratio calculation in RECF definition. Sometimes, we might use percentage format instead of decimal format. However, two quantities are the same. For example, the Golden ratio 0.618 is the same as 61.8%.
Let us start with Fibonacci retracement example. For simple example, we use 61.8% Golden ratio. For retracement, we can have two cases including bullish (Trough-Peak) retracement and bearish (Peak-Trough) retracement. In bullish retracement, 61.8% retracement level will act as a support level. Price will reverse in the correction phase to follow the previous bullish movement. In RECF pattern definition, 61.8% bullish retracement can be expressed as below:
R0 = 0.618 = Right swing of first triangle / Left swing of first triangle
Likewise, in bearish retracement, 61.8% level will act as resistance. Price will reverse in the correction phase to follow the previous bearish movement. In both case, the 61.8% retracement will be measured by dividing price height of latest swing to price height of previous swing. We have used percentage in this example. Some technical traders prefer to use the ratios in decimal places like 0.618. It is just your preferences. Using ratio or percentage does not affect the accuracy of trading. In RECF pattern definition, 61.8% bearish retracement can be expressed as below:
R0 = 0.618 = Right swing of first triangle / Left swing of first triangle
You can use other Fibonacci ratios like 0.382 or 1.618 in the exactly same way as 0.618. Some traders use secondary Fibonacci ratios in addition to the primary ratios.
Fibonacci expansion is slightly more complicated than Fibonacci retracement because it concerns two triangle (i.e. three price swings). As in retracement technique, we can have two cases including bearish (Trough-Peak) expansion and bullish (Peak-Trough) expansion. In bearish expansion, we will measure the expansion from where the correction ends to next peak. In the next peak, we will expect the bearish reversal in the same direction to the correction. In fact, the 100% Expansion level is act as the resistance. Likewise, in bullish expansion, we will expect the bullish reversal in the same direction to the correction. 61.8% expansion level acts as the support. In RECF pattern definition, 61.8% bearish and bullish retracement can be expressed as below:
E0 = 0.618 = Right swing of first triangle / Left swing of second triangle
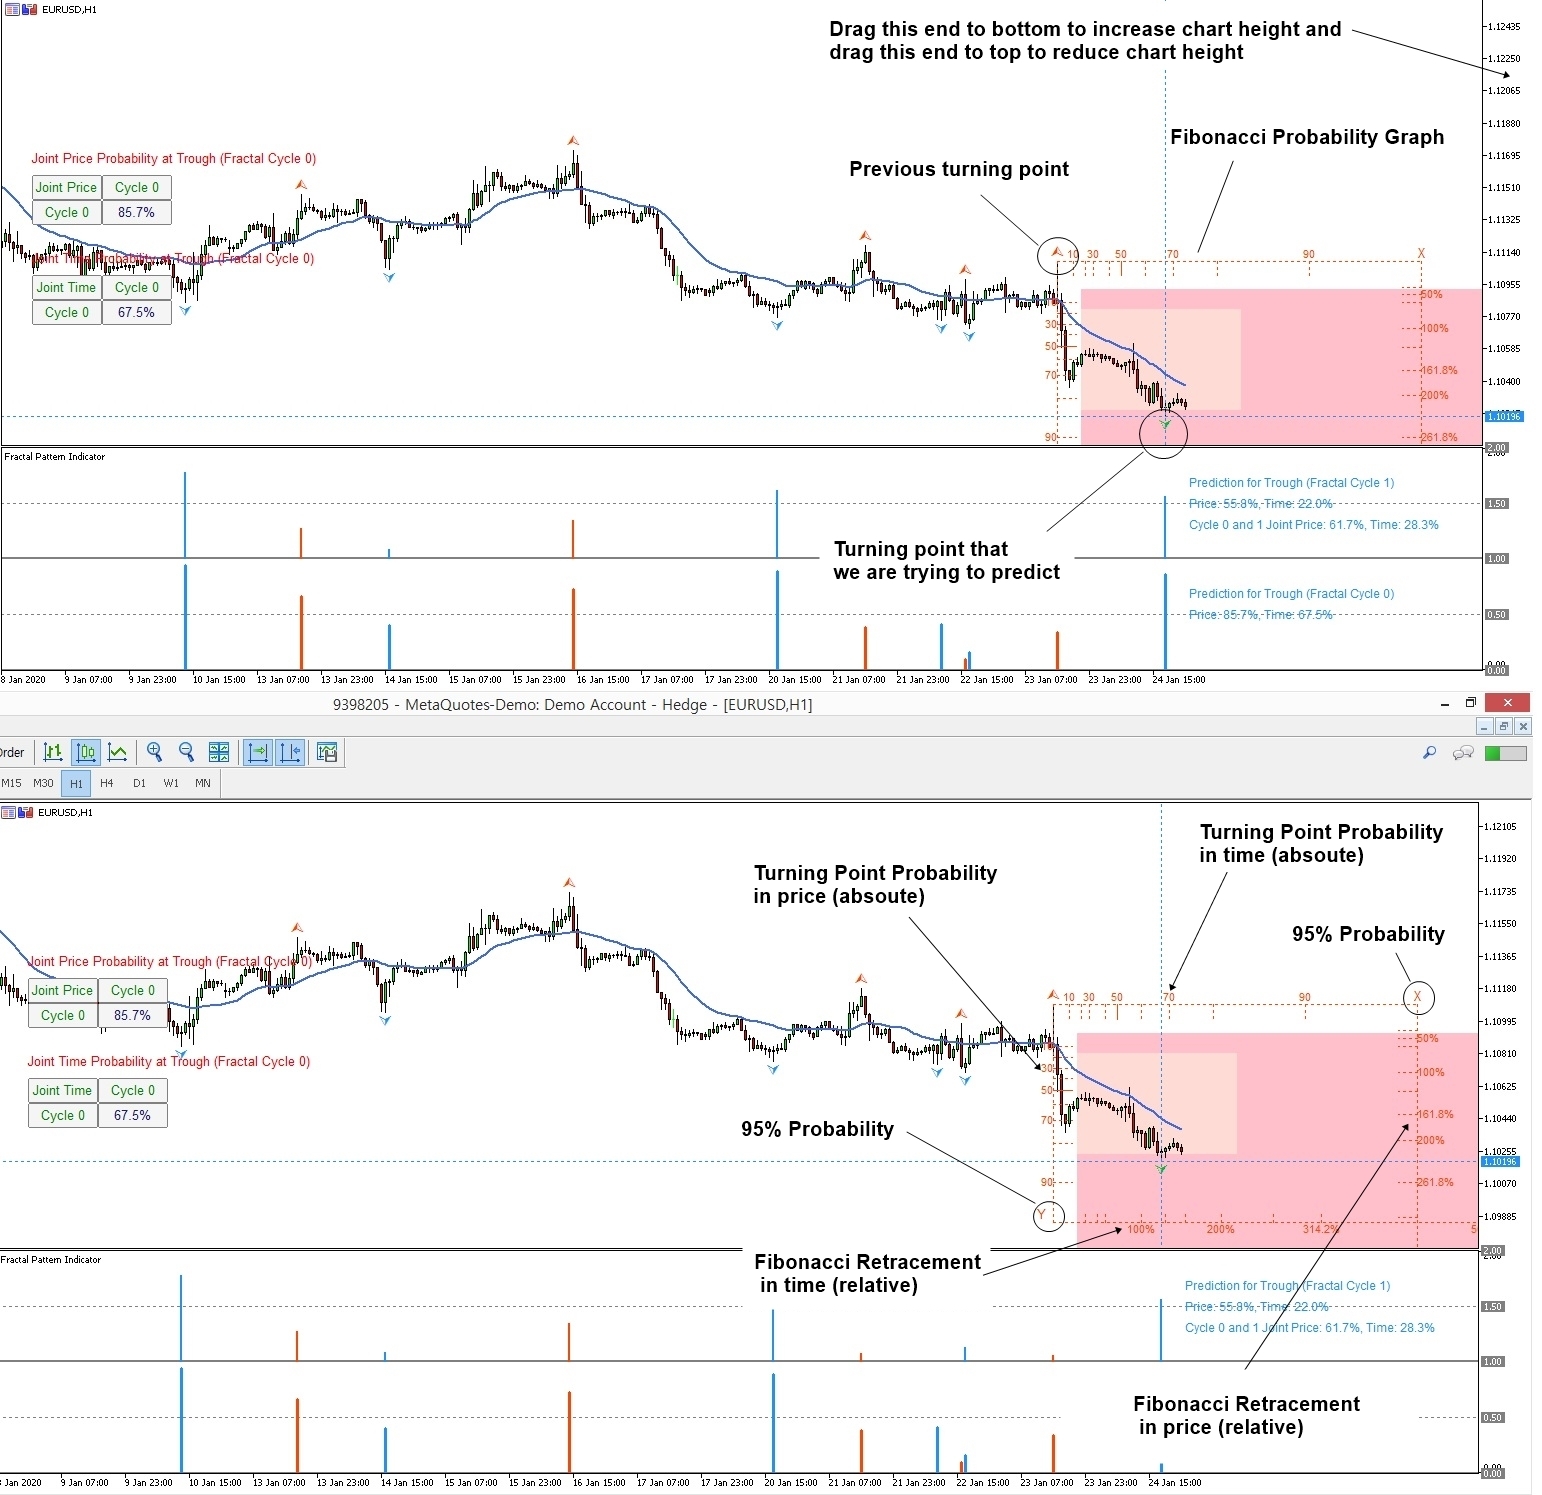
Assuming you have understood how Fibonacci Analysis works for Forex trading, now you need to understand why you need Fibonacci Probability Graph (or Probability Fibonacci Graph) to enhance your trading. It is because Fibonacci Probability Graph provides both relative term and absolute term in your trading equation. Hence, we share some little tip in this article.
Fibonacci Probability Graph consists of four main components.
1. Turning Point Probability in price (absolute term)
2. Turning Point Probability in time (absolute term)
3. Fibonacci retracement in price (relative term)
4. Fibonacci retracement in time (relative term)
Fibonacci Probability Graph uses two axis that are primary and secondary axis. Fibonacci Probability Graph is drawn from the previous turning point since its primary goal is to predict future turning point from the previous turning point.
If we are predicting peak, then Fibonacci Probability Graph is drawn like below:
1. Left Y axis = Turning Point Probability in price
2. Bottom X axis = Turning Point Probability in time
3. Right Y axis = Fibonacci Retracement in price
4. Top X axis = Fibonacci Retracement in time
If we are predicting trough, then Fibonacci Probability Graph is drawn like below:
1. Left Y axis = Turning Point Probability in price
2. Bottom X axis = Fibonacci Retracement in time
3. Right Y axis = Fibonacci Retracement in price
4. Top X axis = Turning Point Probability in time
However, sometimes, the chart scale does not cover the top or bottom axis. Hence, you might miss Fibonacci Retracement in time. In MetaTrader 4 and MetaTrader 5, you can rescale chart height by dragging price axis on the right side of chart. Hence, to see Fibonacci Retracement in time, you might have to increase chart height by dragging price axis.
When you do not need to see Fibonacci Retracement in time, then you can reduce chart height back. I do this all the time. I think some starters might find it difficult. Hence, I share this article with you.
Below is the landing page for Fractal Pattern Scanner.
https://www.mql5.com/en/market/product/49170
https://www.mql5.com/en/market/product/49169
https://algotrading-investment.com/portfolio-item/fractal-pattern-scanner/
Related Products


