Repainting and Dynamic Update on Fibonacci Price Pattern Detection
For manual pattern detection, we never recommend to start with bear hands. That is bad idea because you have millions of different possible scenarios in detecting those price patterns. Instead, you need a tool to transform price series to view this pattern easier. Remember that turning point is either peak or trough in your chart. When price is transformed into peaks and troughs using an automated tool, it is much easier to detect these patterns. Hence, we provide Peak Trough Analysis indicator to go with this book. The provided Peak Trough Analysis consists of three different tools including:
- Original Fractal Indicator by Bill Williams
- Modified Fractal Indicator of the Original Fractal Indicator
- and ZigZag Indicator
Among these three tools, we will use ZigZag indicator mostly as our primary peak trough transformation tool. It is because ZigZag indicator is much more efficient when it comes to detect those price patterns in the outlined four methodology. Once Peak Trough Analysis is applied into your price series (Figure 2-6). We get several important benefits.
- Ratio analysis for pattern recognition.
- Potential scenario reductions in pattern recognition.
- Non Lagging (fast) detection of patterns
First benefit, ratio analysis is directly related to the pattern structure in the four outlined methods. Without the ratio analysis, it is almost impossible to conduct pattern detection task. Second benefit, potential scenario reduction in pattern recognition, is also important because this helps us save a lot of time and effort in detecting these patterns. These two benefits are almost essential if you are trading with these price patterns. The third benefit, non-lagging pattern detection, is the benefit we get from using ZigZag indicator. The benefit of fast pattern detection is rather relative to Original Fractal indicator and Modified Fractal indicator. Fast pattern detection is good but it comes with some trade off. We will discuss about this trade off in details because it is important to understand the behaviour of ZigZag indicator before using them.
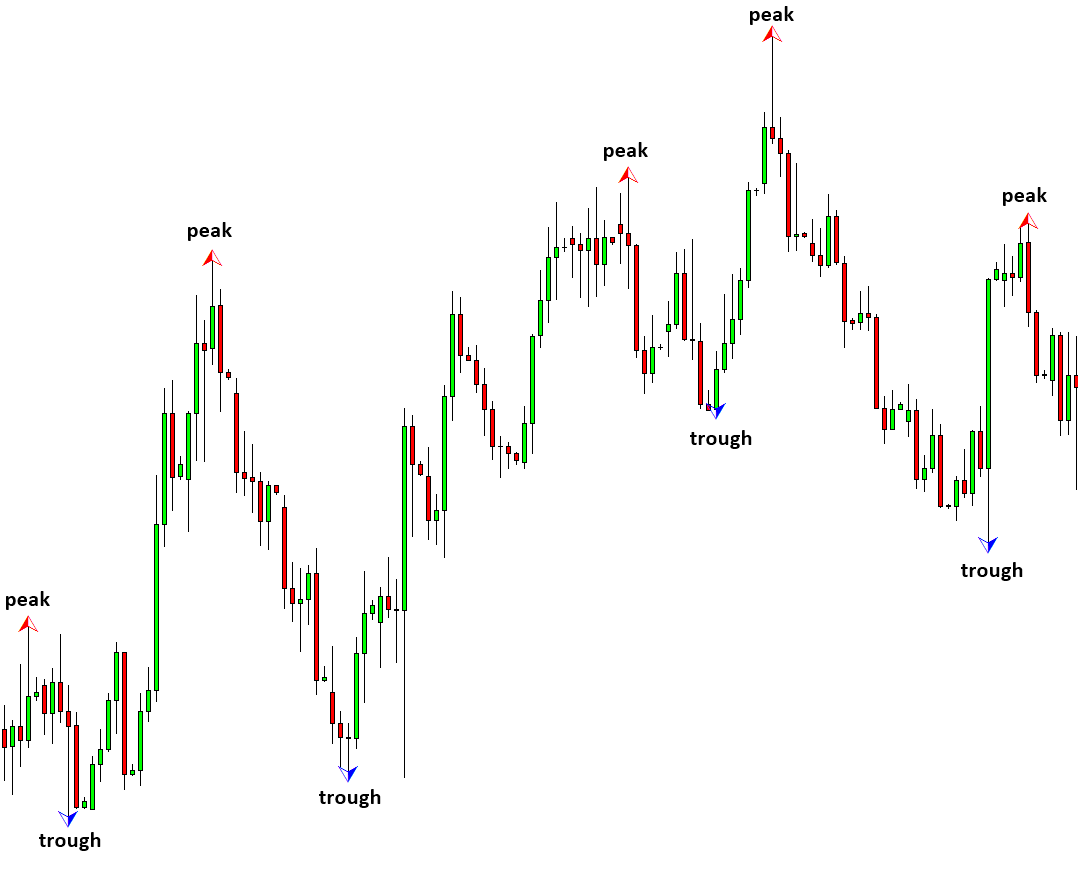
Figure 2-6: Peaks and troughs detected in EURUSD Daily chart (ZigZag mode was used in the Peak Trough Analysis)
In spite of the superb non-lagging pattern detection with the Zig Zag indicator, the Zig Zag indicator can suffer from false peak and trough. This is something every trader should understand before using ZigZag mode in the Peak Trough Analysis. False peak and trough is sometimes considered as repainting in the trading community. However, repainting is marginally different meaning from its actual behaviour in fact. The correct description for the false peak and false trough is the dynamic update.
False peak and trough is found because basic calculation unit is a peak and trough in the Zig Zag indicator. Since one peak or trough appears over undecided length of multiple candle bars, the dynamic update would affect the latest calculation of multiple candle bars. This dynamic update over multiple candle bar is the unique characteristic found in ZigZag indicator.
However, as you might see from my explanation, there is nothing wrong with it. For example, let us consider simple moving average indicator. In simple moving average indicator, the basic calculation unit is one candle bar. Hence, the latest value of moving average indicator will dynamically update on the arrival of new price. The latest value of moving average indicator will be undetermined until next new bar is formed (Figure 2-7). Likewise, in the ZigZag indicator, latest turning point would be undetermined until next turning point is formed (Figure 2-8). For example, latest peak might be extending until we find next new trough and latest trough might be extending until we find next new peak in our chart. What they do is that they are just updating its latest calculation unit when new information arrives in both indicators (Figure 2-7 and Figure 2-8). The difference is that dynamic update is happening over multiple candle bars in ZigZag indicator whereas it happens in one candle bar in moving average indicator. Hence, they are exactly doing their job as they are designed.
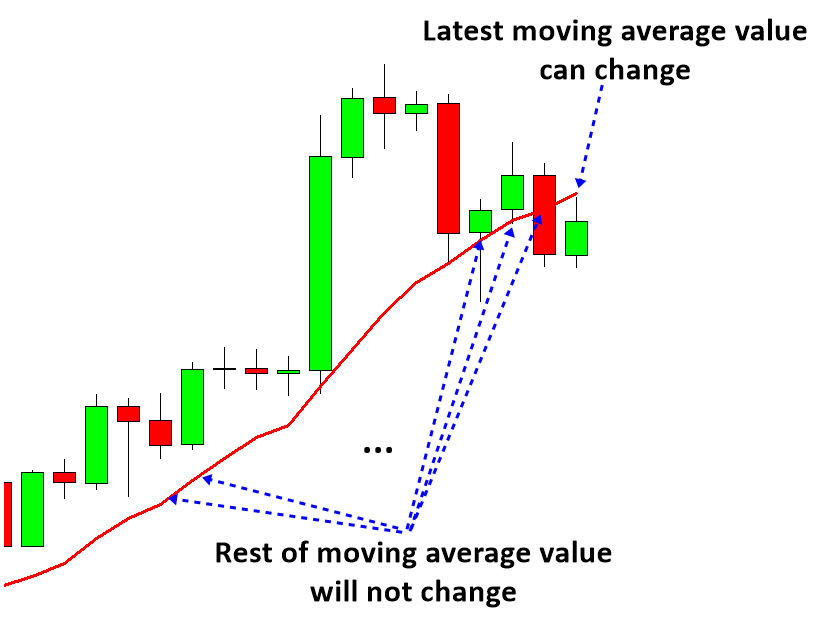
Figure 2-7: Dynamic update demonstration in moving average indicator
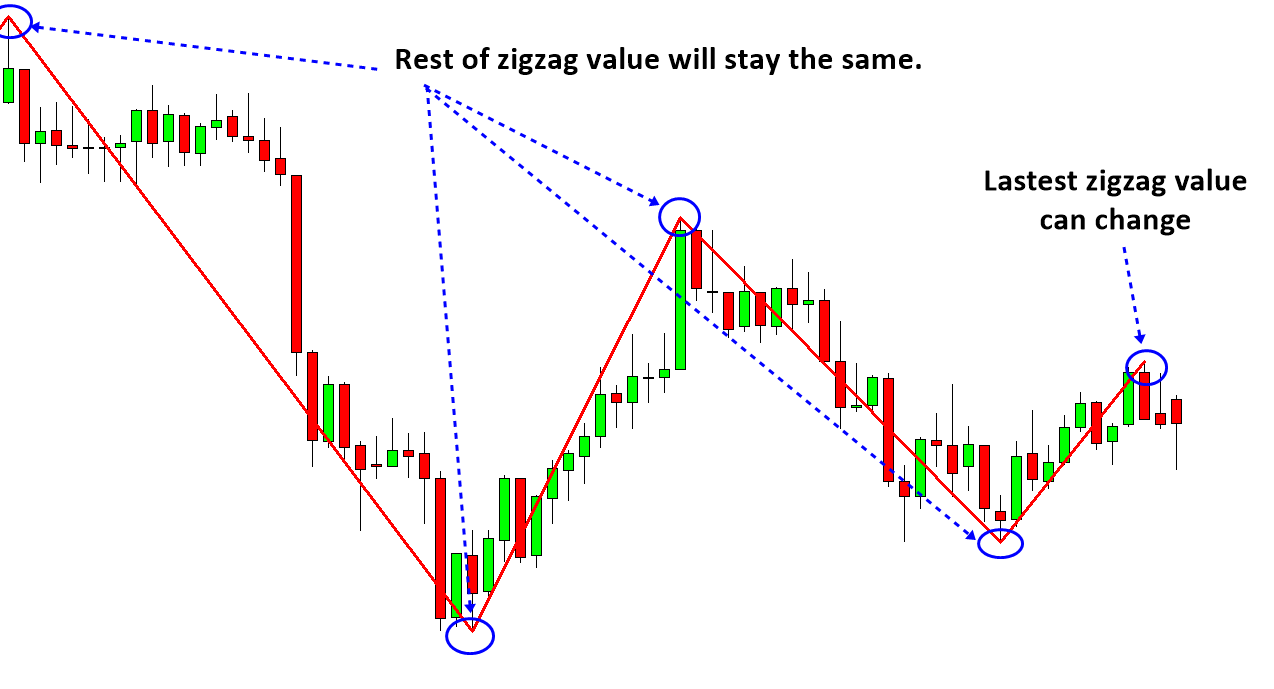
Figure 2-8: Dynamic update demonstration in Zig Zag Indicator
To illustrate this problem in more details, please consider Figure 2-9. After the trough 4 appears, the Zig Zag indicator will detect the false peak 4-A at 1.0602 level because the high of the 3rd candle bar is the highest peak after trough 4. As the price continue to move up, the Zig Zag indicator will keep overriding the false peak 4-A with the false peak 4-B and 4-B with 4-C later until the true peak 4 arrive at 1.0675 level. This would happen until we have a prospective trough after Peak 4. Until new prospective trough appears, ZigZag algorithm will dynamically update on the arrival of new high price on its latest peak. This dynamic update will affect the candle bars from previous turning point to latest turning point. For example, if there are 23 candle bars between previous trough and latest peak, then the dynamic update will override the ZigZag calculation over the 23 candle bars. If the price extends new high over 30 candle bars with new price arrival, then again the dynamic update will override the ZigZag calculation over the 30 candle bars. However, all the other ZigZag values behind the previous trough would remain the same. The dynamic update will not affect the previous calculation unit. Understanding this behaviour of ZigZag indicator is very important before we go on for the pattern detection with the Peak Trough Analysis Tool.
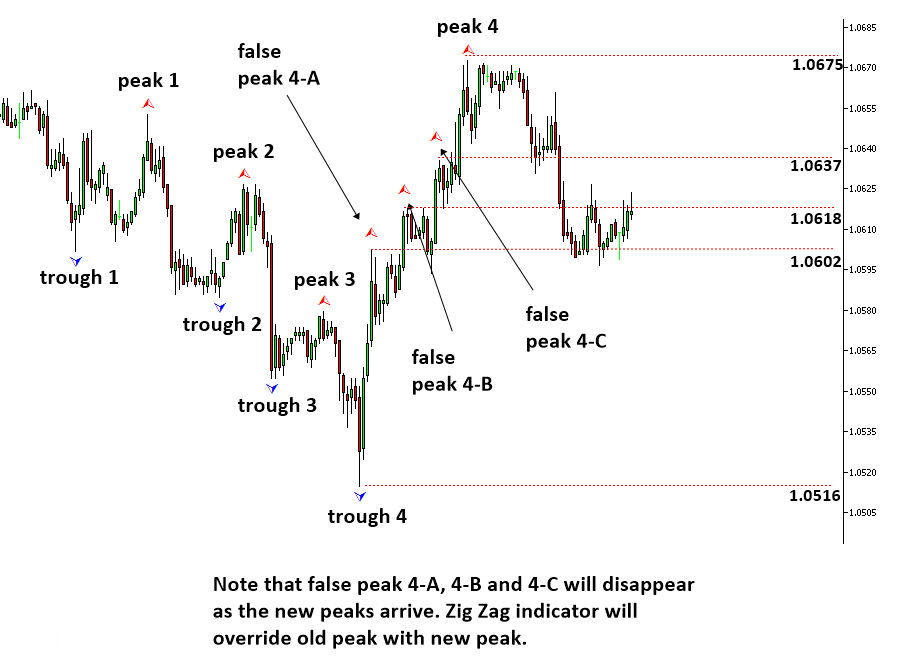
Figure 2-9: False peak demonstration for Zig Zag indicator on EURUSD exchange rate
False peak and trough problem is technically inevitable. False peak and trough problem is the trade off with the benefit of non-lagging turning point detection using ZigZag indicator. For this reason, all the automated scanner for Harmonic Pattern, Elliott Wave patterns and X3 pattern in the market are suffering from the same false peak and trough problem. People might call this as repainting. At least, we have clearly demonstrated the advantage and disadvantage of Peak Trough Analysis for the pattern detection. You should use the Peak Trough Analysis understanding these advantages and disadvantages.
About this Article
This article is the part taken from the draft version of the Book: Profitable Chart Patterns in Forex and Stock Market (Fibonacci Analysis, Harmonic Pattern, Elliott Wave, and X3 Chart Pattern). This article is only draft and it will be not updated to the completed version on the release of the book. However, this article will serve you to gather the important knowledge in financial trading. This article is also recommended to read before using Harmonic Pattern Plus, Harmonic Pattern Scenario Planner and Profitable Pattern Scanner, which is available for MetaTrader or Optimum Chart.
Below is the landing page for Harmonic Pattern Plus, Harmonic Pattern Scenario Planner and X3 Chart Pattern Scanner in MetaTrader. All these products are also available from www.mql5.com too.
https://algotrading-investment.com/portfolio-item/harmonic-pattern-plus/
https://algotrading-investment.com/portfolio-item/harmonic-pattern-scenario-planner/
https://algotrading-investment.com/portfolio-item/profitable-pattern-scanner/
Below is the landing page for Optimum Chart (Standalone Charting and Analytical Platform).
https://algotrading-investment.com/2019/07/23/optimum-chart/
Free Download Link for Peak Trough Analysis:
https://algotrading-investment.com/portfolio-item/peak-trough-analysis-tool/
Related Products


