Fibonacci Probability Graph
In the first chapter of this book, we have introduced three prediction equations. The good market prediction is the one that takes account for both statistical regularity and geometric regularity together. On top of that, if you can add surrounding knowledge around the market, this could be the most complete form of prediction. Surrounding knowledge around market is the information that describes the current market condition outside statistical and geometric regularity. This can include fundamental and political knowledge. The topic of fundamental and political knowledge is comprehensive. We will not cover them here. In this book, we will focus on the technical version of Geometric Prediction equation mostly. You can heavily resource the technical prediction taught in this book for your trading. However, you should never block yourself from the latest information source for the market news and fundamental data release in any case. Below is the three version of the geometric prediction equations.
- Geometric Prediction = size + ratio + surrounding knowledge around object where size and ratio is measured from geometric shape.
- Geometric Prediction (General version) = statistical regularity + geometric regularity + surrounding knowledge around object
- Geometric Prediction (Technical version) = statistical regularity + geometric regularity
Geometric market prediction requires recognizing statistical regularity and geometric regularity in chart. To aid your market prediction, it is possible to devise a tool. We can create the most intuitive tool by combining the functionality of Fibonacci retracement with probability. The idea is that probability will help us to recognize the statistical regularity whereas Fibonacci retracement will help us to recognize the geometric regularity. We can call this tool as Fibonacci Probability Graph.
In the devised Fibonacci Probability Graph, Y axis indicates the amplitude of fractal wave in price dimension and X axis indicates the wavelength of fractal wave in time dimension. In another words, Y axis indicates the turning point probability in price dimension and X axis indicates the turning point probability in time dimension.
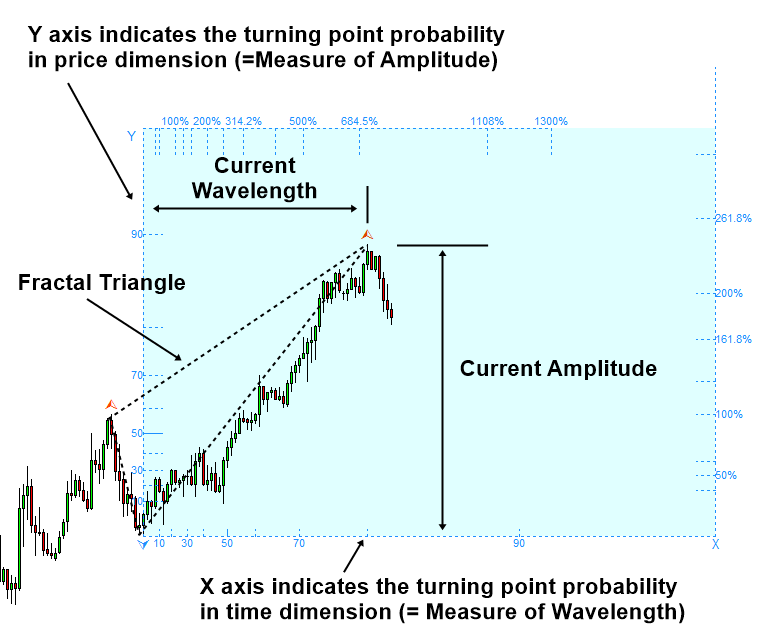
Figure 4.1-1: Fibonacci Probability Graph measuring probability for the peak
There are few things we need to understand about Y axis and X axis. Firstly, Y axis and X axis represent probability. By definition, probability is the measure of the likelihood that an event will occur. In our case, the event is actually the turning point, where fractal wave confirms its peak or trough. Hence, they are supposed to range between 0.0 (i.e. 0%) and 1.0 (i.e. 100%). Probability 0.0 indicates zero percent probability. Zero percent probability tells that the event will never happen. Probability 1.0 indicates one hundred percent probability. In 100% probability, the event must happen for sure. Typically, there is no practical application making use of 100% probability. In this world, many engineers and scientists believe that there is no perfect information. Since our calculation is based on empirical probability, we recommend using 90% probability as the maximum probability. It is better to leave some room to account for the discrepancy between empirical and theoretical probability.
To recognize the geometric regularity in chart, we can use Fibonacci retracement ratio. Top axis and right axis are respectively represent the Fibonacci retracement in time and price. The way it works is nearly identical to the classic Fibonacci ratio analysis. Even though you have no knowledge around fractal wave, you can use the top axis and right axis perfectly. What is even better, the Fibonacci Probability graph provides the additional information in time dimension.
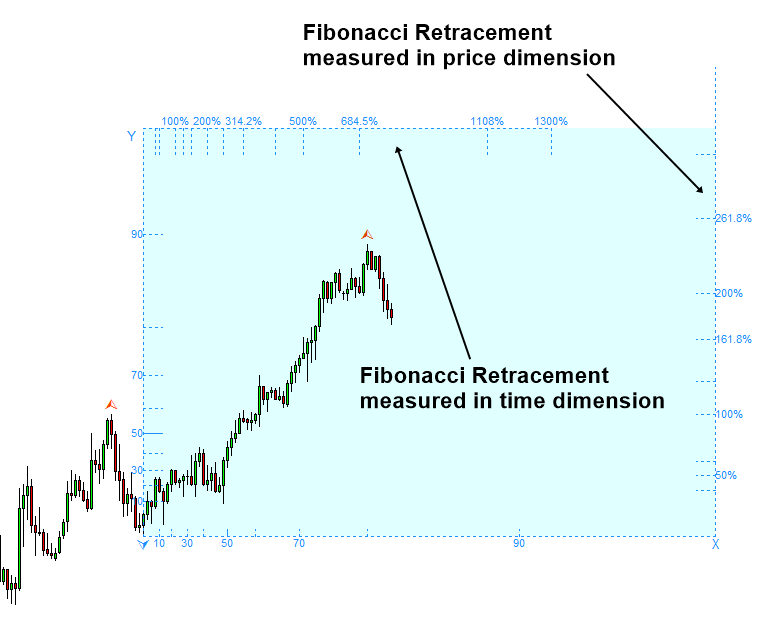
Figure 4.1-2: Fibonacci retracement measured in price and time dimension
Right axis provides the ratio of fractal wave measured in price dimension. The formula to calculate the ratio is like below:
Fibonacci Retracement Ratio in price = Right swing of fractal triangle (Y0) / Left swing of fractal triangle (Y1)
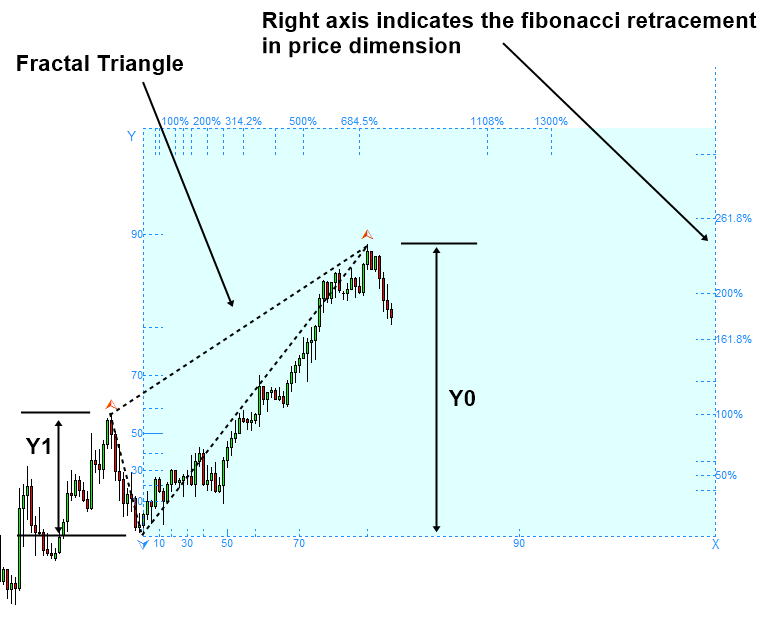
Figure 4.1-3: Fibonacci retracement measured in price dimension using the amplitude of peak
Likewise, the top axis provides the ratio of fractal wave measured in time dimension. We use the identical formula to calculate the ratio as below:
Fibonacci Retracement Ratio in time = Right swing of fractal triangle (X0) / Left swing of fractal triangle (X1)
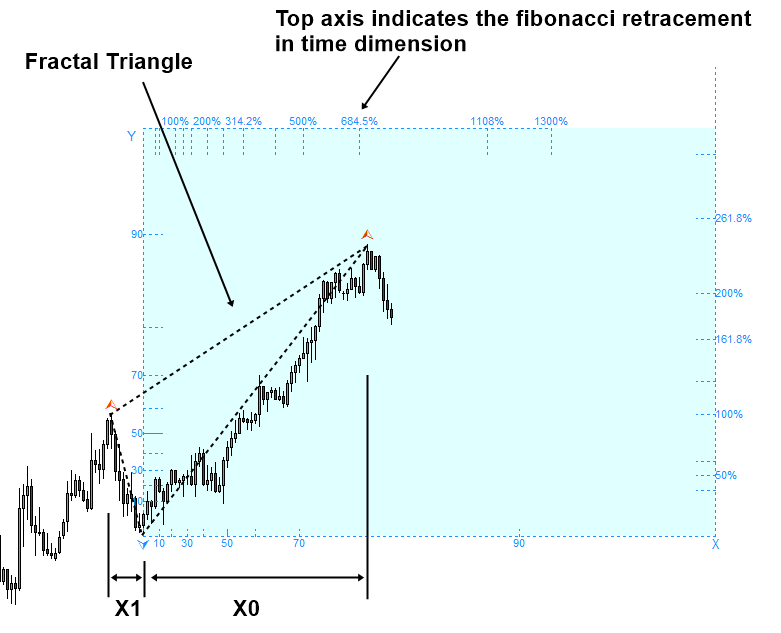
Figure 4.1-4: Fibonacci retracement measured in time dimension using the wavelength of peak
The Fibonacci retracement formula we used to create top axis and right axis are the identical formula used in detecting Fibonacci price pattern. What is changed is that we added the Fibonacci retracement ratio in time dimension. There is no literature mentioning Fibonacci retracement ratio in time dimension. However, stochastic cycles consist of wavelength and the amplitude like other cycles. Hence, Fibonacci retracement ratio in time dimension is necessary to determine the possible wavelength in the current fractal wave. Fibonacci retracement is one way of detecting geometric regularity in price chart. In addition, we will introduce several other approaches of detecting geometric regularity like support, resistance, harmonic pattern, Elliott wave pattern, and wedge patterns in the later chapter.
More Tips about Fibonacci Probability Graph
Fibonacci Probability Graph is a tool used in forex trading to assess the probability of price reaching certain levels based on Fibonacci retracement levels. It helps traders identify potential support and resistance levels, as well as gauge the likelihood of price movements based on historical Fibonacci retracement levels. Here’s how it works:
Fibonacci Retracement Levels:
- Definition: Fibonacci retracement levels are horizontal lines drawn on a price chart at key Fibonacci ratios (typically 23.6%, 38.2%, 50%, 61.8%, and 78.6%). These levels are derived from the Fibonacci sequence and are believed to represent potential areas of support or resistance where price may reverse or consolidate.
Fibonacci Probability Graph:
- Construction: The Fibonacci Probability Graph is constructed by plotting the Fibonacci retracement levels on a graph, typically on the horizontal axis, representing price levels, and the vertical axis, representing the probability of price reaching those levels.
- Probability Calculation: The probability of price reaching a specific Fibonacci retracement level is calculated based on historical price movements and the frequency with which price has interacted with those levels in the past. Traders may use statistical methods or historical data analysis to determine these probabilities.
- Visualization: The Fibonacci Probability Graph visualizes the likelihood of price reaching various Fibonacci retracement levels, with higher probabilities represented by taller bars or larger areas on the graph. Traders can quickly assess which levels have a higher probability of acting as support or resistance based on the graph.
Application in Forex Trading:
- Support and Resistance: Traders use the Fibonacci Probability Graph to identify potential support and resistance levels based on Fibonacci retracement levels. Higher probabilities indicate stronger support or resistance levels where price may react or reverse.
- Trade Planning: The Fibonacci Probability Graph helps traders plan their trades by identifying key levels where price is likely to react. Traders may use these levels to set entry, exit, and stop-loss orders, as well as to gauge the potential risk and reward of a trade.
- Confirmation: Traders often use the Fibonacci Probability Graph in conjunction with other technical analysis tools, such as candlestick patterns, trendlines, or momentum indicators, to confirm potential trading opportunities. Confirmation from multiple sources increases the likelihood of a successful trade.
- Risk Management: Effective risk management is essential when trading based on Fibonacci retracement levels and probability graphs. Traders should always consider the potential risk-reward ratio before entering a trade and use stop-loss orders to mitigate losses if the market moves against their position.
The Fibonacci Probability Graph is a valuable tool in forex trading for assessing potential support and resistance levels and gauging the likelihood of price movements based on historical Fibonacci retracement levels. Traders use it to make more informed trading decisions and improve their overall trading strategies.
About this Article
This article is the part taken from the draft version of the Book: Predicting Forex and Stock Market with Fractal Pattern. This article is only draft and it will be not updated to the completed version on the release of the book. However, this article will serve you to gather the important knowledge in financial trading. This article is also recommended to read before using Fractal Pattern Scanner, which is available for MetaTrader or Optimum Chart.
Below is the landing page for Fractal Pattern Scanner for MetaTrader 4 and MetaTrader 5. The same products are available on www.mql5.com too.
https://www.mql5.com/en/market/product/49170
https://www.mql5.com/en/market/product/49169
https://algotrading-investment.com/portfolio-item/fractal-pattern-scanner/
Below is the landing page for Optimum Chart
https://algotrading-investment.com/2019/07/23/optimum-chart/
Related Products


