Predicting Volatility with Turning Point Probability
One important advantage of using turning point probability in financial market is that we can also predict the volatility of the price movement. This is useful when we need to decide our stop loss and take profit targets in our trading.
We can consider three different cases. Firstly, we can expect neutral market sentiment, where sell and buy pressure is nearly equal. Secondly, we can expect the market with bullish sentiment, where often amplitude of bearish movement could be smaller than the amplitude of bullish movement. Thirdly, we can expect the market with bearish sentiment, where often amplitude of bullish movement could be smaller than the amplitude of bearish movement. Any of these three cases can happen when we make either buy or sell entry. Hence, we will analyse these three different cases respectively for buy and sell entry.
Let us start with the case when we make the buy entry. When we try to make buy entry, the market could be surrounded with neutral sentiment. In this case, the sensible profit target could be the mean amplitude. In theory, mean amplitude is the price movement, at which we have 50% turning point probability. If you believe the neutral sentiment after your buy entry, then it is good to limit your take profit target around the mean amplitude. You can measure the amplitude from Fibonacci Probability Graph as shown in Figure 4.3-1.
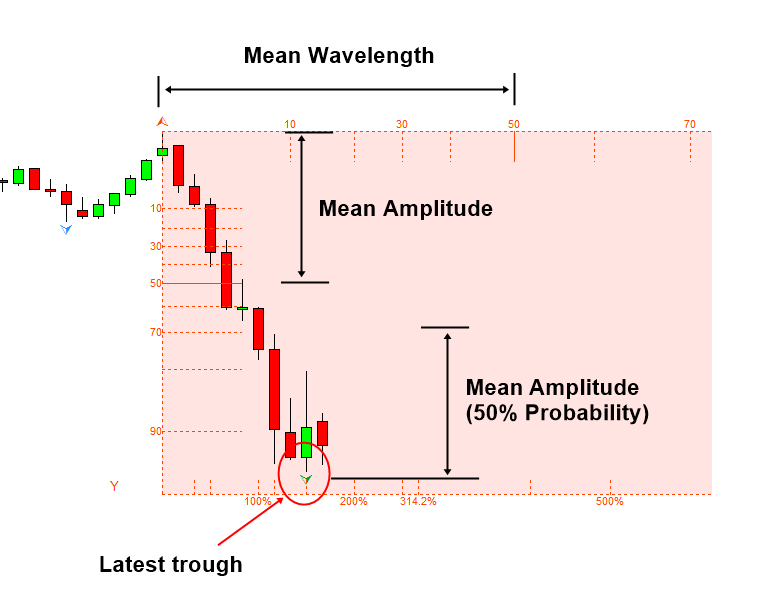
Figure 4.3-1: Measuring mean amplitude and wavelength for the case of trough
When you are trying to make buy entry during the strong bearish market sentiment, it is possible that we can encounter the shortage of buy pressure even after the turning point. You should avoid making buy entry in this case most of time. However, there are the different trading styles like scalping and high frequency trading. Some of these trading strategies are only looking for extremely short-term profit. If you do not mind the short term trading, then the sensible choice for your take profit target would be the amplitude with 20 or 30% probability (Figure 4.3-2). Even one could target 10% amplitude if he knows what he is doing.
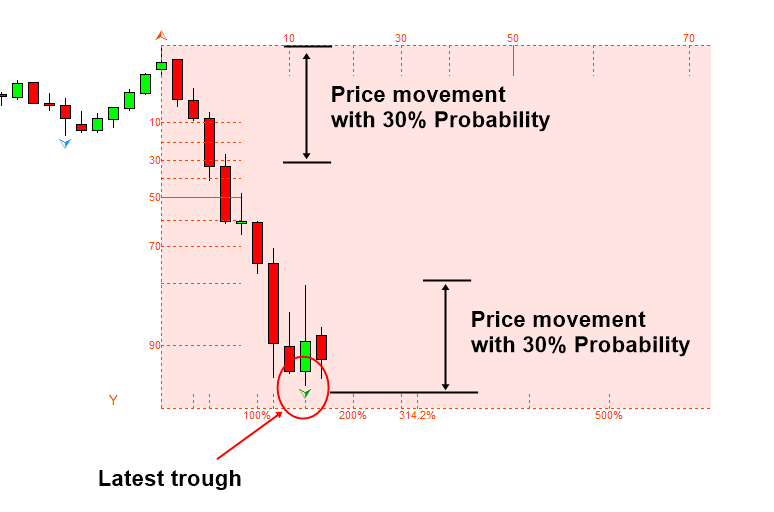
Figure 4.3-2: Measuring the amplitude and wavelength at 30% probability for the case of trough
When you are trying to make buy entry during the strong bullish market sentiment, the bullish market sentiment could add extra momentum for upward price movement. This would be our most favourite buy entry. In that case, we can use 70 or 80% amplitude as our take profit target. If you believe the bullish market sentiment is too strong, then you can go even higher. Once again, you can take the size of profit target from Fibonacci Probability Graph as shown in Figure 4.3-3.
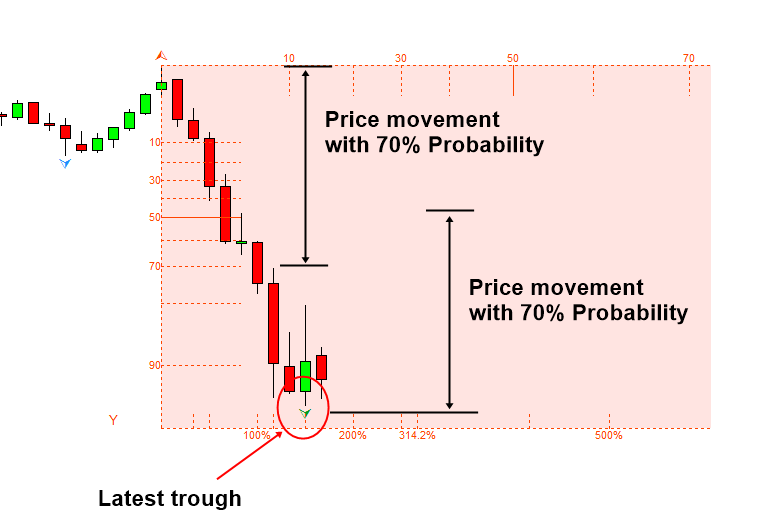
Figure 4.3-3: Measuring the amplitude and wavelength at 70% probability for the case of trough
The different market sentiments can affect our sell entry too. It is better if you can trade with different tactics per the case. For example, if we are taking the sell entry during the neutral market sentiment, the sensible target for your sell entry could be the mean amplitude. In theory, mean amplitude is the price movement, at which we have 50% turning point probability. If you anticipate neutral market sentiment after your sell entry, then it is good to limit our take profit target around the mean amplitude as shown in Figure 4.3-4.
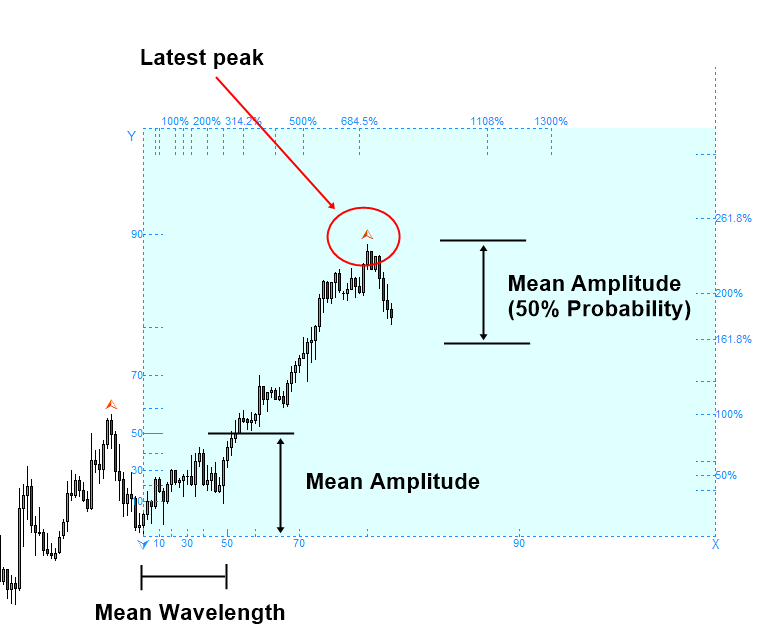
Figure 4.3-4: Measuring the mean amplitude and wavelength for the case of peak
When you are trying to make sell entry during the strong bullish market sentiment, it is possible that we can encounter the shortage of sell pressure even after the turning point. You should avoid making sell entry in this case most of time. However, there are the different trading styles like scalping and high frequency trading. Some of these trading strategies are only looking for extremely short-term profit. If you do not mind the short term trading, then the sensible choice for your take profit target would be the amplitude with 20 or 30% probability (Figure 4.3-5). Even one could target 10% amplitude if he knows what he is doing.
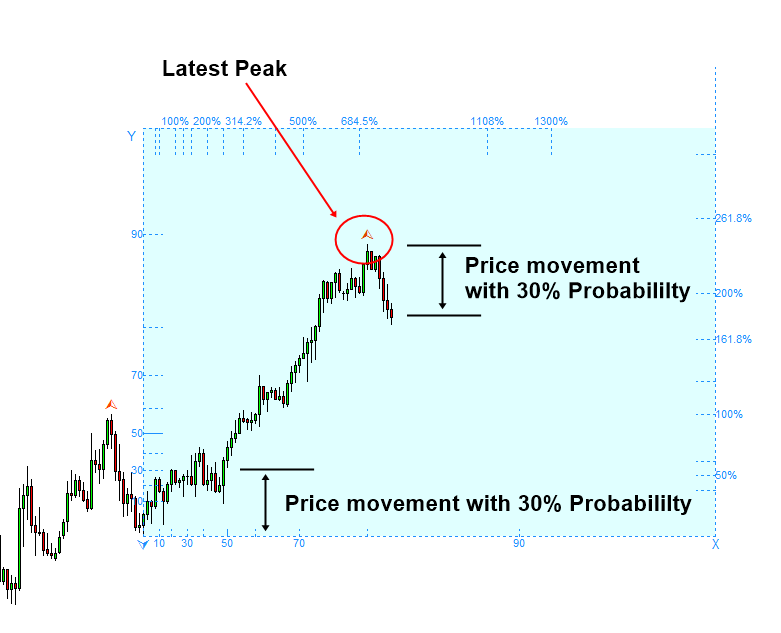
Figure 4.3-5: Measuring the amplitude and wavelength at 30% probability for the case of peak
When you are trying to make sell entry during the bearish market sentiment, the bearish market sentiment could add momentum for further sell movement. This would be our most favourite sell entry. In that case, we can use 70 or 80% amplitude as our take profit target (Figure 4.3-6). If you believe the bearish market sentiment is too strong, then you can go even higher.
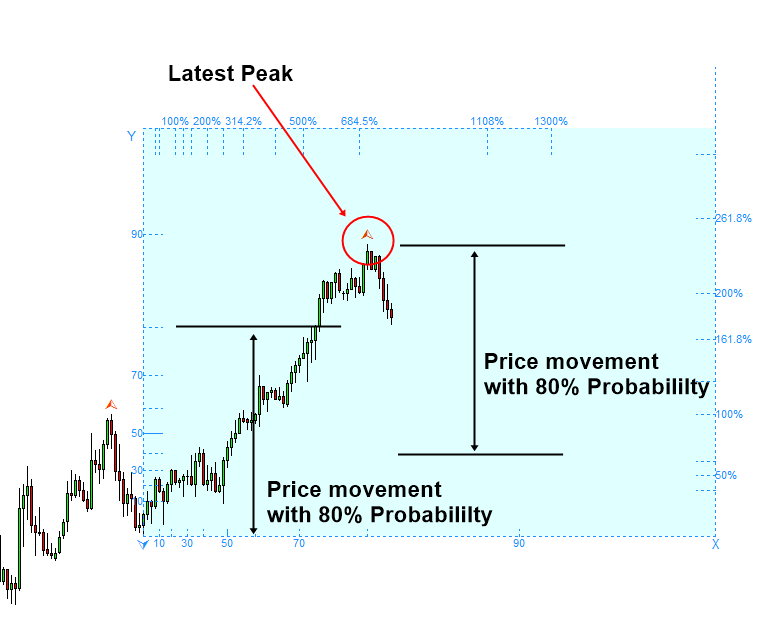
Figure 4.3-6: Measuring the amplitude and wavelength at 80% probability for the case of peak
In summary, you can always make use of Fibonacci Probability Graph to gauge the sensible take profit target. In addition, you could also set your stop loss target to meet the desired Reward to Risk ratio. Since you know the take profit target, you can adjust your stop loss level accordingly to your preferred Reward to Risk ratio. In many cases, you want to use some sensible support and resistance as your stop loss target. Even in this case, it is still wise to check how wide this stop loss target is using the Fibonacci Probability Graph.
Some More Tips about Predicting volatility using turning point probability
Predicting volatility using turning point probability involves assessing the likelihood of significant changes in price movements or fluctuations in the market. Volatility is a measure of the degree of variation in a trading price series over time and is often characterized by periods of high and low volatility. Here’s how turning point probability can be applied to predict volatility:
- Identifying Key Levels: Traders often focus on key support and resistance levels, trendlines, or chart patterns where turning points are likely to occur. These levels may act as barriers to price movement and can signal potential changes in volatility.
- Volatility Indicators: Various technical indicators can help traders gauge market volatility and anticipate potential turning points. Volatility indicators such as Bollinger Bands, Average True Range (ATR), or the Volatility Index (VIX) can provide insights into the magnitude of price fluctuations and help identify periods of high or low volatility.
- Market Sentiment Analysis: Market sentiment plays a crucial role in determining volatility. Traders often monitor investor sentiment indicators, such as the put/call ratio, sentiment surveys, or news sentiment analysis, to assess market sentiment and anticipate potential shifts in volatility.
- Event Risk: Events such as economic data releases, earnings announcements, central bank meetings, or geopolitical developments can trigger significant volatility in the market. Traders assess the potential impact of these events on market sentiment and volatility levels to anticipate turning points and adjust their trading strategies accordingly.
- Option Market Analysis: Option markets provide valuable insights into market expectations of future volatility. Traders analyze option pricing, implied volatility levels, and option skew to assess market sentiment and anticipate potential turning points in volatility.
- Pattern Recognition: Certain chart patterns or formations may precede changes in volatility. For example, contraction patterns such as triangles or pennants often precede periods of low volatility, while expansion patterns such as breakouts or gaps may signal increased volatility ahead.
- Seasonality and Cycle Analysis: Seasonal patterns or cyclical trends in market volatility can help traders anticipate turning points. Traders analyze historical data to identify recurring patterns or cycles in volatility and adjust their trading strategies accordingly.
- Correlation Analysis: Traders analyze correlations between different assets or markets to identify potential turning points in volatility. For example, correlations between currency pairs, equity indices, or commodities can provide insights into broader market sentiment and potential shifts in volatility.
While predicting volatility using turning point probability can provide valuable insights for traders, it’s essential to recognize that volatility forecasting is inherently uncertain and subject to various factors. Traders should use a combination of technical analysis, fundamental analysis, and risk management techniques to assess volatility and make informed trading decisions. Additionally, thorough backtesting and practice are essential to validate the effectiveness of volatility prediction strategies.
About this Article
This article is the part taken from the draft version of the Book: Predicting Forex and Stock Market with Fractal Pattern. This article is only draft and it will be not updated to the completed version on the release of the book. However, this article will serve you to gather the important knowledge in financial trading. This article is also recommended to read before using Fractal Pattern Scanner, which is available for MetaTrader or Optimum Chart.
Below is the landing page for Fractal Pattern Scanner for MetaTrader 4 and MetaTrader 5. The same products are available on www.mql5.com too.
https://www.mql5.com/en/market/product/49170
https://www.mql5.com/en/market/product/49169
https://algotrading-investment.com/portfolio-item/fractal-pattern-scanner/
Below is the landing page for Optimum Chart
https://algotrading-investment.com/2019/07/23/optimum-chart/
Related Products


