Support and Resistance Trading with Turning Point Probability
In this chapter, we will show you how to combine statistical regularity and geometric regularity to trade with the most popular trading technique, the support and resistance. In the support and resistance, the geometric regularity is recognized when several peaks (or troughs) are aligned within one straight line. Especially, when three or more peaks (or troughs) are hitting the path of one straight line, it is hard to take this as the random event. When we add the statistical regularity in our decision-making process, we can even reduce the uncertainty further. Hence, we can improve our accuracy.
There are two different cases for our trading. Firstly, we can pick up the continuation pattern for trading. In the continuation pattern, we trade in the same direction of the slope of geometric support and resistance line. Continuation pattern is useful when we anticipate the continued momentum in the current trend direction. Secondly, we can try to pick up the reversal pattern. In the reversal pattern, we trade in the opposite direction of the slope of the geometric support and resistance line. Reversal pattern is useful when we believe that current market trend stayed for the prolonged period and new trend should be born in the opposite direction.
We have gathered some example of continuation pattern in Figure 4.4-1 and Figure 4.4-2. In the continuation pattern, we are trying to trade in the direction of the current trend. The trend can be confirmed with the slope of the support line. We need at least three points to confirm the support line. Three points is the absolute minimum to spot the geometric regularity. Actual trading can be taken after price complete the last point of the support line. Before entry, we need to see that price is moving in our anticipated direction. Hence, it is good to set some threshold price level to trigger around the support line. This is about geometric regularity part. To ensure the statistical regularity, we can exam Fibonacci Probability Graph as well as the joint probability matrix. In this example, we use the Fractal Cycle Analysis with two cycles. Hence, we will have the joint probability matrix with 2 rows x 2 columns.
Measured probability in Figure 4.4-1 in fact is not high. This is typical for the continuation pattern. Once trend is established, there is a tendency for the weak count trend (i.e. weak correction). Hence, the size of amplitude and wavelength can be relatively small in the case of the continuation pattern. Having said that, we still recommend seeing at least 50% of turning point probability in price or timing dimension. We took less probability in Figure 4.4-1 because the last point coincided with the 61.8% Fibonacci retracement in price. This provides the extra tick in the geometric regularity check-up. Typically, it is even better if we see at least 50% probability between small and large cycles. Higher the probability, it is safer to trade.
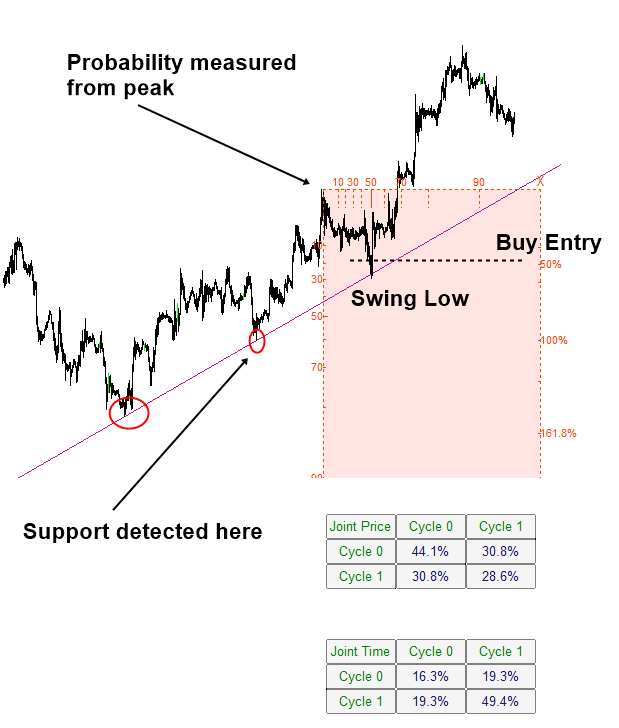
Figure 4.4-1: Buy example of continuation pattern with geometric support on EURUSD H1 Chart
When you set the threshold price level to trigger around the support line, you can consider three different choices. We list the three choices in priority orders.
Firstly, you can use a sensible peak or trough around the support and resistance line. In this case, the peak or trough should be present near your trading entry. Secondly, you can use the sensible Fibonacci retracement in the left axis of Fibonacci probability graph. Thirdly, you can use the probability in the right axis of Fibonacci probability graph when either first or second choice is not available. Overall, the one of the important criteria to consider is to allow good spacing from the support and resistance level to your entry. If the spacing is too narrow, then you might be suffering from false breakout at the threshold level. If spacing is too wide, then you get the smaller Reward to Risk ratio. Although we have put the choice 3 to the bottom of the list, choice 3 might be useful to double check your spacing for the first choice and second choice. For this, you can refer to the previous chapter demonstrating how to measure the volatility of price using probability in the left axis of Fibonacci probability graph.
In Figure 4.4-1, the threshold price level was set to the 50% Fibonacci retracement in the right axis because there is no peak or trough near the trading entry. However, if first choice and second choice are not available, then you can set the threshold trigger level from left axis of Fibonacci retracement. For example, in Figure 4.4-2, the threshold price level was set at 40% probability in the left axis.
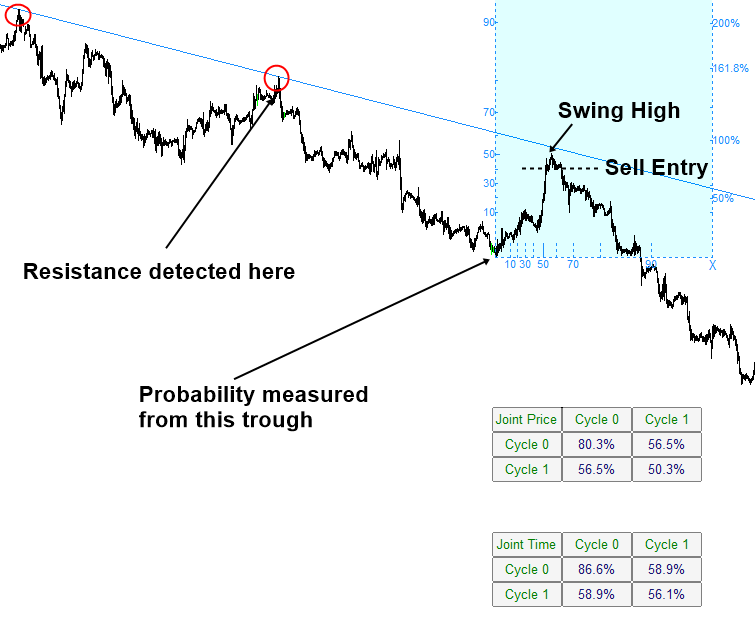
Figure 4.4-2: Sell example of continuation pattern with geometric resistance on EURUSD H1 Chart
Figure 4.4-3 and Figure 4.4-4 shows the reversal pattern examples. In the reversal pattern trading, we are trading against the latest trend direction. Hence, we use the different criteria for reversal pattern trading from continuation pattern trading. Some people might find easier to trade with the continuation pattern in Figure 4.4-1 and Figure 4.4-2. Trading with reversal pattern is useful at picking up the global turning point in the market. This often provides us extremely favourable Reward to Risk ratio, sometimes over 10. Hence, trading with the reversal pattern is also popular among the traders. However, this definitely requires more skills than trading with continuation pattern.
In the continuation pattern, we have set the three points as the absolute minimum to draw support and resistance. In the case of reversal pattern, we recommend to raise bar because we will be trading against the current trend. For example, we recommend using minimum four points as the bottom line. We also recommend seeing at least 90% probability either in price or in time dimension. For the case of reversal pattern, try to use the criteria that are more conservative. You can tell that the probabilities in the joint probability matrix are marginally different from the case of continuation pattern in Figure 4.4-1 and Figure 4.4-2.
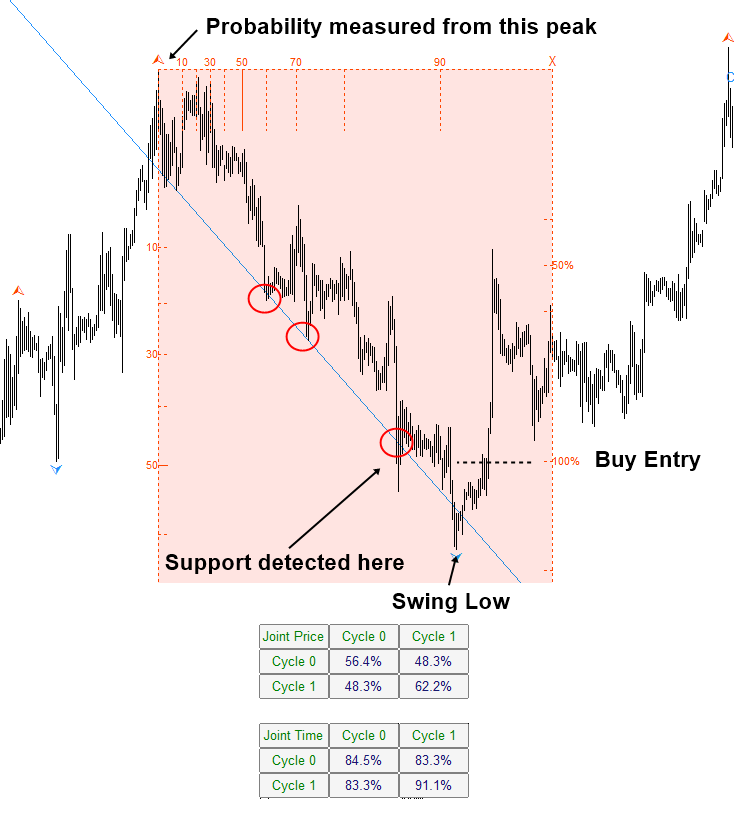
Figure 4.4-3: Buy example of reversal pattern with geometric resistance on GBPUSD H1 Chart
In terms of setting up the threshold price level to trigger your trading is not different from the continuation pattern. You can use one of the following three criteria to ensure good spacing from entry to the support or resistance.
- Choice 1: you can use a sensible peak or trough around the support and resistance line.
- Choice 2: you can use the sensible Fibonacci retracement in the left axis of Fibonacci probability graph.
- Choice 3: you can use the probability in the right axis of Fibonacci probability graph when either first or second choice is not available.
In Figure 4.4-3, we used 100% Fibonacci retracement level to allow some good spacing between support and the threshold level (i.e. Choice 2). In Figure 4.4-4, we used the peak near the resistance to set threshold because the peak provided the sensible spacing.
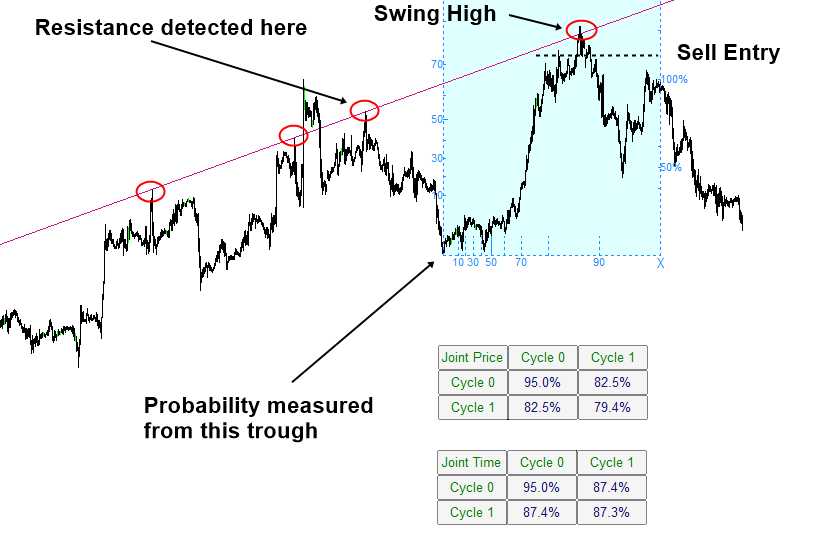
Figure 4.4-4: Sell example of reversal pattern with geometric resistance on EURUSD H1 Chart
More Tips about Support and Resistance
Here are some more tips about support and resistance in terms of the turning point probability. Support and resistance trading is one approach in technical analysis, focusing on key levels where the price tends to react or reverse. These levels are formed based on historical price data and represent areas where buying or selling pressure has been significant in the past. When it comes to turning point probability in support and resistance trading, several factors influence the likelihood of a reversal or continuation:
- Price History: Support and resistance levels are derived from historical price data, such as previous swing highs and lows, significant peaks and troughs, or key psychological levels. The more times a price level has acted as support or resistance in the past, the stronger it tends to be, increasing the probability of a turning point.
- Volume Analysis: Volume analysis is crucial in confirming support and resistance levels. An increase in trading volume near these levels suggests heightened market activity and can strengthen the probability of a turning point. Conversely, low volume near support or resistance may indicate weak conviction and decrease the probability of a reversal.
- Price Action Confirmation: Traders often look for additional confirmation from price action when trading support and resistance levels. This includes factors such as bullish or bearish candlestick patterns, trendline breaks, or divergence/convergence in momentum indicators. Confirmation from price action increases the probability of a successful turning point.
- Trend Analysis: The direction of the prevailing trend can influence the probability of a turning point at support and resistance levels. In an uptrend, traders may anticipate bounces or reversals at support levels, while in a downtrend, resistance levels may act as potential turning points. Trend analysis helps traders identify the most relevant support and resistance levels to focus on.
- Timeframe Analysis: Support and resistance levels can vary across different timeframes, from intraday to daily or weekly charts. The probability of a turning point may vary depending on the timeframe, with levels on higher timeframes often considered more significant. Traders should consider multiple timeframes to assess the overall market context and increase the probability of successful trades.
- Market Sentiment and News: External factors such as market sentiment, economic data releases, or geopolitical events can influence the probability of a turning point at support and resistance levels. Traders should stay informed about relevant news and events that could impact price movements and adjust their trading strategies accordingly.
- Risk Management: Effective risk management is essential when trading support and resistance levels. Traders should always consider the potential risk-reward ratio before entering a trade and use stop-loss orders to mitigate losses if the market moves against their position.
While support and resistance trading can provide valuable insights into potential turning points in the market, they are not guaranteed to hold indefinitely. Traders should use them in conjunction with other technical analysis tools and exercise caution when interpreting signals. Additionally, thorough backtesting and practice are essential to validate the effectiveness of support and resistance trading strategies.
About this Article
This article is the part taken from the draft version of the Book: Predicting Forex and Stock Market with Fractal Pattern. This article is only draft and it will be not updated to the completed version on the release of the book. However, this article will serve you to gather the important knowledge in financial trading. This article is also recommended to read before using Fractal Pattern Scanner, which is available for MetaTrader or Optimum Chart.
Below is the landing page for Fractal Pattern Scanner for MetaTrader 4 and MetaTrader 5. The same products are available on www.mql5.com too.
https://www.mql5.com/en/market/product/49170
https://www.mql5.com/en/market/product/49169
https://algotrading-investment.com/portfolio-item/fractal-pattern-scanner/
Below is the landing page for Optimum Chart
https://algotrading-investment.com/2019/07/23/optimum-chart/
Related Products


