Harmonic Pattern Trading with Turning Point Probability
In this chapter, we will show you how to combine statistical regularity and geometric regularity to trade with Harmonic patterns. In Harmonic Pattern trading, the geometric regularity is recognized with the ratio when several neighbouring fractal triangles are form the certain structure. Once, geometric regularity is recognized by detecting Harmonic Pattern, we detect the statistical regularity with Fibonacci Probability graph to reduce the uncertainty further. Hence, we can improve our accuracy for our trading.
As in the support and resistance, we can consider continuation pattern and reversal pattern for harmonic pattern trading. In continuation pattern, we try to find the harmonic pattern giving us the trading entry in the current trend direction. As you might expect, in the case of continuation pattern, the counter trend movement (i.e. correction) is weak. This will result in the small probability in the joint probability matrix. Hence, we have less conservative criteria in choosing our entry. For example, we will consider the probability 50% as the minimum cut for the continuation pattern.
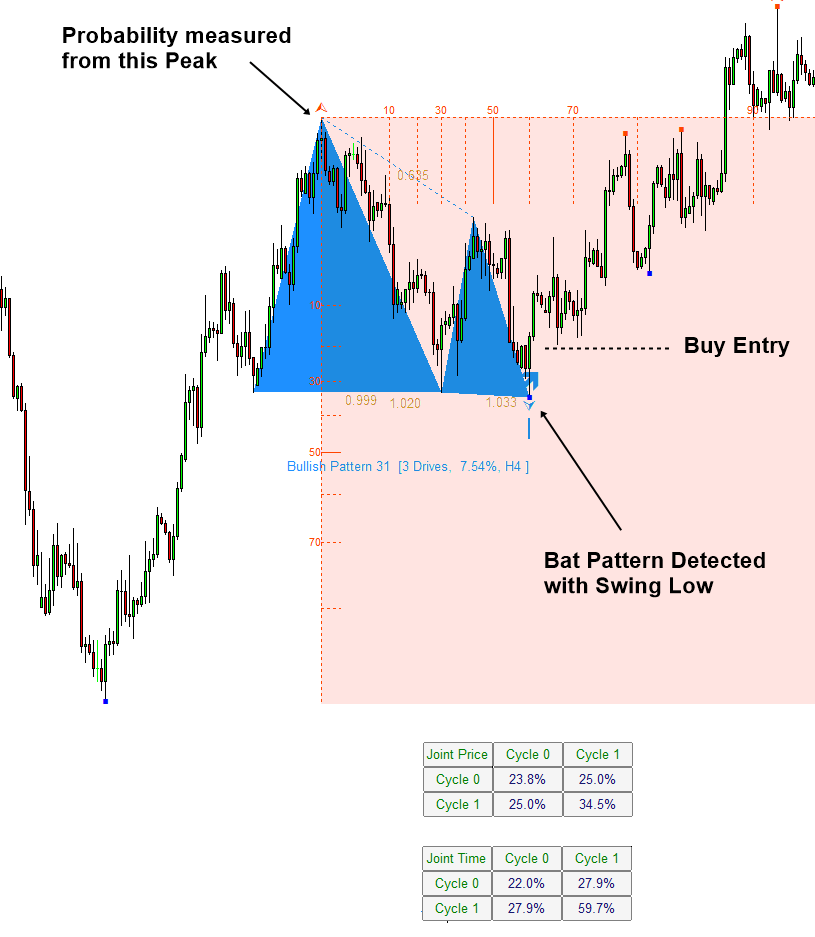
Figure 4.5-1: Buy example of continuation pattern with turning point probability on EURUSD H4
For harmonic pattern trading, we need to have some threshold price level too to trigger our entry. We have more choice on the threshold price level than the case of support and resistance. For example, in the book “Guide to Precision Harmonic Pattern Trading”, we have describe several different approach trading with harmonic patterns. If you have read the part of the book explaining the Pattern Completion Interval and Potential Continuation Zone, then it is fine to use them. At the same time, it is fine to apply the same criteria as in the support and resistance as long as you understand following two points. Firstly, we need the good spacing between the trigger level and the final point D. Secondly, we need the good Reward to Risk ratio for our trading. As long as you understand these two points, you can choose the most sensible method among them. In this book, we provide the examples using one of these three choices.
- Choice 1: you can use a sensible peak or trough around the support and resistance line.
- Choice 2: you can use the sensible Fibonacci retracement in the left axis of Fibonacci probability graph.
- Choice 3: you can use the probability in the right axis of Fibonacci probability graph when either first or second choice is not available.
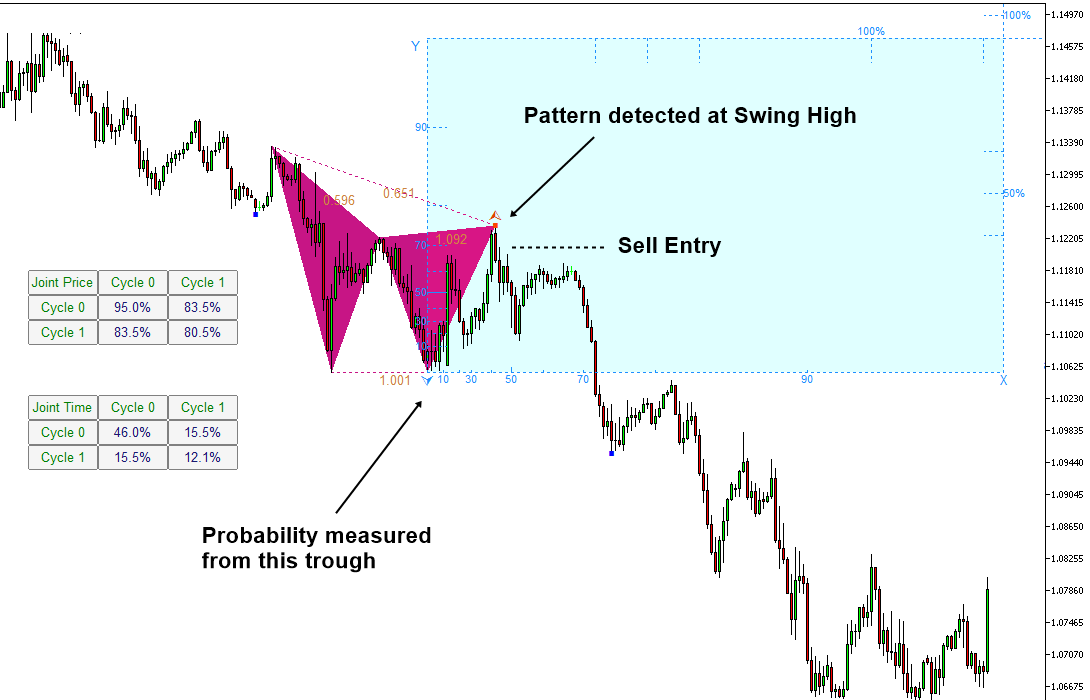
Figure 4.5-2: Sell example of continuation pattern with turning point probability on EURUSD H1
With Harmonic Pattern, it is possible to trade with reversal pattern. In reversal pattern, we are trading against current trend. Reversal pattern is particularly helpful in picking up the global turning point, where Reward is much higher than Risk. At the same time, we require more skills for trading with reversal pattern. Especially, we recommend applying conservative criterial in our statistical regularity. Over 90% probability is preferred in reversal pattern trading. For example in Figure 4.5-3, we have confirmed AB=CD pattern with 91.1% probability in Large Cycle in time dimension. Joint probability is also high at 83.4%. With higher probability, we can ensure the safety of our trading in the case of reversal pattern.
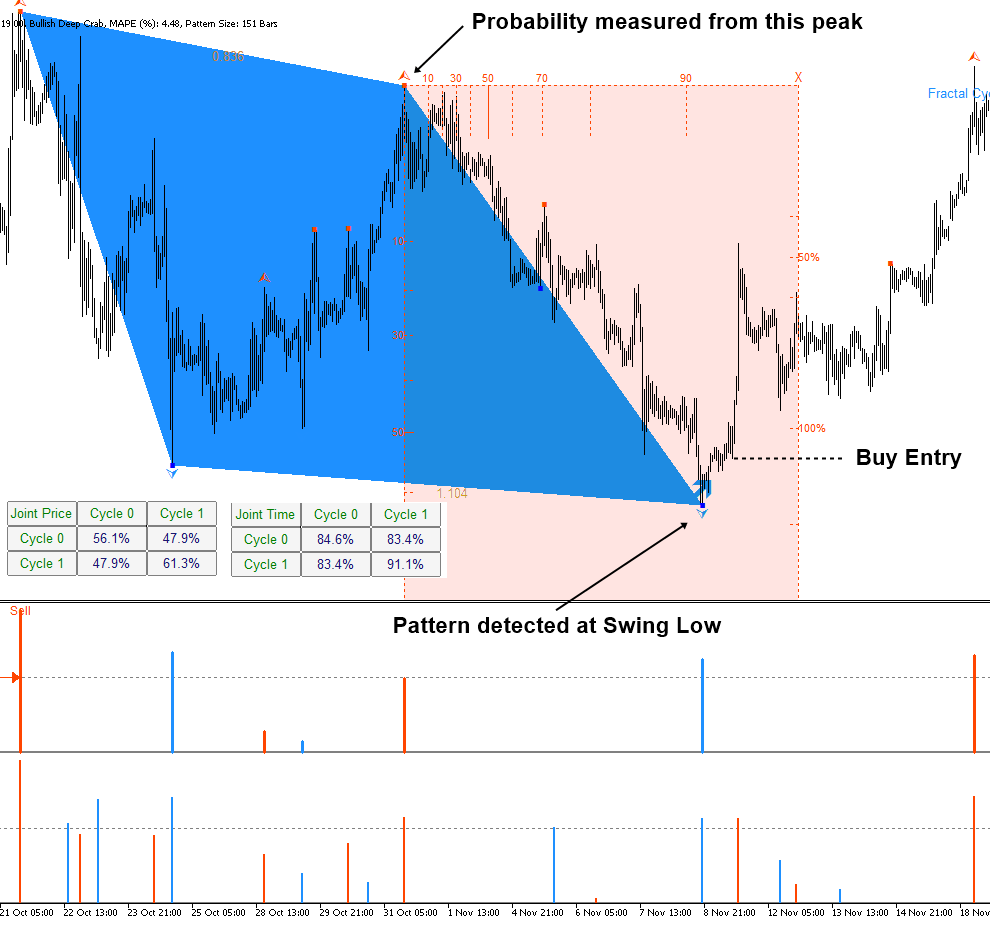
Figure 4.5-3: Buy example of reversal pattern with turning point probability on GBPUSD H1
In Figure 4.5-4, we have also high probability of 91.1% in time dimension. Although it was for small cycle, the probability in price dimension is also high at 88.5%. Confirmation of high probability in time and price dimension provides us more safety in our trading.
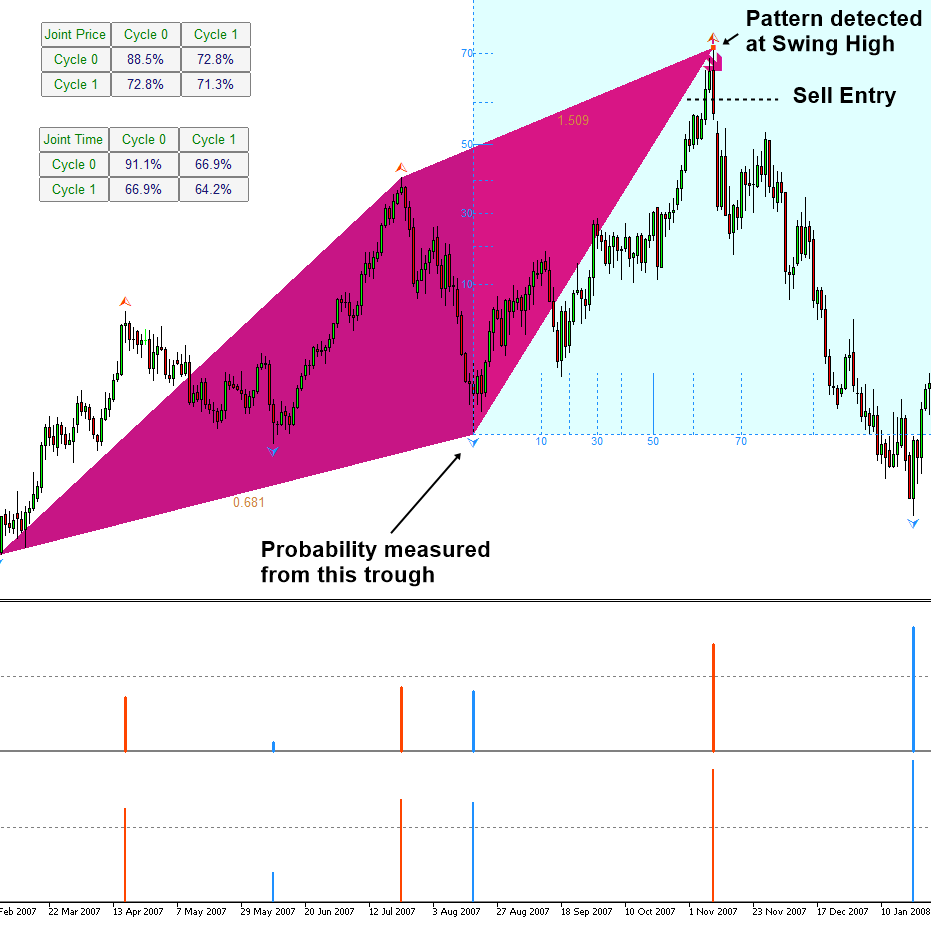
Figure 4.5-4: Sell example of reversal pattern with turning point probability on GBPUSD D1
More Tips about Harmonic Pattern Trading
Here are some more points about Harmonic Pattern Trading in terms of the turning point probability. Harmonic pattern trading involves identifying specific price patterns on a chart that exhibit Fibonacci-based ratios and geometry. These patterns are believed to repeat themselves in the market and can signal potential turning points or continuation of trends. When it comes to turning point probability in harmonic pattern trading, several factors influence the likelihood of a reversal or continuation:
- Pattern Completeness: The probability of a turning point increases when a harmonic pattern is complete. Traders look for specific criteria to be met, such as precise Fibonacci retracement and extension levels, to confirm the pattern’s validity.
- Confluence of Ratios: Harmonic patterns often involve multiple Fibonacci ratios aligning at key points within the pattern. The presence of multiple ratios increases the probability of a turning point, as it suggests stronger market confluence at those levels.
- Symmetry and Proportion: Harmonic patterns rely on geometric symmetry and proportionality. Patterns that exhibit greater symmetry and adherence to Fibonacci ratios are considered more reliable, increasing the probability of a turning point.
- Price Action Confirmation: Traders often look for additional confirmation from price action when trading harmonic patterns. This includes factors such as bullish or bearish candlestick patterns, trendline breaks, or divergence/convergence in momentum indicators. Confirmation from price action increases the probability of a successful turning point.
- Volume Analysis: Volume analysis plays a crucial role in confirming harmonic patterns. An increase in trading volume during the formation or completion of a harmonic pattern strengthens the probability of a turning point, indicating increased market participation and conviction.
- Timeframe Analysis: Harmonic patterns can occur on various timeframes, from intraday to daily or weekly charts. The probability of a turning point may vary depending on the timeframe, with patterns on higher timeframes often considered more reliable.
- Risk Management: Effective risk management is essential when trading harmonic patterns. Traders should always consider the potential risk-reward ratio before entering a trade and use stop-loss orders to mitigate losses if the market moves against their position.
While harmonic patterns can offer valuable insights into potential turning points in the market, they are not foolproof. Traders should use them in conjunction with other technical analysis tools and exercise caution when interpreting signals. Additionally, thorough backtesting and practice are essential to validate the effectiveness of harmonic pattern trading strategies.
About this Article
This article is the part taken from the draft version of the Book: Predicting Forex and Stock Market with Fractal Pattern. This article is only draft and it will be not updated to the completed version on the release of the book. However, this article will serve you to gather the important knowledge in financial trading. This article is also recommended to read before using Fractal Pattern Scanner, which is available for MetaTrader or Optimum Chart.
Below is the landing page for Fractal Pattern Scanner for MetaTrader 4 and MetaTrader 5. The same products are available on www.mql5.com too.
https://www.mql5.com/en/market/product/49170
https://www.mql5.com/en/market/product/49169
https://algotrading-investment.com/portfolio-item/fractal-pattern-scanner/
Below is the landing page for Optimum Chart
https://algotrading-investment.com/2019/07/23/optimum-chart/
Related Products


