Reversal Trading with Fractal Wave and Stochastic Cycles
In the previous chapters, we demonstrated the practical application of Geometric Prediction in the financial trading. In doing so, we have shown several different ways to detect geometric regularity. Then, we tried to combine them with turning point probability (i.e. statistical regularity) to fulfill the technical version of Geometric Prediction.
Geometric Prediction (General version) = statistical regularity + geometric regularity + knowledge around object
Geometric Prediction (Technical version) = statistical regularity + geometric regularity
The approaches to detect the geometric regularity include Support, Resistance, Harmonic Pattern, Falling Wedge pattern, Rising Wedge pattern, and Gann Angles. This is not necessarily the exhausted list of the approaches to detect the geometric regularity. With these approaches, our decision making process for buy and sell decision-making included two steps like below.
Step 1: Detect geometric regularity in price series
Step 2: Confirm the geometric regularity with statistical regularity
For example, in the case of using Harmonic Pattern, we detect Harmonic pattern (Step 1). Then we use the turning point probability in price and time to confirm the timing provided from the Harmonic Pattern (Step 2). Likewise, the rest of approaches will follow more or less the similar steps. In this chapter, we will be showing how to use above two steps in the reverse order. Hence, we will be making our trading decision like below:
Step 1: Detect statistical regularity in price series
Step 2: Confirm the statistical regularity with geometric regularity
To demonstrate the two reversed steps, we will use the confluence pattern of mother wave and child wave with high turning point probability (Step 1). Then we will use Fibonacci Expansion to get the fine tune of the possible turning point (Step 2).
The importance of the confluence pattern of mother wave and child wave was discussed heavily in many parts of this book. The confluence price pattern can be used to predict the multiple stochastic cycles present in fractal waves. Anatomy of the confluence price pattern is shown in Figure 4.8-1. By definition, the confluence price pattern is the mother wave pattern made up from several child fractal triangles. Some example of fractal triangles are shown in Figure 4.8-2. In fact, we can have various combination of child fractal triangles to form the mother wave.
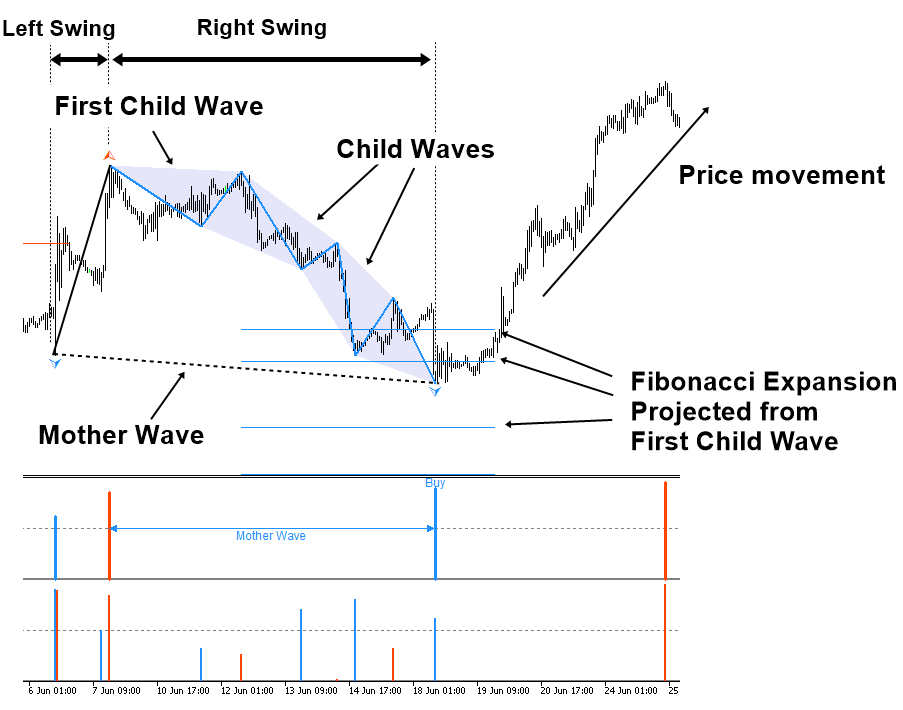
Figure 4.8-1: The anatomy of the confluence pattern in EURUSD H1 timeframe
In this book, we detect the confluence price pattern if more than two child fractal triangles present inside the right swing of the mother wave. The confluence price pattern shown in Figure 4.8-1 looks like the cup and handle price pattern. In fact, the confluence pattern sometimes look like AB=CD pattern when there are two child fractal triangles in the right swing of the mother wave. Sometimes, they look like Elliott Wave 12345 pattern when there are three child fractal triangles in the right swing of the mother wave. Sometimes, their turning point can overlap with Harmonic Pattern and X3 price patterns.
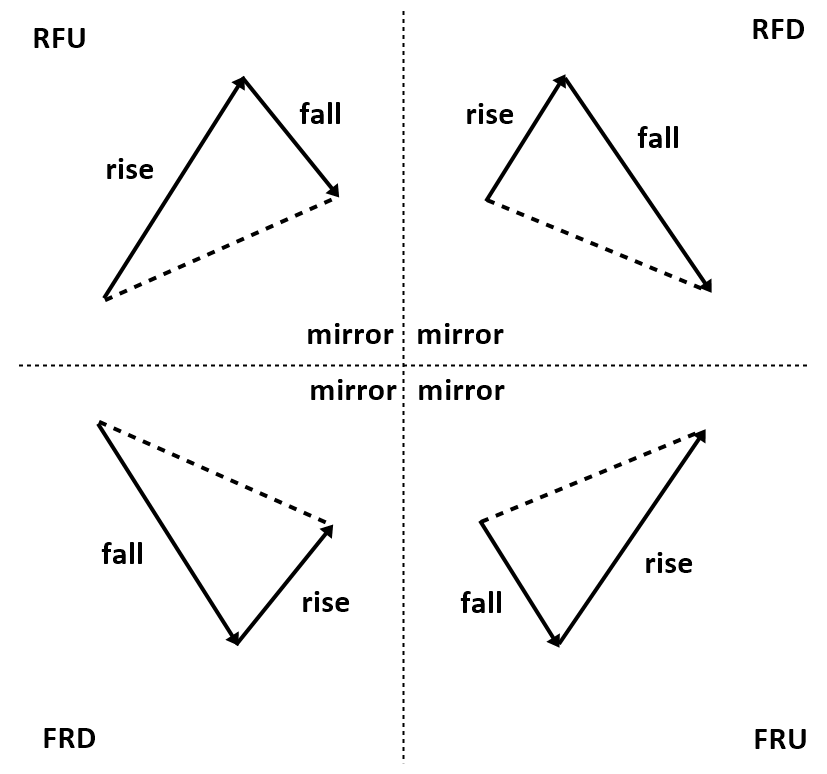
Figure 4.8-2: Four different fractal triangles in the financial market.
To detect statistical regularity (Step 1), we can consider the amplitude and wavelength of the mother wave at the right swing. It is possible to consider the amplitude and wavelength of the last child wave inside the mother wave too. However, our priority is to catch the big price movement. Hence, the amplitude and wavelength of the mother wave is more important.
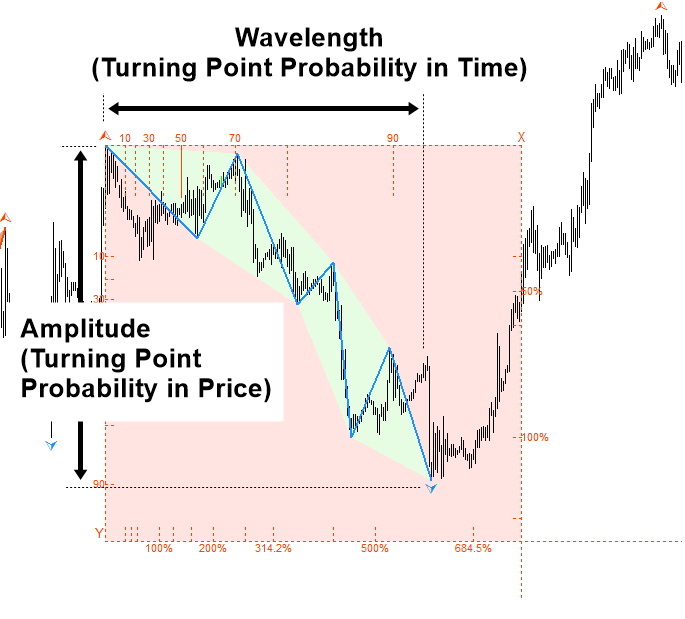
Figure 4.8-3: Turning Point Probability for the mother wave
To make use of the statistical regularity, we can detect the sufficiently large amplitude and wavelength at the right swing of the mother wave. For example, it might be sensible to choose amplitude with over 70% or 80% turning point probability to start with. Once such a confluence pattern is detected in chart, then we can use Fibonacci expansion to tune the buy or sell timing. We can draw Fibonacci expansion from the first child fractal triangle (=Y0/Y1) as shown in Figure 4.8-4. For your information, in Figure 4.8-4, we have six child fractal triangles inside the right swing of the mother wave.
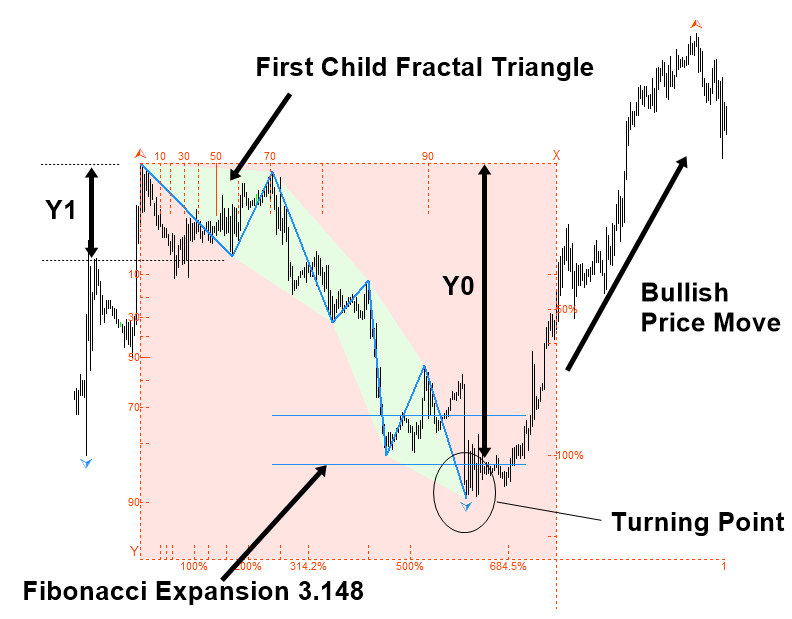
Figure 4.8-4: Confluence price pattern detected in EURUSD H1 timeframe
For your trading, some sensible Fibonacci expansion ratios are listed in Table 4.8-1. For each confluence pattern, we only need to concern several of these ratios per our situation. The most important factor for choosing the ratio is the size of the first child fractal wave.
| Fibonacci Expansion ratio | Fibonacci Expansion ratio in percent |
| 0.382 | 38.2% |
| 0.618 | 61.8% |
| 1.000 | 100.0% |
| 1.618 | 161.8% |
| 2.000 | 200.0% |
| 2.618 | 261.8% |
| 3.148 | 314.8% |
| 4.236 | 423.6% |
| 5.000 | 500.0% |
| 6.845 | 684.5% |
Table 4.8-1: List of possible Fibonacci Expansion ratio for our trading
In Table 4.8-2, we shares some observations we made in the past about these ratios. For example, when the amplitude of the child fractal wave is somewhere between 0% and 20%, we need to focus more on the ratios of 2.618, 3.148, 4.236, 5.000, and 6.845 than other ratios. Likewise, when the amplitude of the child fractal wave is somewhere between 21% and 40%, we need to focus more on the ratios of 1.618, 2.000, 2.618, and 3.148 than other ratios. What we have noticed is that it is slightly easier to trade if the size of first child fractal wave is big. Especially, when the size of child fractal wave is over 50%, we only need to concern two or three Fibonacci expansion ratios to tune our entry. Although the turning point might happen on some other ratios too, the listed ratios in Table 4.8-2 can provide you the rule of thumb for your trading. However, please be aware that Table 4.8-2 is not exhausted list of the ratios to consider.
| Amplitude of First Child Fractal Wave | Fibonacci Expansion ratios |
| 0% to 20% | 2.618, 3.148, 4.236, 5.000, 6.845 |
| 21% to 40% | 1.618, 2.000, 2.618, 3.148 |
| 41% to 60% | 0.618, 1.000, 1.618, 2.000 |
| 61% to 80% | 0.382, 0.618, 1.000, 1.618 |
| 81% to 95% | 0.382, 0.618 |
Table 4.8-2: List of important Fibonacci Expansion ratios per the size of first child fractal wave
So far, we have discussed some essential knowledge to trade with the confluence pattern of mother wave and child wave. Let us go through some practical examples. In Figure 4.8-5, we present the confluence price pattern that are made up from two child fractal triangles in the right swing of the mother wave. We detected this pattern when the right swing of the mother wave was nearly hitting 80% turning point probability. Then we used the Fibonacci expansion for the fine tune of the entry. In fact, the turning point was made at 1.618 ratio. The final turning point probability of the mother wave was 95% (M0) in price and 88% in time. As you can see, the amplitude (C0) of first child fractal wave was around 49% turning point probability. It helps us to anticipate the turning point at the Fibonacci Expansion ratios of 1.000, 1.618, and 2.000.
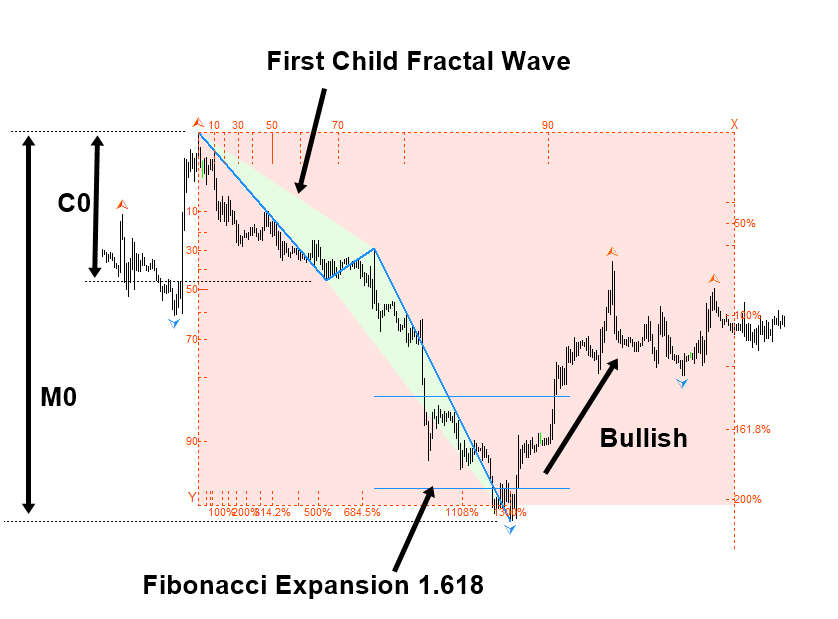
Figure 4.8-5: Confluence price pattern with two child fractal triangles inside the right swing of the mother wave in EURUSD H1 timeframe
In Figure 4.8-6, we present another example of the confluence price pattern with eight child fractal waves in the right swing of the mother wave. Initially we detected this price pattern around 80% turning point probability of the mother wave. Then we used the Fibonacci expansion for the fine tune of the entry. The size of first fractal triangle was around 10%. Hence, we were anticipating bit wider range of Fibonacci expansion ratios from 2.618 to 5.000. The actual turning point was taken at the Fibonacci expansion 3.148 ratio. The final turning point was made around 88% and 95% turning point probability in price and time.
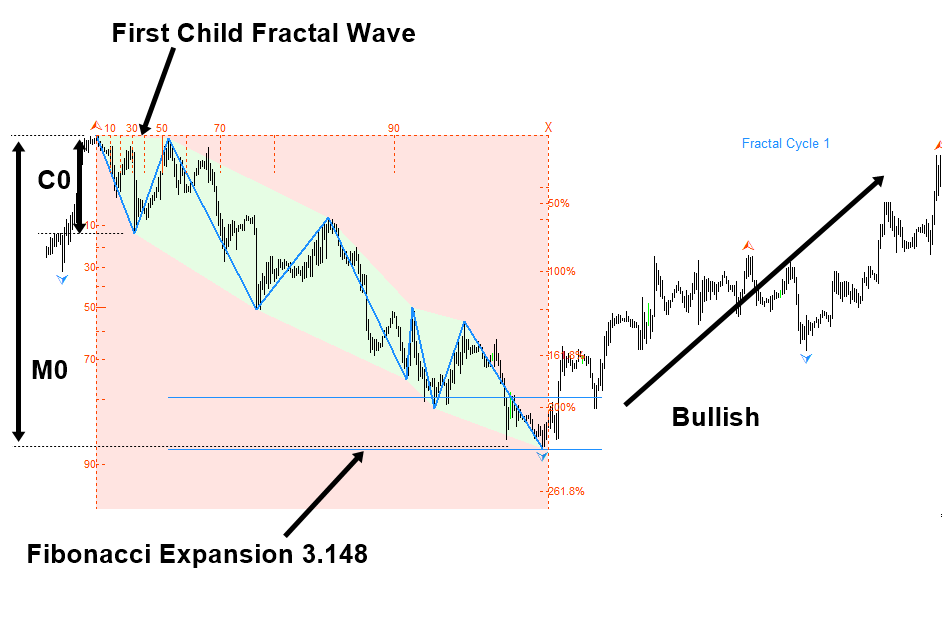
Figure 4.8-6: Confluence price pattern with eight child fractal triangles inside the right swing of the mother wave in EURUSD H1 timeframe
Sometimes, you might have the question like “I detected the confluence pattern look like Elliott Wave 12345 pattern. Can I apply Elliott Wave trading with the confluence pattern?”. The answer is “Yes, you can”. This typically happens when we detect the confluence pattern with three child fractal triangles in the right swing of the mother wave (Figure 4.8-7). Elliott Wave pattern detection is one way of ensuring the geometric regularity like Harmonic Pattern or X3 Price Pattern using the Ratios and Wave principle. Hence, applying Elliott Wave pattern does not go against the trading principle with the Geometric Prediction. In such case, you should apply the two steps we have provided in this chapter first. Then you will use the additional knowledge of Elliott Wave to make your final decision. In any case, the size of first child fractal wave provides an important clue about the possible turning point. Hence, we do not recommend you to skip this process.
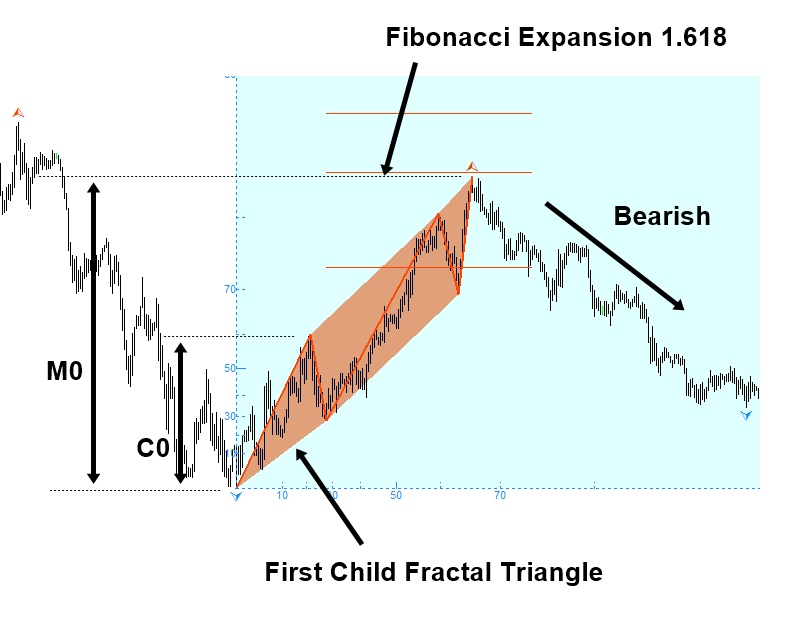
Figure 4.8-7: Confluence price pattern with three child fractal triangles look like Elliott Wave 12345 pattern in GBPUSD H1 timeframe
You can have a similar question in the case of Harmonic Pattern too. For example, you can have a harmonic pattern coincided with the turning point of the confluence price pattern. For example, in Figure 4.8-8, the turning point of the confluence price pattern is coincided with the sell signal of Butterfly pattern. As in the Elliott wave pattern, this does not go against our trading principle with the Geometric Prediction. We can just use this additional knowledge with Harmonic Pattern to confirm the geometric regularity. Just make sure that you follow the step 1 and step 2 provided in this chapter first. Then apply your Harmonic Pattern knowledge as an additional confirmation tool. Since several different methods agree on the trading direction, this can improve the trading performance in long run.
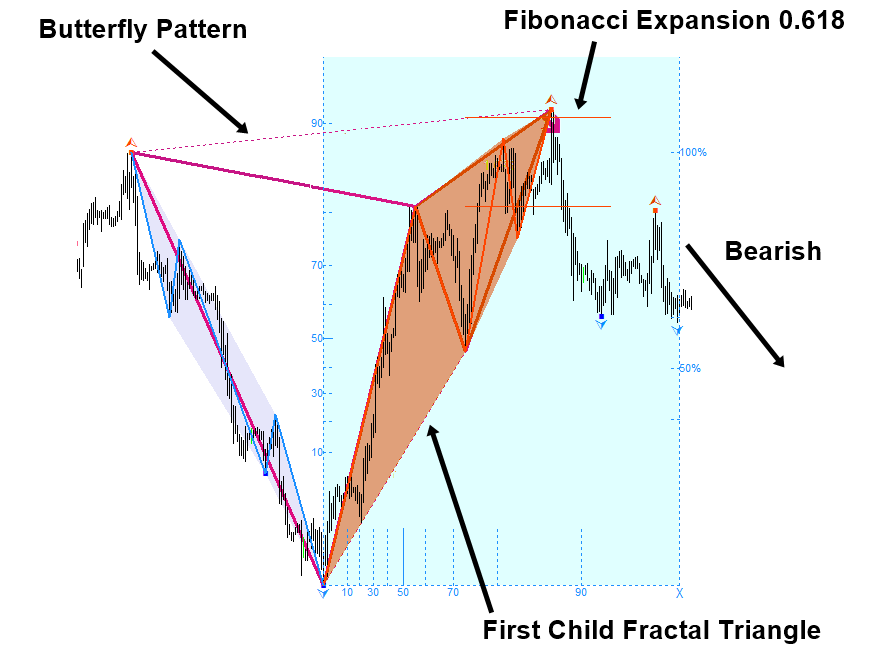
Figure 4.8-8: Confluence price pattern with four child fractal triangles, which coincides with Butterfly pattern in GBPUSD H1 timeframe
Likewise, you can apply the similar logic to the case of Support, Resistance, Falling Wedge pattern, and Rising Wedge pattern. You can use all these approaches to extend the ability to detect geometric regularity. Combining the statistical regularity and geometric regularity completes the technical version of the Geometric prediction. To complete the prediction, we also recommend adding your knowledge on the market and fundamental analysis behind the financial instrument (i.e. knowledge around the object) during the decision-making. This would provide the most complete and accurate form of the market prediction fulfilling all the essential parts of the Geometric Prediction.
Some More Tips about Reversal trading with Fractal Wave
Reversal trading with Fractal Wave, excluding the fractals by Bill Williams, involves identifying and leveraging fractal patterns and wave theory concepts to predict potential market reversals. This method uses the natural recurring patterns in price movements to spot turning points where the market trend might reverse. Here’s how you can apply this approach in Forex trading:
Understanding Fractal Waves in Reversal Trading
Fractal Waves:
- Fractal waves refer to price patterns that repeat at various scales in the market. These patterns are based on the fractal nature of price movements, where similar shapes and behaviors occur across different time frames.
Key Concepts and Tools
1. Wave Structures:
- Impulse Waves: These are waves that move in the direction of the prevailing trend. They are usually strong and consist of smaller sub-waves.
Corrective Waves: These are waves that move against the prevailing trend. They tend to be smaller and indicate a temporary pause or reversal in the trend.
2. Elliott Wave Theory:
- Elliott Wave Theory identifies repetitive wave patterns in market prices. It breaks down trends into five-wave structures (three impulse waves and two corrective waves) and corrections into three-wave structures. Use Elliott Wave patterns to identify potential end points of trends (impulse waves) and corrections.
3. Harmonic Patterns:
- Harmonic patterns like the Gartley, Bat, Butterfly, and Crab are based on Fibonacci ratios and can signal potential reversals. These patterns help identify precise entry and exit points by marking potential reversal zones.
4. Fibonacci Retracements and Extensions:
- Fibonacci retracement levels (23.6%, 38.2%, 50%, 61.8%, and 78.6%) help identify potential reversal points during corrections.
- Fibonacci extensions help project potential targets for impulse waves.
Steps for Reversal Trading with Fractal Wave
- Identify the Trend: Determine the overall market trend using tools like moving averages, trendlines, or the ADX indicator.
- Spot Fractal Patterns: Look for repeating fractal patterns that indicate potential reversals. These could be found at the end of significant price moves or corrections. Use multiple time frames to confirm the presence of these patterns.
- Confirm with Harmonic Patterns: Check if harmonic patterns align with the identified fractal wave patterns. This adds an extra layer of confirmation for potential reversal points. Use tools like pattern recognition software or manual plotting to identify harmonic patterns.
- Use Elliott Wave Analysis: Apply Elliott Wave Theory to identify the wave count and determine if the market is in an impulse or corrective phase. Look for the completion of a five-wave impulse pattern or a three-wave correction as potential reversal signals.
- Apply Fibonacci Levels: Plot Fibonacci retracement levels to identify potential reversal zones during corrective waves. Use Fibonacci extensions to set potential targets for impulse waves.
- Set Entry and Exit Points: Enter trades near the identified reversal points confirmed by fractal patterns, harmonic patterns, and Elliott Wave counts. Place stop-loss orders below the last swing low (for bullish reversals) or above the last swing high (for bearish reversals) to manage risk.
- Monitor Price Action: Watch for confirmation of the reversal through price action, such as breakouts from consolidation, candlestick patterns (e.g., engulfing patterns, pin bars), and increasing volume.
- Manage the Trade: Adjust stop-loss orders to lock in profits as the price moves in the expected direction. Use trailing stops or exit strategies based on Fibonacci extensions or the completion of wave patterns.
Advantages of Reversal Trading with Fractal Wave
- Early Identification: Fractal waves can provide early signals of potential reversals, allowing traders to enter trades at advantageous prices.
- Precision: Combining fractal patterns with harmonic patterns and Fibonacci levels enhances the precision of identifying reversal points.
- Versatility: This approach can be applied across various time frames and market conditions.
Limitations of Reversal Trading with Fractal Wave
- Complexity: Identifying and confirming fractal patterns, harmonic patterns, and Elliott Wave counts can be complex and requires practice.
- False Signals: Like any technical analysis method, fractal wave analysis can produce false signals, especially in choppy or low-volume markets.
By integrating fractal wave theory, harmonic patterns, and Elliott Wave analysis, traders can develop a robust strategy for identifying and trading market reversals. As always, thorough backtesting and continuous practice are essential to mastering this approach.
About this Article
This article is the part taken from the draft version of the Book: Predicting Forex and Stock Market with Fractal Pattern. This article is only draft and it will be not updated to the completed version on the release of the book. However, this article will serve you to gather the important knowledge in financial trading. This article is also recommended to read before using Fractal Pattern Scanner, which is available for MetaTrader or Optimum Chart.
Below is the landing page for Fractal Pattern Scanner for MetaTrader 4 and MetaTrader 5. The same products are available on www.mql5.com too.
https://www.mql5.com/en/market/product/49170
https://www.mql5.com/en/market/product/49169
https://algotrading-investment.com/portfolio-item/fractal-pattern-scanner/
Below is the landing page for Optimum Chart
https://algotrading-investment.com/2019/07/23/optimum-chart/
Related Products


