Rolling Ball Effect and Harmonic Pattern Trading
We use turning point strategy because of their high reward/risk ratio. Higher rewards/risk ratio means relatively lower winning rate comparing to other lower rewards/risk trading setup. As an extreme example, in scalping, you can achieve over 90% of winning rate if you have the target profit of 1 pip against 20 or 30 pips risk. However, it does not mean that scalping is better technique than other strategies. With scalping, you have to increase frequency of trading to achieve the same profit level as other techniques do. In addition, few losing trades will risk your account quickly. In harmonic pattern trading, higher rewards/risk ratio will reduce your winning rate dramatically. It is hard to say exact winning rate. Roughly, your chance to be successful is somewhere between 10% and 60%. Of course, it can be higher depending on your discipline and rewards/risk ratio. When we trade with turning points, we can be wrong many times. However, few winning trades will offset your loss and will offer you profits. Several losing trades will never impose a lot of pressure on your account when you are taking reasonable risk for each trade. Turning point strategy has nice operating characteristics for trader. Unlimited profit range is the key merit on why the turning point strategy is loved by many traders (Figure 11-1). In addition, the required frequency of trading is much less than other trading strategy. This sort of strategy will fit to the life style of many of us. Having said that, many traders do not understand the skills and discipline required for turning point strategy. In essence, the key to apply successful turning point strategy is reducing number of losing trades.
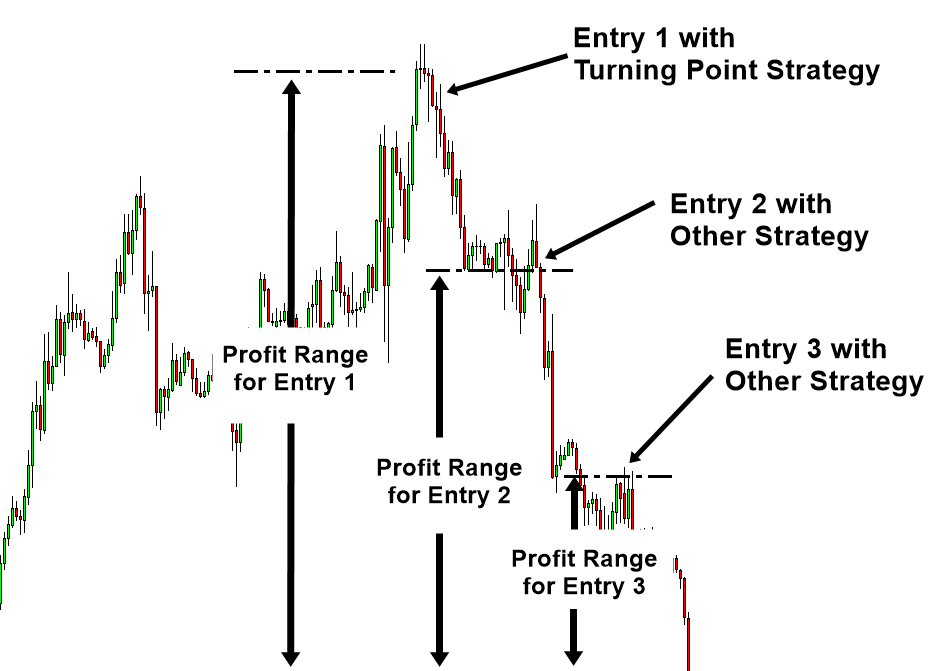
Figure 11-1: Profit range of turning point strategy compared to others.
To reduce number of losing trades and to increase your winning rate, you must understand the rolling ball effect. What is rolling ball effect? To explain the rolling ball effect in harmonic pattern context, let us start with some example of bullish harmonic patterns. We will be using bullish trading example thoroughly in this chapter. For selling case, please turn the logic explained here the other way around.

Figure 11-2: Schematic diagram of rolling ball on the slope.
Most of time the bullish turning point will come after heavy selling period. In the case of global turning point, it would come after intensive selling (Figure 11-3). In the case of continuation and local turning point, the turning point will come after some selling (Figure 11-4). When we look back this in chart, it seems everything is ok. However, if we are standing at the time before the turning point happens, this is not fun to be honest. Especially we have just sent some large buying orders when all bearish investors think this might be suiciding. Even in this fearful moment, we still do this because we know that there are people waiting to enter buy when price is sufficiently discounted. However, this is only half of our equation.
To win, you have to understand the other half of equation. The other half of equation is that it is not easy to stop the rolling ball on the slope as shown in Figure 11-2. Even the rolling ball reaches end of the slope, we cannot expect the rolling ball to be stopped right at the end because the rolling ball has the built up momentum in the rolling direction. Instead, it usually takes several hard attempts to stop them or they will role until they lose all the momentum by the friction of surface and air and other obstacles on its way. This rolling ball effect is the typical cause behind the failed harmonic patterns. Less sophisticated trader does not see this rolling ball effect. They are almost careless about the built-up momentum of the selling market. If you miss this point, you will be joining the 90/90/90 club, 90% of the traders losing 90% of their money within 90 days.
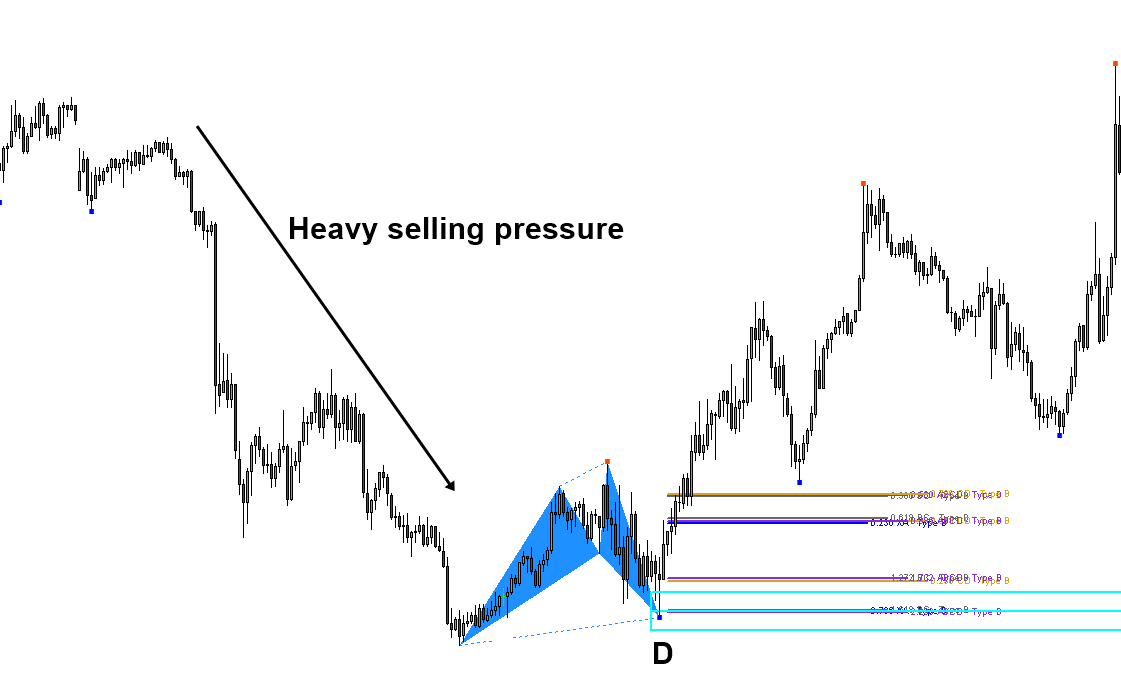
Figure 11-3: Global turning point example after heavy selling pressure.
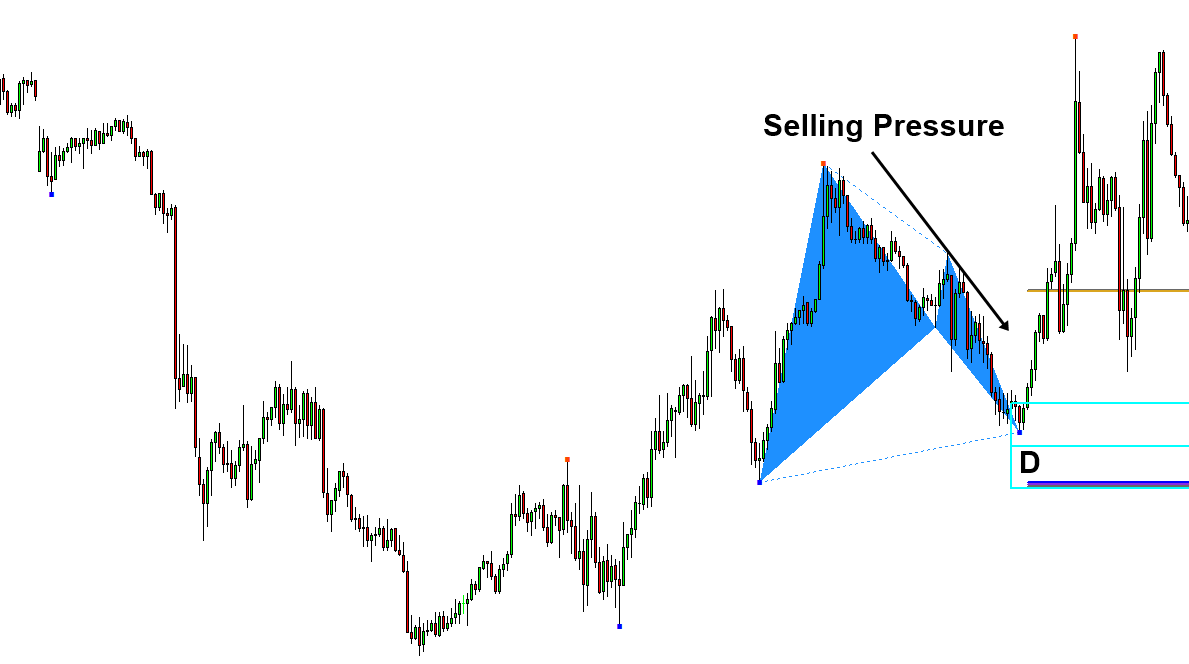
Figure 11-4: Local turning point example.
To deal with this rolling ball effect, sometimes, you can employ the multiple entry technique for harmonic pattern trading. In multiple entry technique, you will split your order into two or three smaller. At first, you will open first entry with the order size of half or one third of one full order. Then you will monitor how the market is responding. If market is going down further, this means that the rolling ball effect is still not cleared yet. As price is going down further, the harmonic pattern can fail. During this process, this might be losing trade or this might be breakeven if you are skilled. At the same time, you have to check if the market is showing some intent to become bullish or not for your future second entry. If the market showed some intent to become bullish, then you can wait for the second opportunity. It is important to have sufficient price distance between your first and second entry though. Second entry must be well below outside the Pattern Completion Interval of the first entry to account for the rolling ball effect. If we meet the turning point in our first entry, it is the best scenario. In such scenario, make sure that you are using maximum profit range to account for the reduced position size. Even if our first entry did not go well, we still have the second chance. Now, you might be wondering how many entries are recommended in multiple entry. Typically, two is recommended and three is the maximum I can suggest. If you split your order into too many pieces, then you profit size is getting smaller too. I do not recommend going over more than three typically. Two is good choice and three is the maximum.
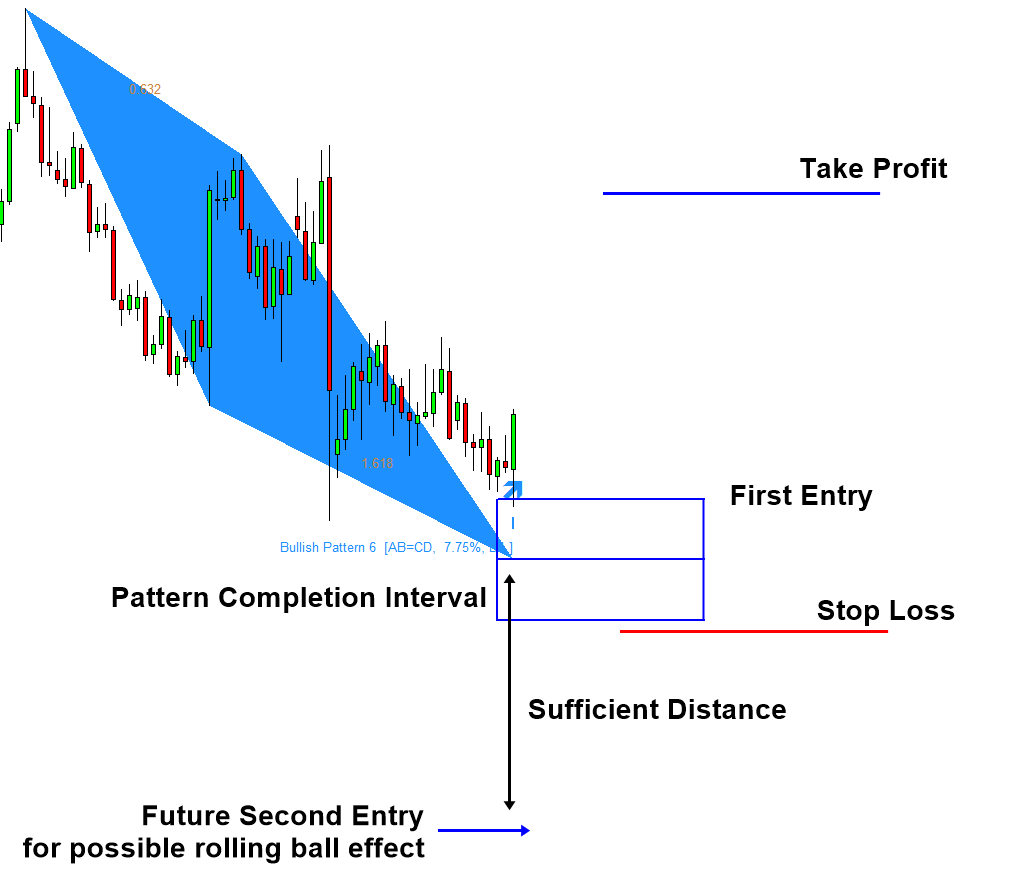
Figure 11-5: Multiple entry demonstration with AB=CD pattern.
Sometimes, there are people doing exactly opposite to multiple entries recommended here. That is they are taking multiple exits. For your information, multiple exit technique can not deal with the rolling ball effect if the entry of two orders are identical. Multiple exits with same entry isn’t efficient technique because the end result is more or less the same with single entry with the averaged take profit between two take profits. For example, some trader sets two take profits at 0.381 and 0.618 Fibonacci projected level from D point. The results of this will become close or identical to one take profit at 0.500 Fibonacci projected level in long run. I do not recommend this sort of multiple exit setup. However, if you must do this sort of multiple exit setup, then I recommend using Potential Continuation Zone, instead of simple Fibonacci projection. Potential Continuation Zone, introduced in this book, is much better predictor of turning point after the D point is confirmed. Hence, you can use two Potential Continuation Zone sensibly to place your two take profit targets. In addition, if you are going to employ two orders, try to differ the entries to account for the rolling ball effect. If you are differing the entries of the two orders, then it will become the multiple entry technique we have been explaining here.
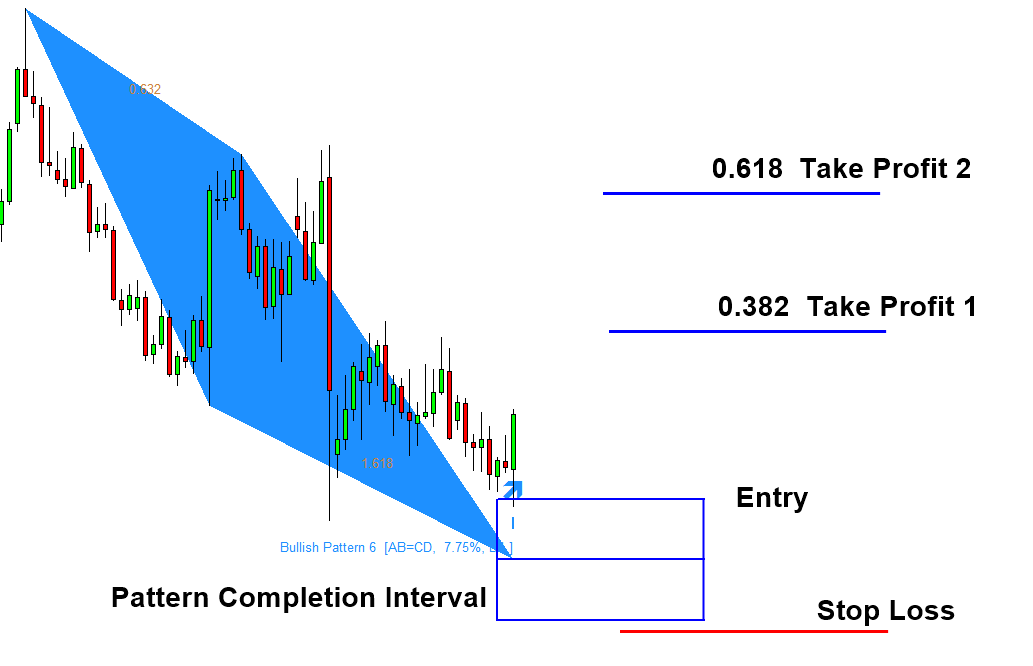
Figure 11-6: Multiple exit demonstration with AB=CD pattern.
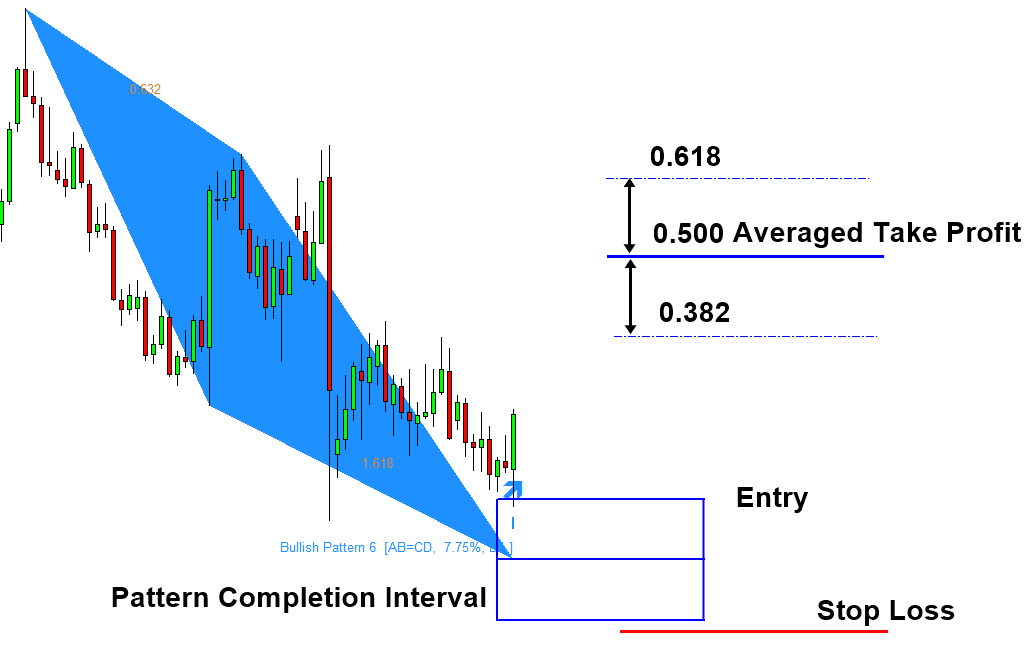
Figure 11-7: Single exit setup equivalent to multiple exit setup in Figure 11-4.
Some More Tips about Rolling Ball Effect in Forex Trading
Momentum in Price Movements
- Building Momentum:
- Description: Just like a ball rolling down a hill gains speed and momentum, a currency pair can show increasing momentum when it moves in a particular direction. This momentum can be due to several factors, such as market sentiment, economic indicators, or geopolitical events.
- Application: Traders look for signs of increasing momentum to enter trades in the direction of the trend. This can be done using technical indicators like the Moving Average Convergence Divergence (MACD) or the Relative Strength Index (RSI).
- Continuation Patterns:
- Description: The rolling ball effect can also be seen in continuation patterns, where the market consolidates before continuing its previous trend. Examples include flags, pennants, and wedges.
- Application: Identifying these patterns can help traders anticipate the resumption of a trend, allowing them to position themselves accordingly.
Trend Dynamics
- Trend Reversals:
- Description: A rolling ball eventually slows down and changes direction due to external forces. Similarly, currency pairs can reverse their trends after periods of sustained movement.
- Application: Traders look for reversal signals such as double tops/bottoms, head and shoulders patterns, or divergences in technical indicators to predict and capitalize on trend reversals.
- Support and Resistance:
- Description: Like a rolling ball that might encounter obstacles, currency prices often meet support (a price floor) and resistance (a price ceiling) levels. These levels can temporarily halt or reverse price movements.
- Application: Identifying key support and resistance levels helps traders set entry and exit points, as well as manage risk through stop-loss and take-profit orders.
Risk Management
- Volatility Considerations:
- Description: The speed and trajectory of a rolling ball can be unpredictable, much like the volatility in forex markets. Sharp movements can pose significant risks to traders.
- Application: Implementing risk management strategies, such as proper position sizing, stop-loss orders, and using volatility indicators (e.g., Bollinger Bands, Average True Range) can help manage this risk.
- Market Sentiment:
- Description: Market sentiment can drive momentum in currency pairs, similar to how external forces can influence the direction of a rolling ball.
- Application: Staying attuned to market sentiment through news analysis, economic reports, and sentiment indicators (like the Commitment of Traders report) can provide insights into potential market movements.
About this Article
This article is the part taken from the draft version of the Book: Guide to Precision Harmonic Pattern Trading (Mastering Turning Point Strategy for Financial Trading). This article is only draft and it will be not updated to the completed version on the release of the book. However, this article will serve you to gather the important knowledge in financial trading. This article is also recommended to read before using Harmonic Pattern Plus, Harmonic Pattern Scenario Planner and X3 Chart Pattern Scanner, which is available for MetaTrader or Optimum Chart.
Below is the landing page for Harmonic Pattern Plus, Harmonic Pattern Scenario Planner and X3 Chart Pattern Scanner in MetaTrader. All these products are also available from www.mql5.com too.
https://algotrading-investment.com/portfolio-item/harmonic-pattern-plus/
https://algotrading-investment.com/portfolio-item/harmonic-pattern-scenario-planner/
https://algotrading-investment.com/portfolio-item/profitable-pattern-scanner/
Below is the landing page for Optimum Chart (Standalone Charting and Analytical Platform).
https://algotrading-investment.com/2019/07/23/optimum-chart/
Related Products


