The Concept behind the Pattern Completion Zone (PCZ)
Pattern Completion Zone or Pattern Completion Interval is the emerging concept first introduced from this book. The concept was born after the extensive computerized research in tradable patterns in the financial market conducted by myself. Therefore, not many traders are aware of its existence yet. As you read this book, you will find out that it is extremely useful concept for your harmonic pattern trading. At the same time, the concept is not a rocket science. The concept is simple enough for any average trader for their practical trading. To understand the concept of the Pattern Completion Interval, we shall understand the term approximation first. Of course, everyone know the literal meaning of approximation. However, technically speaking, approximation make quite big influence every day in our life, but many people will not notice its impact unless you are the math geek crunching numbers all day in your job.
Whether you agree or not, approximation arises naturally every day in our life. There can be plenty of examples but we shall start with most intuitive one. Let us use the sprint record of Usain Bolt to learn about approximation. The record-breaking sprint of Usain Bolt was the popular coverage in many Newspapers during the 2016 Olympics since he was winning his third gold medal in 100 meter sprint. Here is simple but interesting three numbers about Usain Bolt, the fastest man in the world.
Height: 1.96 meters (6 foot 5 inches)
Distance: 100 meters
Time: 9.58 seconds
These three numbers can be true but maybe not. I am not suspecting about legitimacy of Usain Bolt’s record like the drug test results in the Olympics. I am pointing out that the measuring instrument, whoever measured, can only approximately measure these numbers up to certain degree. It is not because the measuring person did his job poorly but just because the instrument have own limitation to measure these numbers. For example, the sprint time might be 9.5823 seconds instead of 9.58 seconds. Maybe expressing it into 9582.3 milliseconds, we can be slightly more precise. However, still we are not dead accurate. To be dead accurate, we need infinite number of decimals to describe these numbers. This is impossible. Most of time, we will always approximate regardless of what measurement unit we are using. Likewise, the height of Usain Bolt is only the approximation too. Precisely speaking it is impossible to tell if he is 1.963 meter tall or 1.962 meter tall. Besides the height and time approximation, you can probably find many other approximation examples in our daily life like weight, speed, calories, etc.
Here is another example. From your High School, you will probably remember pi, the ratio of a circle’s circumference to its diameter up to 2 decimal places as 3.14. Once again, this is only approximation. Some scientists remember it up to five decimal places as 3.14159 if they work frequently with pi. In fact, even if we use 50 decimal places to describe it as:
pi = 3.14159265358979323846264338327950288419716939937510,
we are only approximating it. By now, you should realize that countless approximation influence in and out of your life. One negative example might be that my classmate in my old university in the United Kingdom, failed to achieve the First Class honor since his overall score was only 69.4. In British degree system, First Class honor is granted to the students achieving the overall score over 70. First class honor is the highest grade they can achieve under the British degree system. At the same time, the other mate scored 69.6 earned First Class honor. Apparently, the academic satisfaction for these two friends were very different. Even after graduate, when they find jobs or when they get married, when they do business, these Second Class and First Class label will definitely stick with them. Now you can probably imagine that our world is not as pretty and square as you think. Well the same thing goes to scanning of Harmonic Patterns from your chart too.
Pattern Completion interval build its concept over the approximation but nothing else. It is in fact based on the assumption that the measured ratio in the harmonic patterns are only an approximation. Ideally, the popular Gartley Pattern should consist of the ratios shown in Figure 2-1. It is because we assume that harmonic pattern should have the exact Fibonacci ratio in theory. However, when the Gartley pattern is detected by the pattern scanner, most of time the pattern will possess the approximated ratios, which closely match to the ideal Gartley pattern but not dead accurate. Well, one day you can be very lucky to find the perfect Gartly pattern with perfect ratio in your chart. This is very rare event. Even in this very rare event, the chance that your pattern will be truly perfect is very thin because the pattern scanner might round up the ratio AB/XA for 0.618 instead of 0.6181 or CD/BC for 1.272 instead of 1.2723. Approximation error is always there in our pattern detection task. We will never be able to get rid of them since we have only limited memories inside both human brains and computers.
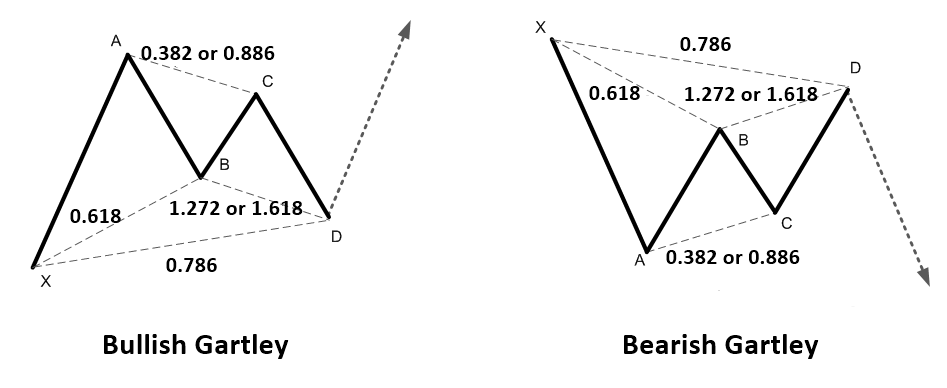
Figure 2-1: Structure of Gartley Pattern for Bullish and Bearish Pattern.
Since this approximation exists every time in detecting harmonic pattern, we know that, we are less accurate every time when our pattern scanner measure the ratio 0.618 or 0.382 or other Fibonacci ratio from our chart. Well, this is very common facts in the scientific world. On the other hands, as this is so common, the scientist already gave a lot of thought in overcoming this approximation error rather than using infinite number of decimals to describe the measurement.
So how can we be overcome this approximation error? Typically, in practical application like engineering and statistics, people use tolerance as one possible way of describing the measurement. In technical term, tolerance is the total amount by which a specific dimension is permitted to vary. The tolerance is the difference between the maximum and minimum limits. Going back to our Usain Bolt’s sprint record. Instead of writing 9.58 seconds, we can write 9.58 seconds 0.005. This means that Usain Bolt’s record will not be greater than 9.585 seconds and it will not be smaller than 9.575 seconds. His record will fall somewhere in between 9.585 and 9.575. By assigning maximum and minimum tolerance limit, we can be more precise in recording his records. We can also avoid using the infinite decimal places to describe his record. Using infinite decimal places is impractical. Likewise, we can describe his height as 1.96 0.005. This means that his height will fall in between 1.965 and 1.955 meters.
How this tolerance can be related to the Pattern Completion Interval in our Harmonic Pattern trading? Well, Pattern Completion Interval is in fact no more than just the tolerance limit described above. It is indeed the upper and lower limit permitted to vary in detecting Harmonic Pattern. Since detecting Harmonic Pattern is quit visual task, it might be a good idea to show the pattern completion interval using a box like in Figure 2-2. In the AB=CD Bearish reversal Pattern in Figure 2-2, the upper limit is the maximum price level permitted for this pattern to be qualified as AB=CD Harmonic Pattern. If EURUSD goes beyond this Upper Limit, then the Pattern can not be qualified as the AB=CD pattern since the pattern is breaching the tolerance limit for the given Fibonacci ratio.
In general, the tolerance limit in many practical applications are specified in symmetric manner like 1.96 meters 0.005. Technically, we can assign symmetric Upper and Lower Limit for Pattern Completion Interval too. However, either one limit between Lower Limit and Upper Limit is relevant for our trading depending our trading direction. For example, for Bearish Reversal Pattern, we only need to concern about Upper Limit since we want to know when the Harmonic Pattern will fail to form from the price moving too high. Likewise, for Bullish Reversal Pattern, we only need to concern about Lower Limit.
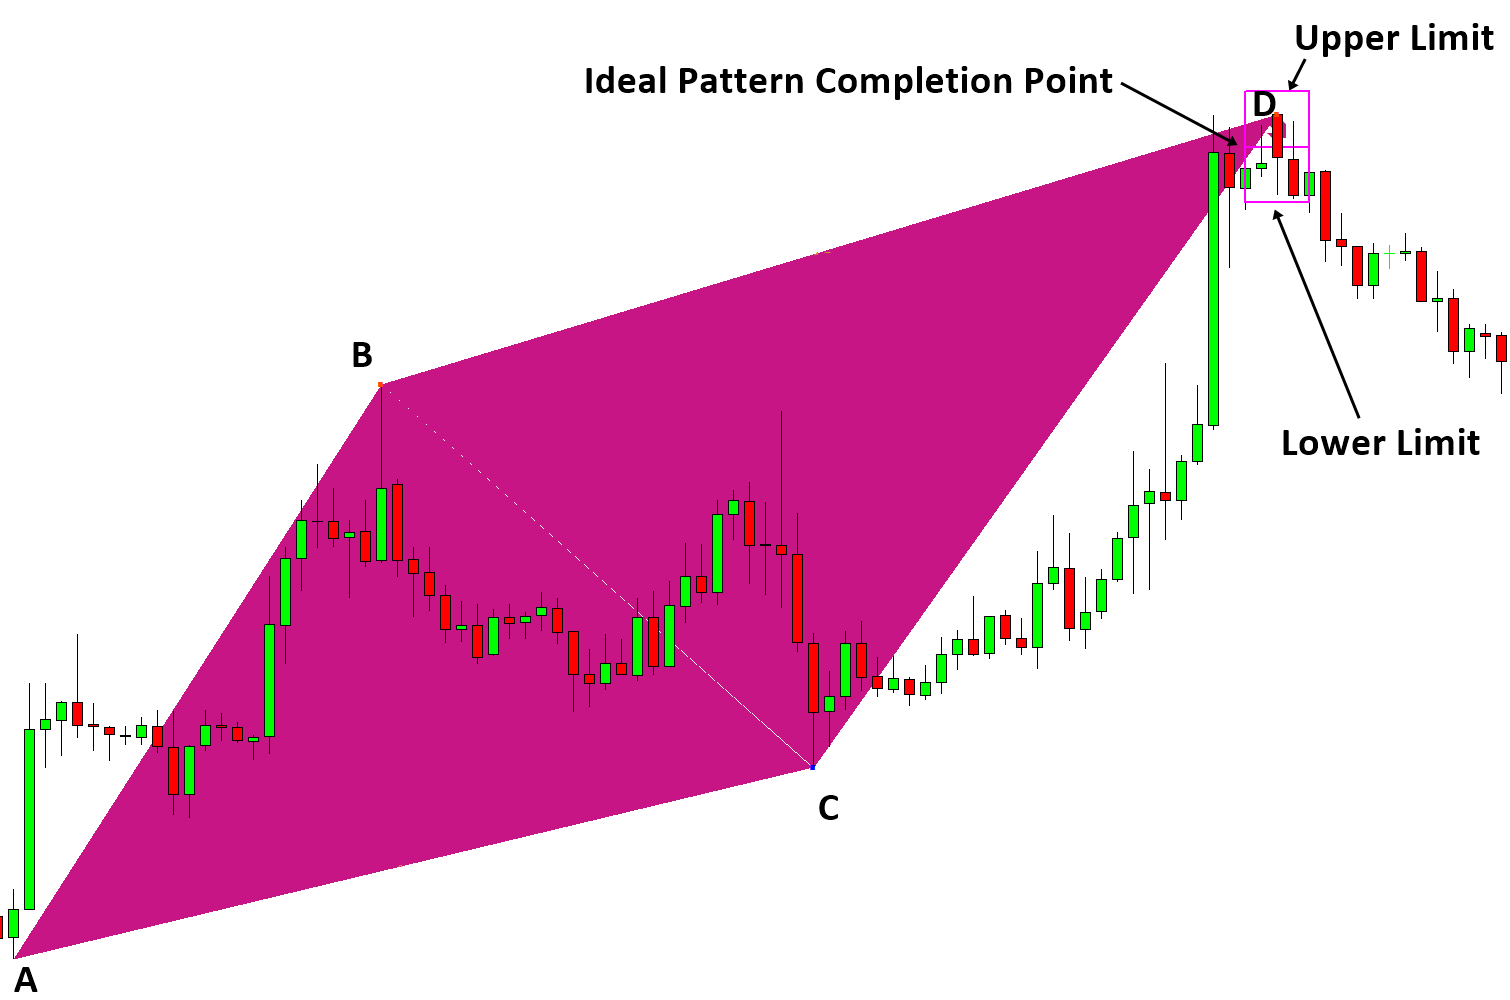
Figure 2-2: Bearish AB=CD Pattern for EURUSD.
Another peculiar thing to discuss is that unlike our height and time example from Usain Bolt’s sprint, our pattern detection task involves several ratios and not just single ratio. For the Bearish AB=CD pattern in Figure 2-2, we will measure the ratio BC/AB and CD/BC together to check if these ratio are held near 0.618 and 1.271 respectively. Alternatively we can also check if the ratio is held near 0.786 and 1.618 respectively. Since we are checking two ratios, in fact we are concerning about 4 points for our pattern detection in our case of AB=CD pattern detection. Although the most important tolerance limit will be based on the final point D, one can still have the tolerance limits at the point A, B and C too. However, the tolerance limits at the point A, B and C are much less useful for our trading. In our operational definition, the Pattern Completion Interval is the tolerance limit at the final point D.
Pattern Completion interval and tolerance concept should clear up the most commonly asked questions from junior traders like:
- Why detected Harmonic Patterns have the ratios different from the ideal one?
- I am seeing the wrong patterns in my chart. Can I only see the ideal patterns in my chart?
- My pattern is dead accurate. If I trade with this pattern, can I have success rate of 96%?
Although we use the analogy of tolerance to illustrate the concept of the Pattern Completion Interval. In the course of our research, the concept of pattern completion interval was actually drawn from the concept of the prediction interval and confidence interval from statistics. For simple example, consider the simple regression with prediction interval and confidence interval shown in Figure 2-3. The fitted line on the constructed regression equation is the point prediction for the given x values. If we are using this regression equation to predict future y values according to the given x values, you can see that the point prediction from the given fitted line will not accurately predict the future outcome from Figure 2-3. In fact, most of time, prediction from regression equation will offer us some reference points to consider but they will be quite far out from actual future outcome.
Instead of relying on this point prediction, statistician use prediction interval to illustrate worst and best case of your prediction in probabilistic sense. For example, 95% prediction interval means that future outcome will fall within this interval 95% of time. With the prediction interval, it is much easier to assess your risk of making wrong prediction than just using the point prediction alone. Likewise, the confidence interval is the similar concept to prediction interval. Instead of concerning the point prediction, Confidence interval concern our choice of parameters in our mathematical model. Since we can only estimate our parameters based on our sampled data, confidence interval help us to assess our risk associated with our choice of parameters. As before, 95% confidence interval means that the true population parameters will fall within this interval 95% of time. For both prediction interval and confidence interval, 90%, 95% and 99% are the common intervals to use. However, some industries use some other intervals like 80%.
We found that our Pattern Completion Interval shares many common ideas with prediction Interval and confidence interval. However, it is difficult to tell which one is closer to Pattern Completion Interval. The Pattern Completion Interval helps us to assess the risk associated with the Harmonic Pattern formation. If we view the harmonic pattern detection task as the prediction of turning point, then the Pattern Completion Interval offer the similar functionality to prediction interval to users. However, the Pattern Completion Interval does not offer us any probabilistic information like prediction and confidence interval do. Since we assume the Fibonacci ratio as an absolute measure for the Harmonic Pattern formation, the typical concern rising over the choice of parameters, which is necessary for many other practical applications, fade away. Since this book focus on the practical side, it make more sense to concern about the functionality of Pattern Completion Interval for traders.
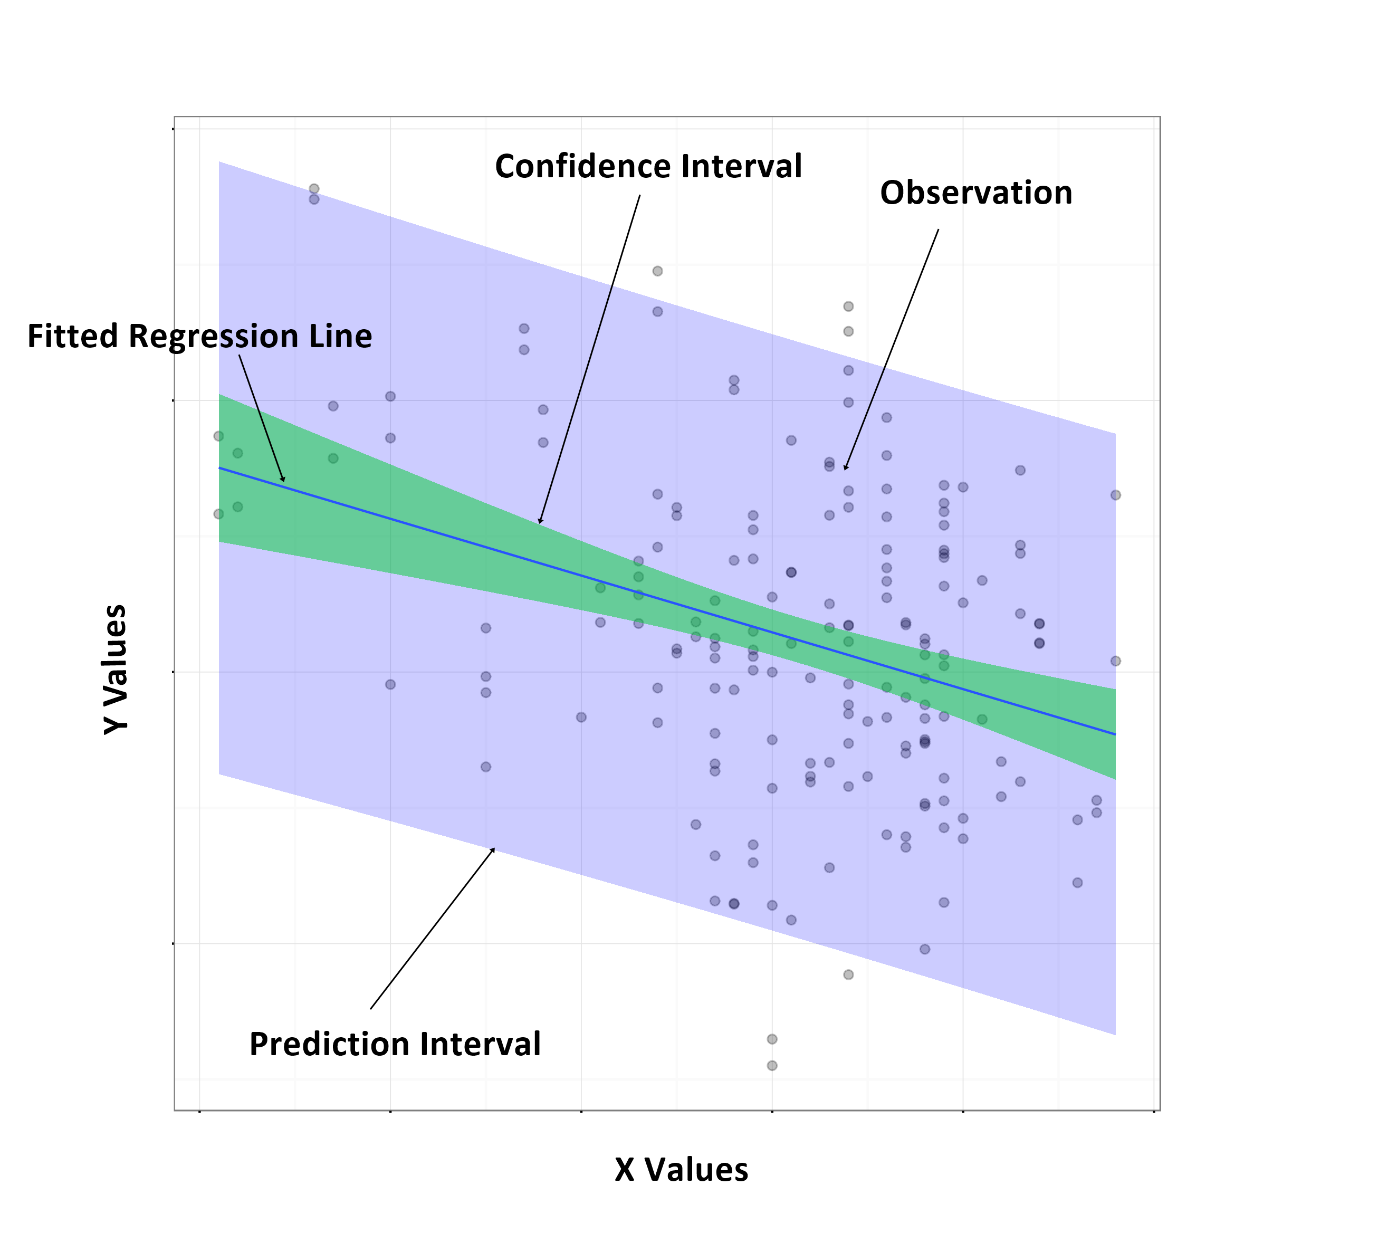
Figure 2-3: Illustration of simple Regression equation with confidence interval and prediction interval.
Some More Tips about the Concept behind the Pattern Completion Zone
The concept of the Pattern Completion Zone (PCZ) in forex trading is crucial for traders who rely on chart patterns and technical analysis to make informed decisions. The PCZ refers to a specific area or price range where a chart pattern is considered complete, and a potential trading opportunity is identified. This zone is where traders look for confirmation signals to enter or exit trades. Here’s a detailed overview:
Key Components of the Pattern Completion Zone (PCZ)
- Chart Patterns:
- Types: Common patterns include Head and Shoulders, Double Top/Bottom, Triangles, Flags, Pennants, and Harmonic Patterns (like Gartley, Butterfly).
- Formation: Patterns form over time as price action moves, creating recognizable shapes that suggest potential future movements.
- Defining the PCZ:
- Description: The PCZ is the area where the final segment of a chart pattern is expected to complete. For example, in a Head and Shoulders pattern, the PCZ is around the neckline.
- Price Range: The zone typically involves a specific price range rather than a single price point, accommodating slight variations in market behavior.
Identifying the Pattern Completion Zone
- Technical Analysis Tools:
- Trendlines: Drawn to connect significant highs or lows, helping to define the boundaries of the PCZ.
- Fibonacci Levels: Often used to identify potential PCZ areas, especially in harmonic patterns.
- Support and Resistance Levels: Critical for defining zones where price is likely to react.
- Indicators for Confirmation:
- Volume: Increased volume can confirm the validity of the pattern completion.
- Moving Averages: Crossovers or alignment with the PCZ can provide additional confirmation.
- Oscillators: Tools like RSI or MACD can indicate overbought or oversold conditions, aligning with pattern completion.
Trading Strategy Using the Pattern Completion Zone
- Pattern Identification:
- Recognition: Identify the developing chart pattern using historical price data and technical analysis.
- Projection: Determine where the pattern is likely to complete based on its typical structure.
- Defining the PCZ:
- Calculation: Use tools like Fibonacci retracement or extension levels to project the PCZ.
- Validation: Ensure the PCZ aligns with other technical factors such as previous support/resistance or trendlines.
- Entry and Exit Strategy:
- Entry Point: Enter the trade as the price action confirms completion within the PCZ. This could be a breakout from a neckline or a key support/resistance level.
- Stop-Loss: Place stop-loss orders just outside the PCZ to manage risk, accounting for potential false breakouts or whipsaws.
- Take-Profit: Set take-profit targets based on the pattern’s projected move. For example, measure the height of the pattern and project it from the breakout point.
- Risk Management:
- Position Sizing: Adjust the size of the trade based on the distance to the stop-loss, ensuring appropriate risk management.
- Adjustments: Be prepared to adjust the strategy if the price action does not confirm the pattern as expected.
Example of Using the PCZ
Pattern: Bullish Gartley Pattern Time Frame: 4-hour chart
- Pattern Identification:
- Recognize the formation of a bullish Gartley pattern, characterized by specific Fibonacci retracement and extension levels.
- Defining the PCZ:
- Calculate the PCZ using Fibonacci levels (e.g., the 78.6% retracement of the XA leg for the D point).
- Entry and Exit Strategy:
- Entry Point: Place a buy order as the price action confirms reversal within the PCZ, often at the D point of the Gartley pattern.
- Stop-Loss: Set a stop-loss just below the X point to manage risk.
- Take-Profit: Set take-profit levels at key Fibonacci extension levels or previous resistance levels.
- Risk Management:
- Ensure position size aligns with the defined risk tolerance, considering the distance to the stop-loss and potential reward.
Advantages and Challenges
Advantages:
- Predictability: The PCZ provides a clear area to focus on for potential trade entries, improving precision.
- Risk Management: Allows for well-defined stop-loss and take-profit levels.
- Versatility: Applicable to various chart patterns and time frames.
Challenges:
- Pattern Recognition: Requires skill and experience to accurately identify and confirm patterns.
- False Signals: The market may not always respect the PCZ, leading to false breakouts.
- Market Conditions: Highly volatile or news-driven markets can disrupt pattern formations.
By integrating the concept of the Pattern Completion Zone into their trading strategies, forex traders can enhance their ability to identify high-probability setups, manage risk effectively, and improve overall trading performance.
About this Article
This article is the part taken from the draft version of the Book: Guide to Precision Harmonic Pattern Trading (Mastering Turning Point Strategy for Financial Trading). This article is only draft and it will be not updated to the completed version on the release of the book. However, this article will serve you to gather the important knowledge in financial trading. This article is also recommended to read before using Harmonic Pattern Plus, Harmonic Pattern Scenario Planner and Profitable Pattern Scanner, which is available for MetaTrader or Optimum Chart.
Below is the landing page for Harmonic Pattern Plus, Harmonic Pattern Scenario Planner and Profitable Pattern Scanner in MetaTrader. All these products are also available from www.mql5.com too.
https://algotrading-investment.com/portfolio-item/harmonic-pattern-plus/
https://algotrading-investment.com/portfolio-item/harmonic-pattern-scenario-planner/
https://algotrading-investment.com/portfolio-item/profitable-pattern-scanner/
Below is the landing page for Optimum Chart (Standalone Charting and Analytical Platform).
https://algotrading-investment.com/2019/07/23/optimum-chart/
Related Products


