Trading Setup with Pattern Completion Interval
We covered sufficient details about Pattern Completion Interval (aka Pattern Completion Zone) in the previous chapters. For your information, pattern completion zone and pattern completion interval is the same thing. In short, Pattern Completion Interval is the tolerance limit at the final point D. Figure 4-1 illustrates Pattern Completion Interval visually in the chart. In Figure 4-1 below, if the price at pattern detection candle went below the lower tolerance limit 1.30173, then the pattern would be not qualified as a valid Harmonic Pattern. Since the price stayed within the Pattern Completion Interval, the pattern formation was successful and so it was for your trading too if you trade with this pattern. We are currently using our Tolerance Limit 5%. This gave us 19 pips range between upper and lower limit. You can see that the low at pattern detection candle just touched 1.30173 and in fact the low can touch anywhere inside our Pattern Completion Interval as long as they do not move below 1.30173. Now let us do some experiment with tolerance limit 10%.

Figure 4-1: Pattern Completion Interval for EURUSD with tolerance limit 5% (Box Range = 19 pips).
You will expect that the increase in tolerance limit will widen the range between upper and lower limit. With tolerance limit 10%, the range become doubled to 38 pips. In Figure 4-2, we can see that low at pattern detection candle is in fact pretty inside our Pattern Completion Interval.
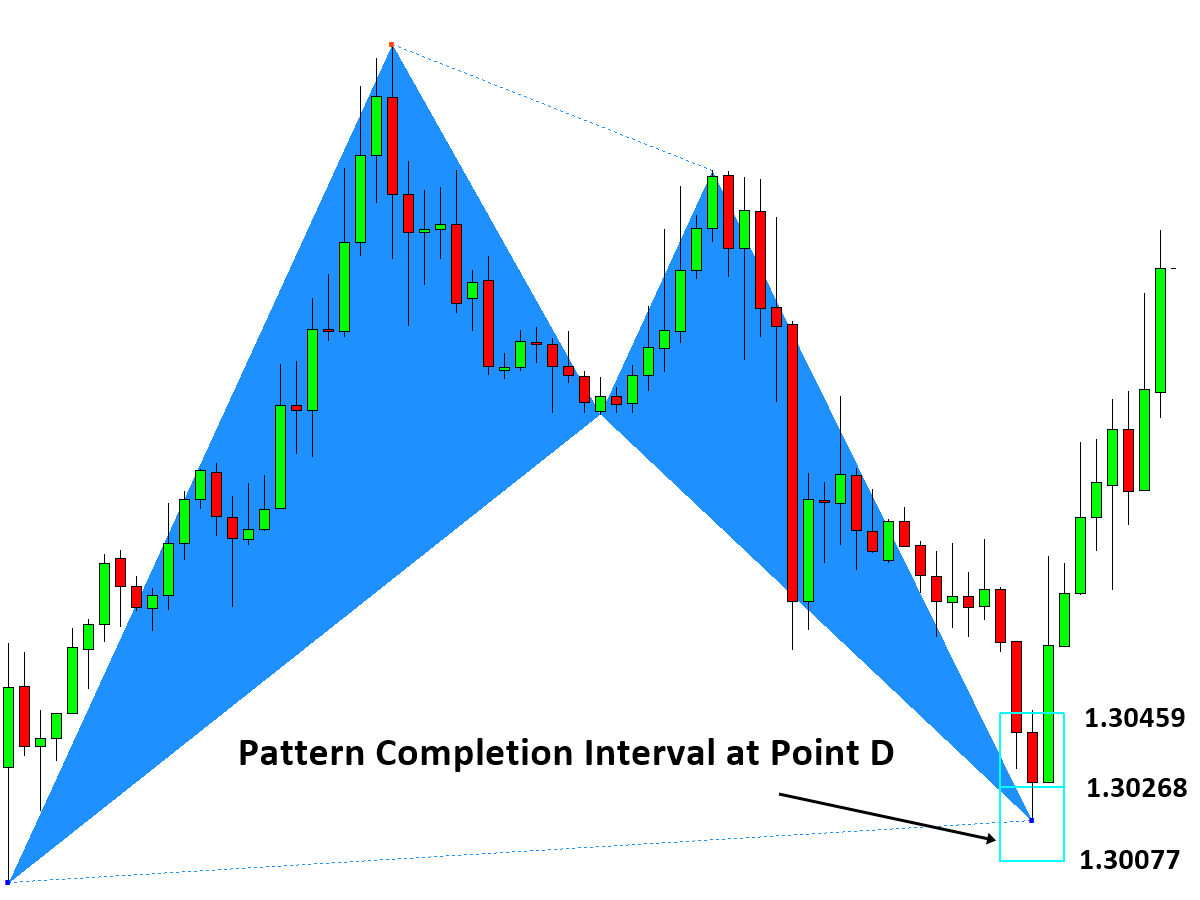
Figure 4-2: Pattern Completion Interval with tolerance limit 10% (Box Range = 38 pips).
At this point, you might wonder what the good tolerance limit is for Pattern Completion Interval. Since the Pattern Completion Interval is a new concept, google search is not that useful. We will not find any useful literature for this from our public library either. The best approach is probably to seek some reference from some other industries. Many industries including engineering, finance, business like to use 90%, 95% and 99% or 1%, 5% and 10% criteria. For example, in statistics, 1%, 5% and 10% are the common probability limit to reject the null hypothesis over some statement. This might be good reference point to start with. Since we need our tolerance limit to reject the ugly patterns, whose ratios does not match the ideal Fibonacci ratio well, statistical tolerance limit have some close proximity to our application. However, these statistical probabilities assume the normal probability distribution of data. In our pattern matching exercise, it is difficult to assume any normality for our tolerance limit. Since we are traders, we will not drill down much of these theories. However, it is still good to know that other industry make good use of tolerance limit in their application.

Figure 4-3: Tolerance limit example in statistical application.
Another good reference point we can count about tolerance limit is the mechanical engineering industry. In the mechanical engineering industry, tolerance limit is heavily used for design and engineering purpose. Often tolerance means that the physical tolerance limit for the dimension of the object. The main purpose of this type of tolerance limit is that the object must fit precisely to another object. For example, gear must fit precisely to shaft so they can function properly for engine. Otherwise, the design fails and waste the materials. The safety cannot be guaranteed for your car. Most of time, the tolerance limit in the mechanical engineering industry is measured in meters, centimeters and millimeters. Since we are using ratio instead of dimension unit, our mechanical engineering example is not the perfect match for our application either.
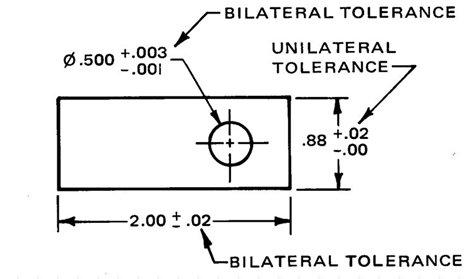
Figure 4-4: Tolerance limit example in mechanical engineering industry.
Since our pattern scanning is unique task, we can only use above references, from statistical and mechanical engineering industry, as the rough guideline. However, it is much better to have something than not. Since we are dealing with many Fibonacci ratios, expressing our tolerance limit with percent is more convenient than expressing them with decimal numbers. To give you some ideas, using 1% or 5% tolerance limit make much more sense and much more applicable across the entire Fibonacci ratios, 0.618, 0.382, 1.27, 0.786, 1.27, etc. If you are using 0.001 or 0.002 decimal numbers, then soon you will find that your tolerance limit is not equally sized for different Fibonacci numbers. Let us avoid the problem by choosing percent.
Although we cannot claim it with beautiful normal distribution, we can still make use of some good percentage numbers 1%, 5% and 10% from our old school as our tolerance limit for our pattern completion interval. Since we want to pick up reasonably good-looking patterns matching to the ideal pattern, our choice for 1%, 5% and 10% are not bad. If the final point D of the pattern is out over 10%, then the flawed pattern will be quite notable visually too. We can use some complicated statistical approaches for the pattern identification task. However, there is absolutely no need to overcomplicate things for traders. We will explain why our percent tolerance limit is sufficient for us in next couple of paragraphs.
Our tolerance limit for Pattern Completion Interval is two-sided symmetric tolerance. In fact, 1%, 5% and 10% will correspond to 0.5%, 2.5% and 5% respectively. You will find that you will get too few patterns qualified with 0.5% and 2.5% tolerance limit. 5% might be good choice. Since some industries use tolerance limit of 20%, 10% can be usable tolerance limit. Normally it is not great idea to use tolerance limit over 10%. With tolerance limit over 10%, qualified patterns will not pass your visual inspection since their final point D is deviated too much from the ideal level. From our experience, tolerance limit in between 5% and 10% are quite acceptable.
As we discussed before, we need the Pattern Completion Interval to deal with approximation error. At the same time, it can serves as our criteria to qualify the detected patterns. Since we are traders, we are more interested in the second point. Indeed our Pattern Completion Interval can serve as your first consideration for your stop loss. For example, the lower limit 1.30077 in Figure 4-2 can be considered as your stop loss for your buy position since the pattern formation will fail if the price goes below 1.30077 level. In fact, it is not logical to hold your position after the pattern is failed to form although you can still do that. You can still hold your position even after the failure of the pattern formation. In that case, you have to increase the size of stop loss at the same time reducing your Reward/Risk ratio. In general, it is not sensible idea to hold you position this way.
Since we are using Pattern Completion Interval as our stop loss, we could make use of our Pattern Completion Interval for our take profit too. The sensible way of putting it together is to use the Pattern Completion Interval as the building block of take profit and stop loss. For example, we can use multiple of Pattern Completion Interval Range to express our Stop Loss and Take Profit as shown in Figure 4-5. In the example in Figure 4-5, we use stop loss and take profit in 1 times Pattern Completion Interval Range. Therefore, the size of stop loss and take profit are 38 pips since we are using 10% tolerance limit. Since take Profit and stop loss are equal, our Reward/Risk is one. In real trading, Reward/Risk will be little less than one since you have to pay commission. The great news is that our stop loss is quite affordable. Since this is based on 10% tolerance limit, we will have even smaller stop loss size if you choose 5% tolerance limit. Well, of course, the advantage comes from the fact that we have measured precisely the tolerance limit for our pattern formation. Therefore, in our stop loss, there is not too much excessive assumption to eat up our Reward/Risk ratio.
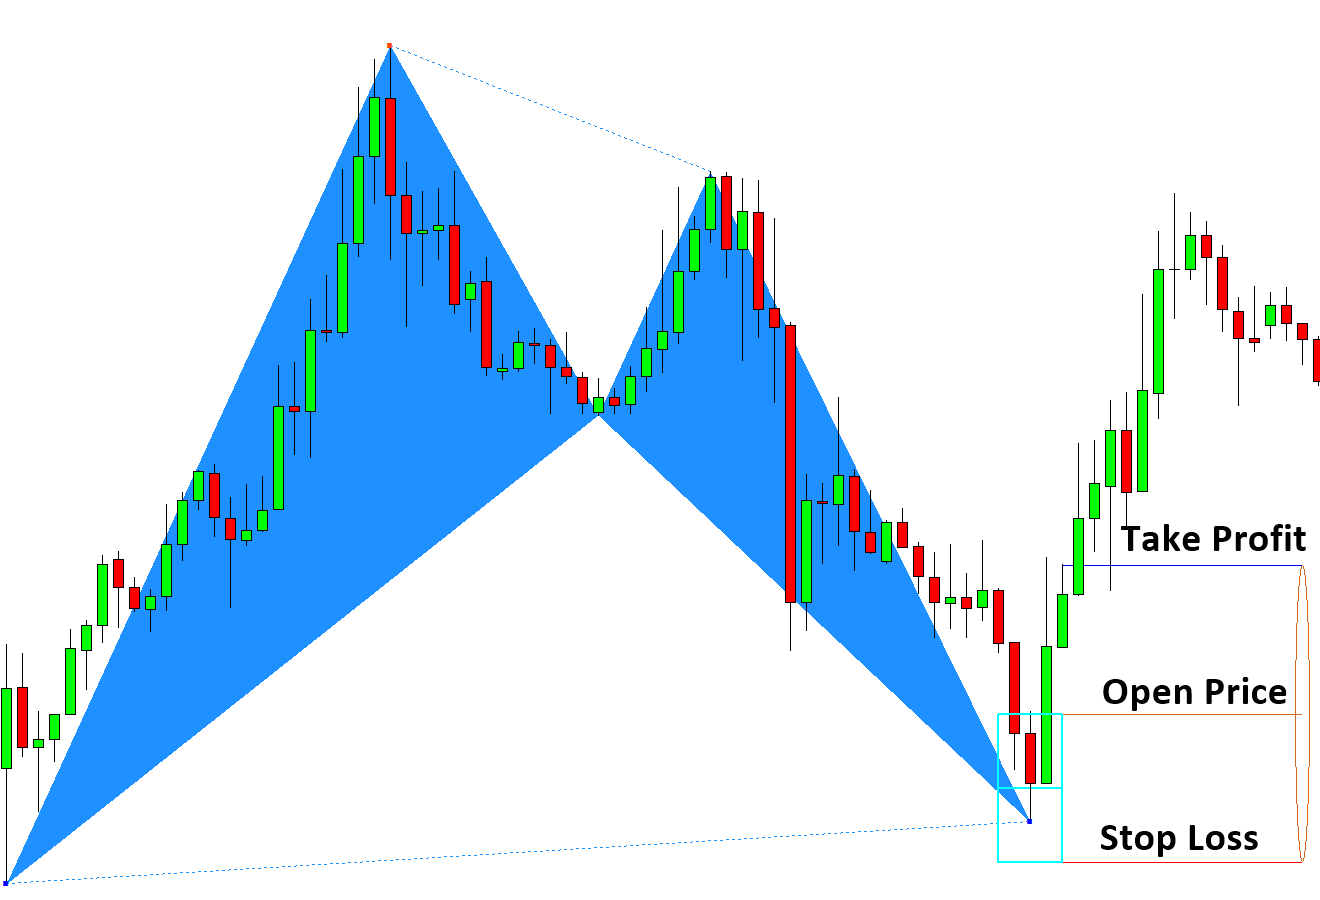
Figure 4-5: Stop loss and take profit expressed in Pattern Completion Interval 10% (i.e. Reward/Risk=1).
Since we prefer higher Reward/Risk, you can in fact use greater take profit like 2 or 3 times Pattern Completion Interval Range. Figure 4-6 shows take profit with 3 times Pattern Completion Interval Range with tolerance limit 5%. We can see that our take profit level is well below 61.8 % retracement of CD leg in Figure 4-6. The most important take away here is that we have formulated our stop loss level in a way that we do not need a lot of momentum after the turning point. It is very difficult to predict how much momentum we will have after the turning point. If your stop loss is too wide, then you can not win without having a good momentum in your trading direction. With our stop loss formula, your concern about having good momentum can be dramatically reduced. This means that you can be profitable even if you have small retracement after the appearance of our final point D. So far, we have covered the risk formulation using Pattern Completion Interval for your trading. We have not covered about the median open price yet. In the next part, we will discuss how to apply this risk formulation in real world trading for the favourable outcome for traders. We will also explain the concept over the median open price as well as order execution mode in details.
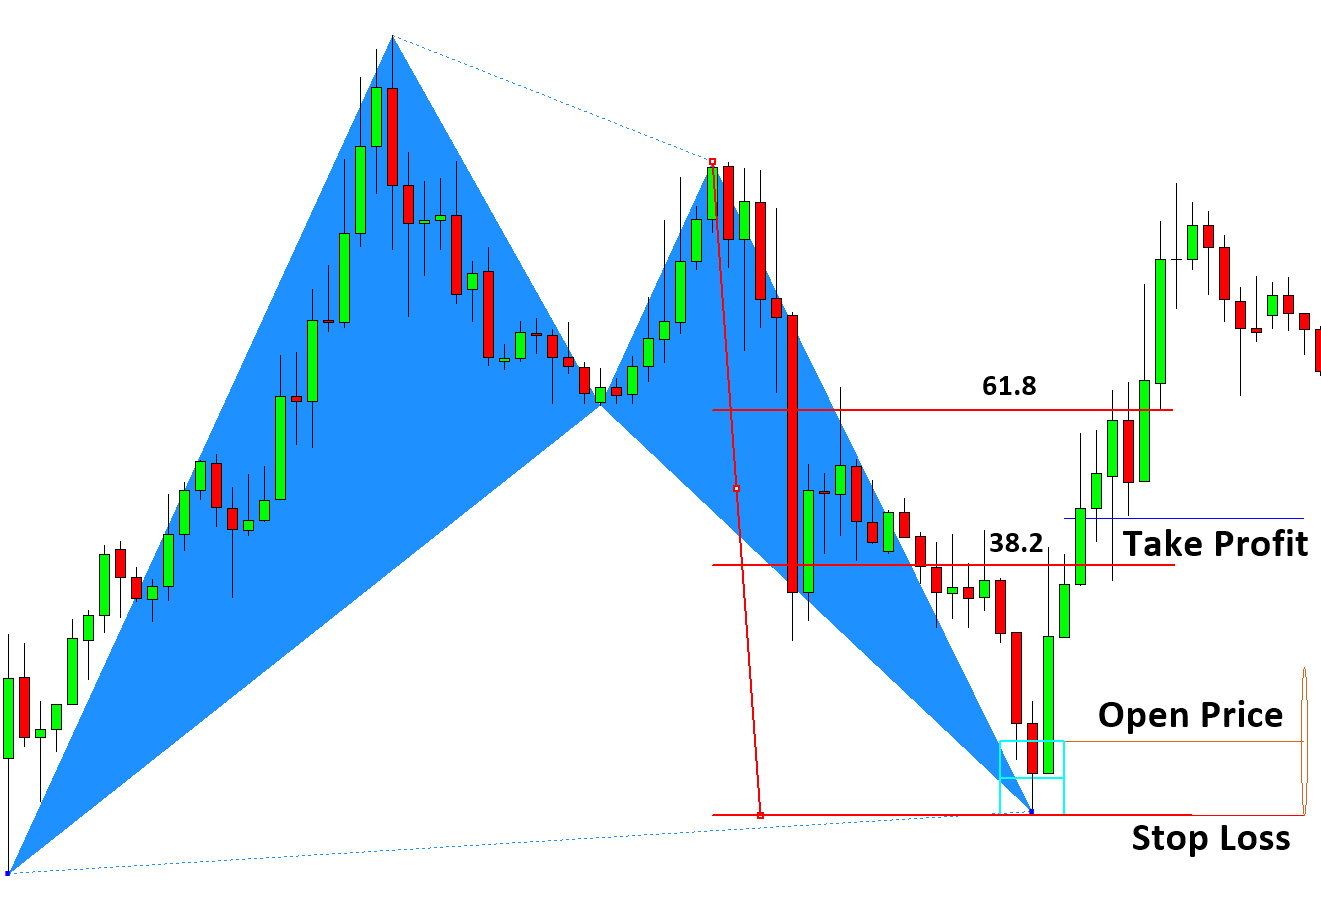
Figure 4-6: Stop loss and take profit expressed in Pattern Completion Interval 5% (i.e. Reward/Risk=3).
Some More Tips about Trading Setup with Pattern Completion Zone
A trading setup with a pattern completion zone in forex trading involves identifying and acting upon the completion of specific chart patterns. This setup is particularly useful for traders who rely on technical analysis to predict future price movements based on historical price patterns. Here’s a detailed guide on how to use this approach:
Key Concepts
- Pattern Completion:
- Description: The point at which a chart pattern has fully formed and a potential trading opportunity is identified.
- Common Patterns: Head and Shoulders, Double Top/Bottom, Triangles, Flags, Pennants, Butterfly, Gartley, Bat, Alternate Bat, AB=CD, Shark, Crab, Deep Crab, Cypher, 5-0 Patterns, 3 Drives Pattern, etc.
- Completion Interval:
- Description: The time frame or number of price bars/candlesticks within which the pattern is expected to complete and a trading signal is generated.
- Importance: Helps traders time their entries and exits more accurately, reducing the risk of false signals.
Steps for Setting Up a Trading Strategy with Pattern Completion Interval
- Identify the Pattern:
- Trend Analysis: Determine the prevailing trend (uptrend, downtrend, or sideways) and look for potential patterns forming within that trend.
- Pattern Recognition: Use technical analysis tools to identify chart patterns. This can be done manually or with the help of pattern recognition software.
- Define the Completion Interval:
- Time Frame Selection: Choose the appropriate time frame for your trading strategy (e.g., 1-hour, 4-hour, daily charts).
- Set Parameters: Determine the number of bars/candlesticks or the time period within which the pattern should complete. For instance, a head and shoulders pattern on a daily chart might have a completion interval of 10 to 15 days.
- Confirm Pattern Completion:
- Technical Indicators: Use indicators like Moving Averages, MACD, RSI, and Volume to confirm the pattern completion.
- Breakout Confirmation: For patterns like triangles and flags, look for a breakout above resistance or below support to confirm completion.
- Entry and Exit Points:
- Entry Signal: Place a trade when the pattern completes and confirmation signals align. For example, enter a short position at the neckline break of a head and shoulders pattern.
- Stop Loss: Set a stop-loss order to manage risk. This could be placed above the high/low of the pattern or at a specific percentage away from the entry point.
- Take Profit: Determine your profit targets based on the pattern’s projected price movement. For example, the distance from the head to the neckline in a head and shoulders pattern can be used to estimate the potential price decline.
- Monitor and Adjust:
- Trade Management: Continuously monitor the trade and adjust stop-loss and take-profit levels as needed based on market conditions and price action.
- Re-Evaluation: If the market does not move as expected within the completion interval, reassess the trade setup. The pattern may be invalid or require a different approach.
Example of a Trading Setup
Pattern: Head and Shoulders (Bearish Reversal) Completion Zone: 10-15 daily bars
- Identify the Pattern:
- Spot a head and shoulders pattern forming on the daily chart of EUR/USD.
- Define the Completion Zone:
- Expect the right shoulder to complete within 10-15 days.
- Confirm Pattern Completion:
- Use the MACD to confirm bearish momentum as the price approaches the neckline.
- Look for increased volume on the breakdown of the neckline.
- Entry and Exit Points:
- Entry: Place a sell order just below the neckline after a confirmed daily close below it.
- Stop Loss: Set a stop-loss order above the right shoulder.
- Take Profit: Measure the distance from the head to the neckline and project it downward from the breakout point to set the take-profit level.
- Monitor and Adjust:
- Track the trade’s progress, adjusting the stop-loss to breakeven once the trade moves favorably.
- If the price fails to continue downward, consider exiting the trade early.
Advantages and Challenges
Advantages:
- Predictability: Established patterns provide a structured approach to trading.
- Risk Management: Clear entry, stop-loss, and take-profit levels help manage risk.
- Versatility: Applicable across different time frames and currency pairs.
Challenges:
- Pattern Recognition: Requires skill in accurately identifying patterns.
- False Breakouts: Can lead to losses if breakouts fail.
- Market Conditions: Patterns may not perform well in highly volatile or news-driven markets.
By incorporating pattern completion intervals into their trading strategies, forex traders can enhance their ability to identify high-probability setups and manage trades more effectively.
About this Article
This article is the part taken from the draft version of the Book: Guide to Precision Harmonic Pattern Trading (Mastering Turning Point Strategy for Financial Trading). This article is only draft and it will be not updated to the completed version on the release of the book. However, this article will serve you to gather the important knowledge in financial trading. This article is also recommended to read before using Harmonic Pattern Plus, Harmonic Pattern Scenario Planner and X3 Chart Pattern Scanner, which is available for MetaTrader or Optimum Chart.
Below is the landing page for Harmonic Pattern Plus, Harmonic Pattern Scenario Planner and X3 Chart Pattern Scanner in MetaTrader. All these products are also available from www.mql5.com too.
https://algotrading-investment.com/portfolio-item/harmonic-pattern-plus/
https://algotrading-investment.com/portfolio-item/harmonic-pattern-scenario-planner/
https://algotrading-investment.com/portfolio-item/profitable-pattern-scanner/
Below is the landing page for Optimum Chart (Standalone Charting and Analytical Platform).
https://algotrading-investment.com/2019/07/23/optimum-chart/
Related Products


