The Five Regularities in the Financial Market
The Financial Market is the place where different investors are trading securities like equities, bonds, currencies, and derivatives. It is the market place to facilitate the exchange of securities between buyers and sellers. Loosely speaking, the financial market works like the auction market where buyers enter competitive bids and where sellers enter competitive offers at the same time. However, unlike auction market, in the financial market securities are often traded without delivering actual physical goods. Although some companies can use financial market to hedge their physical positions, in this book, we will assume that you are more of speculator who wants to profit from the market dynamics. Various buyers and sellers with different attributes, different geographic location, different purchasing power and different financial goals, forms the daily transactions of the financial market. Therefore, the dynamics of financial market can be represented as the crowd behaviour. It is not necessarily perfectly rational place but the fundamentals play some important role behind the market dynamics up to some degree.
For traders and investors, it is important to develop the right trading strategy for specific market. Good trading strategy never comes blindly. Understanding the underlying dynamics for the financial market is the key requirement to build a solid trading strategy. Then, what is the underlying dynamics for the financial market and how can we study them to benefit our trading and investment? Scientists had a strong interest in the dynamics of the financial market for many decades. They have extensively studied the dynamics of the price series in the Stocks and Forex market. The simplest but most effective way to study the dynamics might be the decomposition approach. In decomposition, literarily we are breaking down some complex system into the simple and digestible bits. Then we use this decomposed bits to predict the behaviour of the complex system.
When we apply the decomposing technique, the price series can be decomposed into several sub price patterns. In fact, the sub price patterns are the regularities that constitute the dynamics of the financial price series (Figure 3-1). For trading and investment, we make use of the knowledge of these regularities to predict up or down movement of the financial market. All the known trading strategies, including simple and complex ones, are based on some of these regularities existing in the price series. Remember that none of trading strategies is merely created to offer you just some luck or based on some random theory.

Figure 3-1: The concept of the decomposition for the financial price series.
In Figure 3-1, what could be the pattern 1, pattern 2, pattern 3 and pattern N making up the real world financial price series? Yet, many different version of explanations exist to describe the price patterns in the financial market. Among them, Gardner’s version considers the trend and seasonality as the main patterns of the price series (Gardner, 1987, p175). Many traders are already familiar with trend in the financial markets. For example, many technical indicators like exponential moving average and MACD were developed to visualize trend. Seasonality is literally seasonal fluctuations in the market. It is also used by many traders. For example, because the sales of Ice Creams increase during summer, stock price for Ice Creams Company can go up due to the increased profits during summer. This sort of patterns will make up the seasonal fluctuations. The Gardner’s framework is intuitive and easy to understand because trend and seasonality are the backbone of many techniques used for the univariate price series in many scientific fields. Although Gardner’s framework does not mention about random process explicitly, his framework already assumed that any price series include some random process.
Depending on their underlying dynamics, the price series can show the multitude of behaviours because real world price series are made up from different magnitude of each price pattern. For example, sometimes, the price series can exhibit strong trend without seasonality and vice versa. Sometimes the price series can exhibit some trend with some seasonality. In the Gardner’s trend-seasonality framework, we can generate twelve different behaviour of the price series by combining the basic trend and seasonal patterns as shown in Figure 3-2. Scientist uses this framework to categorize many real world price series for prediction purpose. Then, what is the real value of the Price Pattern Table in Figure 3-2 for traders? As a trader, we can develop trading strategies to capture these price patterns for profiting purpose. These patterns in price series are regularities, which help us to predict the price series into the future. Financial trading is based on our prediction for the future market. We buy EURUSD because we predict that EURUSD have the high chance to go up. We sell EURUSD because we predict that EURUSD have the high chance to go down. If we understand the regularities of the financial market better, then we can make better trading and investment decision too.
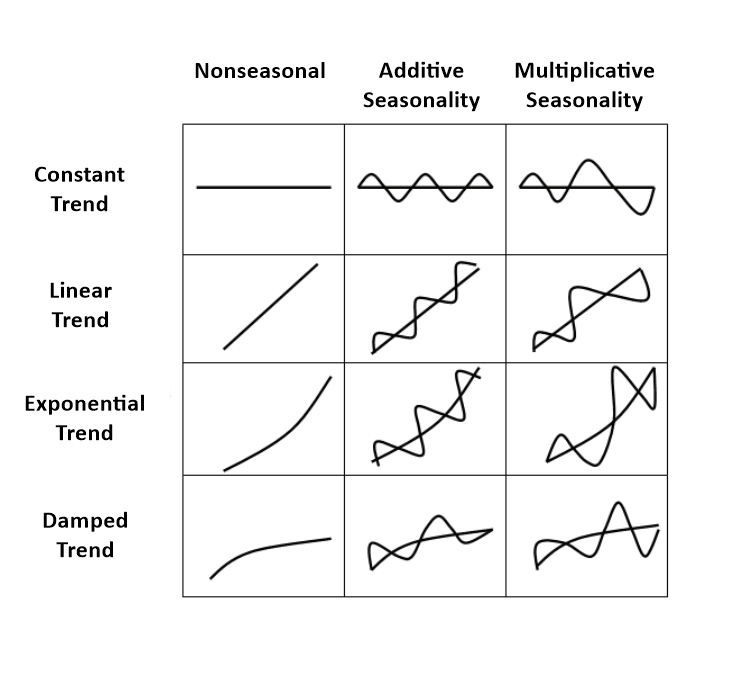
Figure 3-2: The original Gardner’s table to visualize the characteristics of different time series data (Gardner, 1987, p175).
In spite of the fact that trend and seasonality are the important price patterns in the financial market, practically the entire financial market will not fit to this trend-seasonality framework alone. If the market was so predictable with these two components only, then traders and investors were able to make money much easier. Maybe you can also take advantage on buying shares of Ice Cream Company during April and selling them late August. If the pattern is there, then you should do that. However, in the highly competitive and liquid financial market, this is not the case. In many cases, the trend and seasonality might be the less significant components in the financial price series in the Stock Market and Forex in comparison to the data obtained from the business and social studies. The Gardner’s trend and seasonal framework can work well for business and some social data but it might be oversimplified for the case of the financial markets.
Instead of the two components framework with trend and seasonality, in this book, we propose the three components framework. The three components include Equilibrium process (trend), Wave process (cycle) and Fractal-Wave process. These three components can serve to better conceptualize the basic price patterns existing in the financial price series. Just like the trend and seasonal components in the Gardner’s framework, these three components are the building blocks to explain more complex price patterns in the financial price series and to predict the future movement of the price series. Just to convey our idea, we will explain these three components in brief, before we expand each in more details from the next chapter.
The Equilibrium process is equivalent to the trend in the Gardener’s framework. However, it is also the same term “equilibrium” used in the supply- demand economic theory. Literarily it is the market force moving in one direction. Wave process is any cyclic patterns repeating in the fixed time interval. Wave process includes the concepts of additive and multiplicative seasonality in the Gardner’s model. Furthermore, Wave process includes other complex cyclic behaviour, which can be described with the multiple of combined sine and cosine waves. Finally, the Fractal-Wave process is the representation of the Fractal geometry in the time dimension. Therefore, it is the self-similar repeating patterns in different scales. In plain language, Fractal-Wave process refers to the repeating patterns.
Just as Gardner visualized the possible combinations of trend and seasonality in three columns in Figure 3-2, we can visualize the possible combinations of these three components in five columns. In Figure 3-3, first three columns including Equilibrium Process (trend), Additive Seasonality, and Multiplicative Seasonality are identical to the Gardner’s three columns. Fourth column includes any simple and complex cyclic patterns, which can be described with the combined sine and cosine waves. Fifth column describes the Fractal-Wave process with Equilibrium process. Each column represents a distinctive regularity with its own behaviour. We can describe the five columns as the five regularities in the financial market (Figure 3-3 and Figure 3-4).
One most obvious distinction among the five regularities is that each regularity has the distinctive number of cycle periods as shown in Figure 3-5. First regularity (trend) does not have any cycle period. Second and Third Regularity have very few cycle periods. Fourth Regularity tends to have more cycles but the number of cycles is still finite. The Fifth Regularity can be characterized by the infinite number of cycles because the repeating patterns can have the infinitely varying scales. Therefore, it becomes very clear that we need to use different tactics when we deal with each regularities.
Especially, the fifth regularity is the underlying process behind many horizontal and diagonal price pattern used by the financial trader. The horizontal and diagonal price pattern can include the popular price patterns like support, resistance, harmonic patterns, Elliott Wave patterns, Triangle, Wedge and Channels, etc. This book mainly focuses on the fifth regularity because the fifth regularity is the main price dynamics behind Price Action and Pattern Trading. In the book, we want to help you to understand the clear difference between this fifth regularity and the rest. We will focus to cover the practical trading knowledge for this fifth regularity. Finally, we will help you to learn the Price Action and Pattern Trading in the practical level.
From next chapter, we will describe the sub price patterns under these five regularities in details (Figure 3-6). Especially, we will focus to explain the combined price patterns like Equilibrium Wave process (trend and cycle) and Equilibrium Fractal-Wave process (trend and fractal wave). It is because the real world financial markets are likely to possess one of these complex patterns than simple one. We will try our best to visualize these price patterns for your trading.
After we have covered all the sub price patterns in next few chapters, we will move to the practical part focusing on the fifth regularity for your trading. The fifth regularity is the least understood but most confused price patterns among traders comparing to the rest of the regularities. Especially, the characteristic of the infinite cycle period tells us that many technical indicator, we were using without any doubt, can reduce your profitability marginally. When you can not differentiate these price patterns, these technical indicators can do more harm than good to you. We will look at the increasingly popular trading strategies in addition. We will start with the support and resistance to introduce some fundamental trading knowledge. Then we will further expand it with the popular trading strategies like Harmonic Pattern, Elliott Wave, Triangle, and Wedge patterns. These trading strategies are over 80 years old and used by many reputable traders in the world.
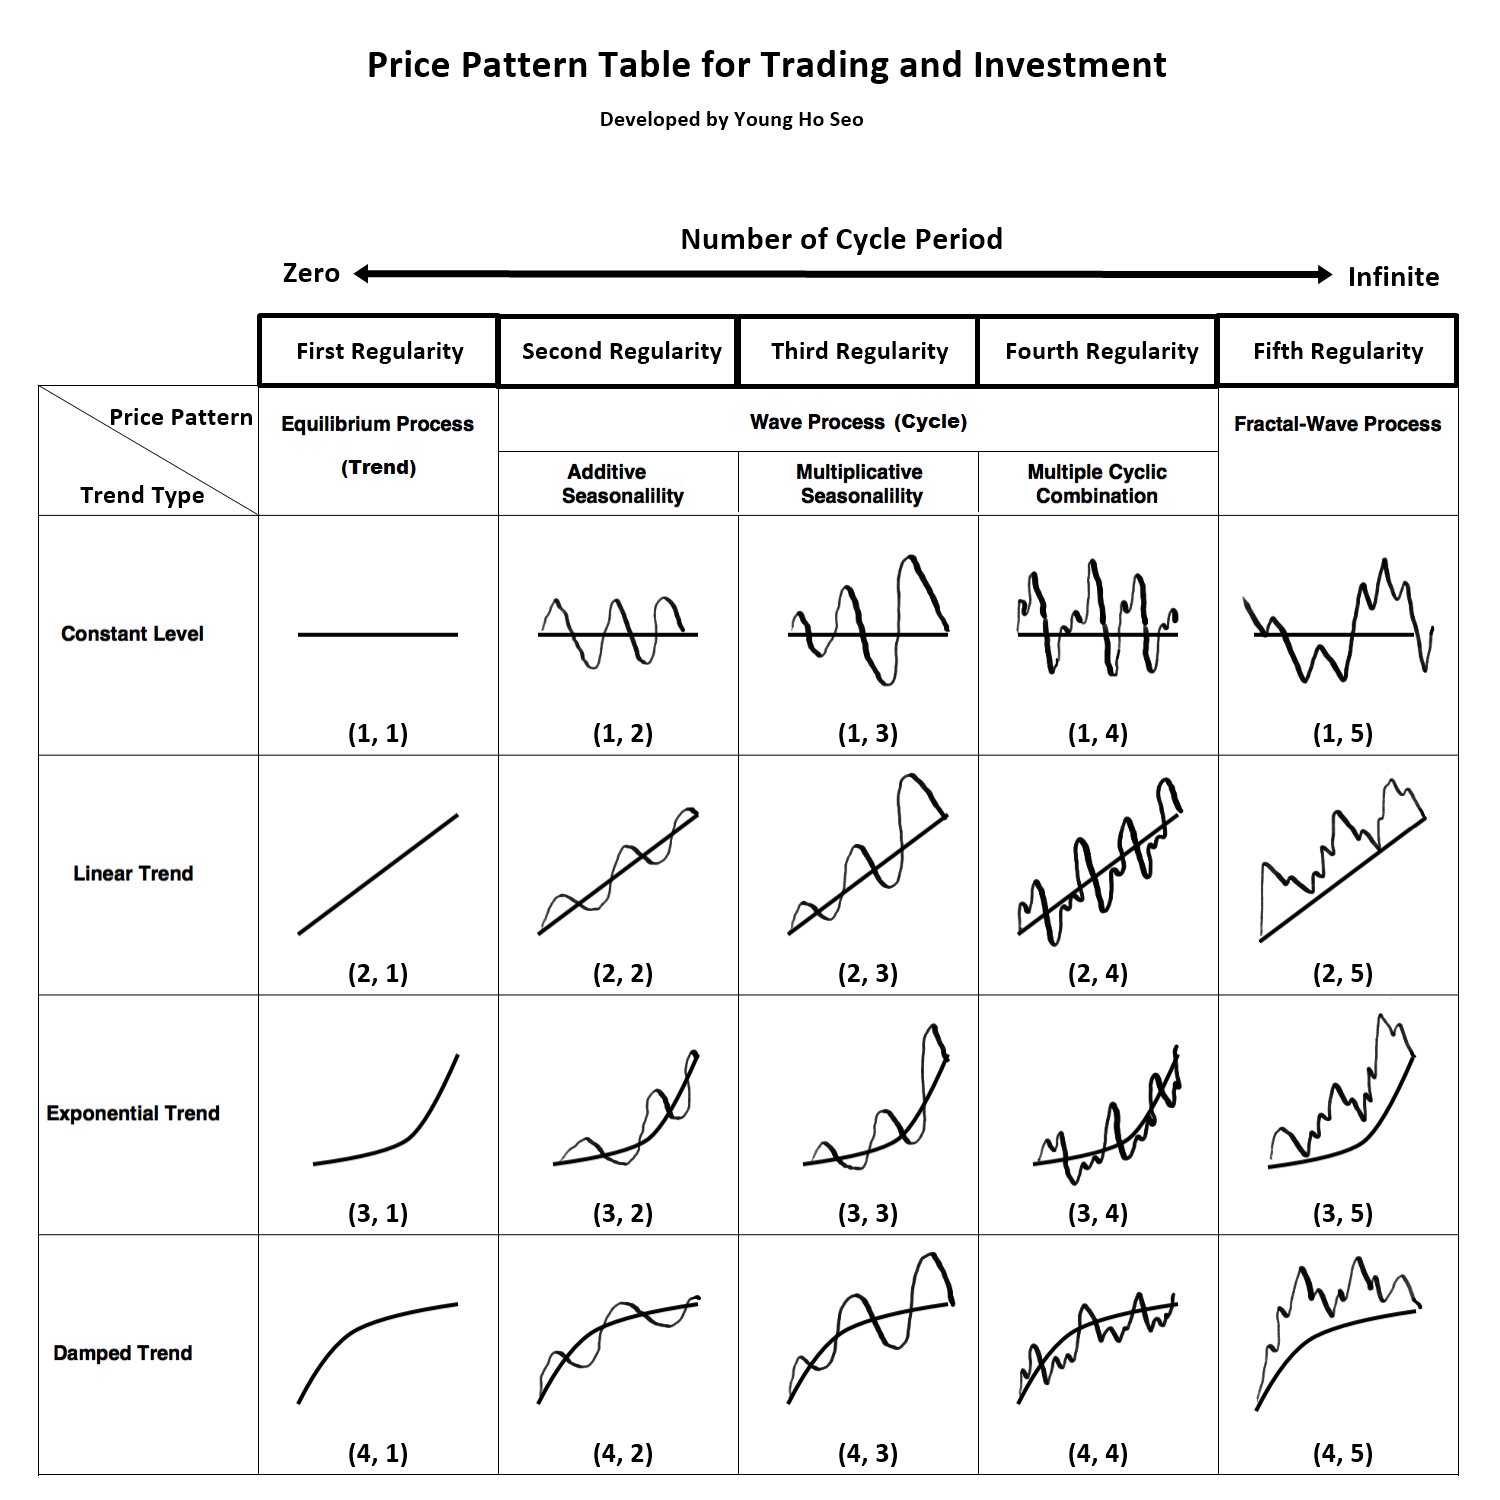
Figure 3-3: Five Regularities and their sub price patterns with inclining trend, cycle, and fractal wave. Each pattern can be referenced using their row and column number. For example, exponential trend pattern in the third row and first column can be referenced as Pattern (3, 1) in this table.
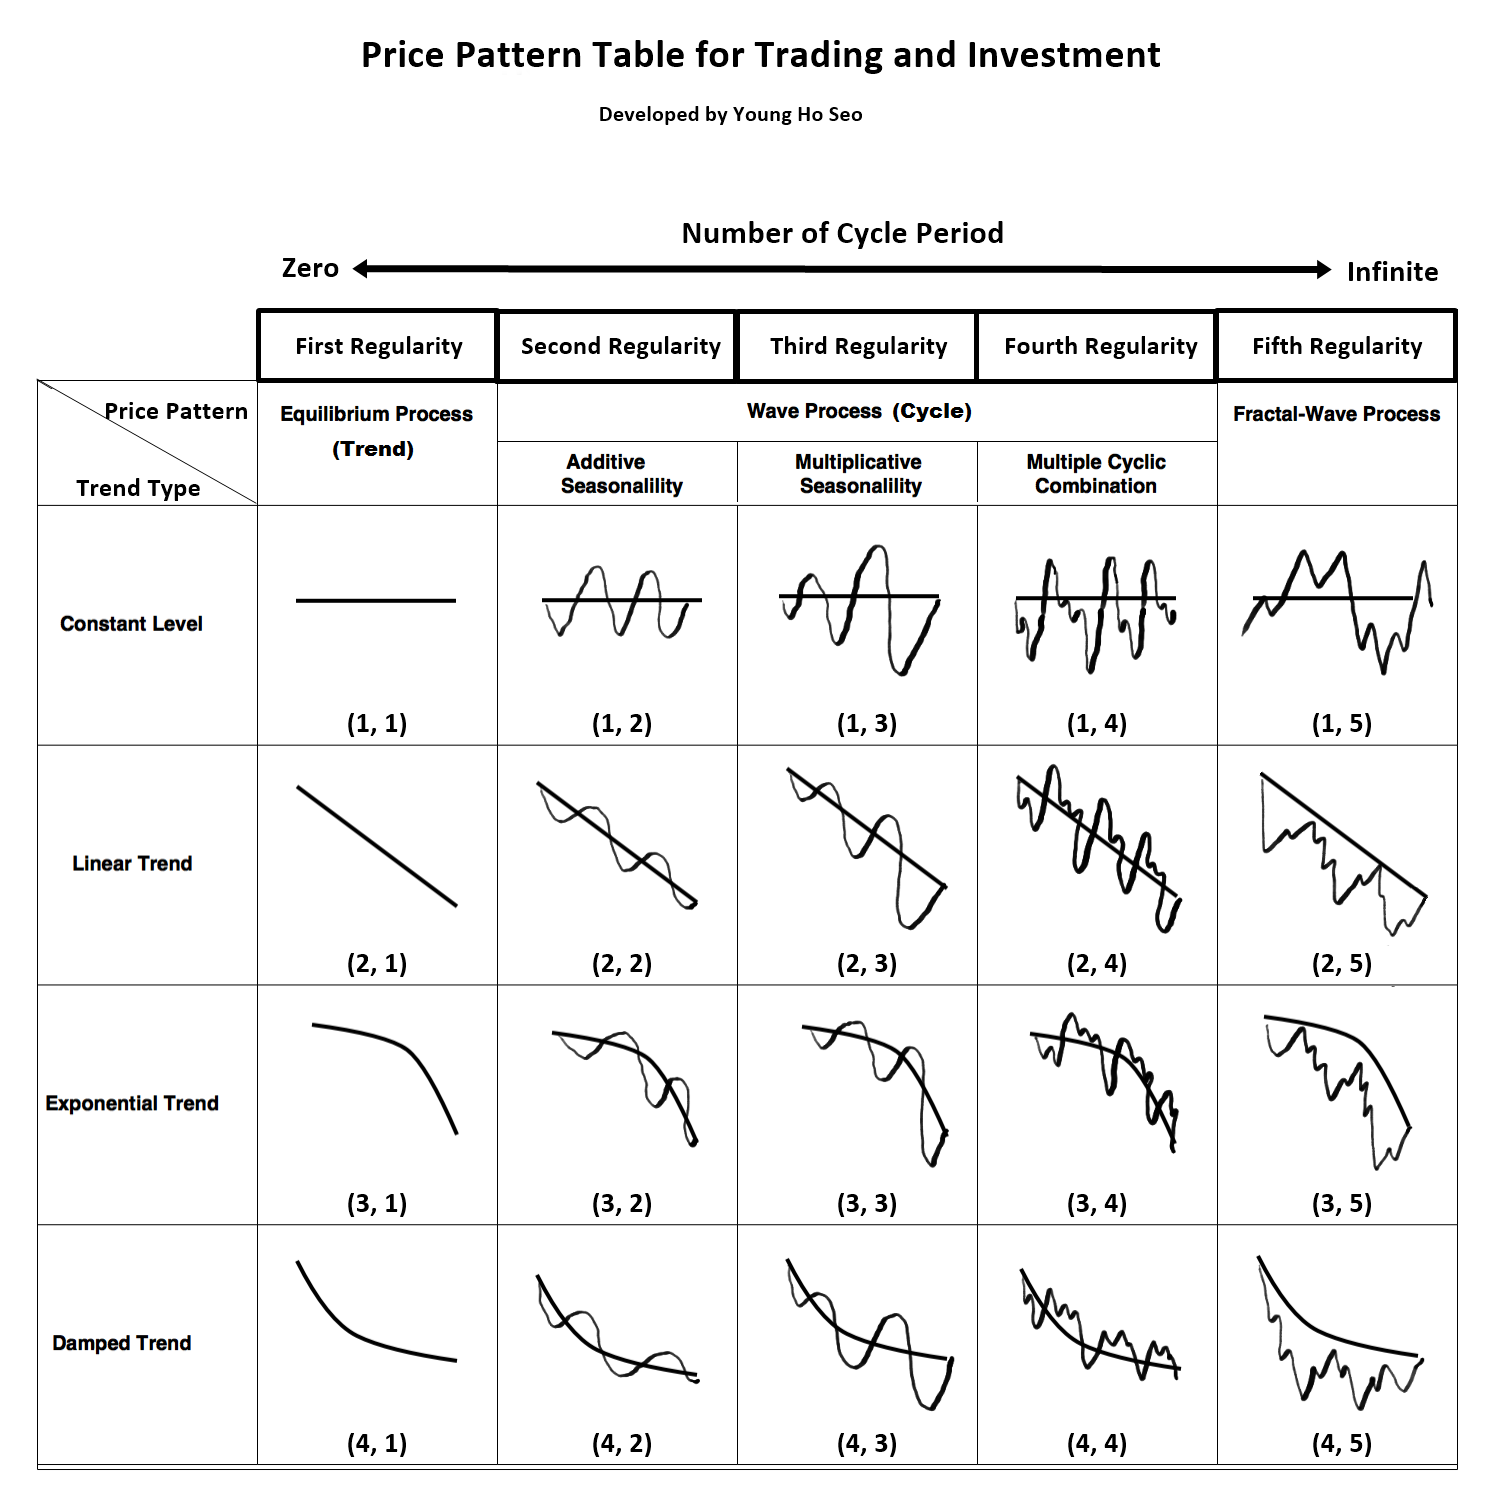
Figure 3-4: Five Regularities and their sub price patterns with declining trend, cycle, and fractal wave. Each price pattern can be referenced using their row and column number. For example, exponential trend pattern in the third row and first column can be referenced as Pattern (3, 1) in this table.
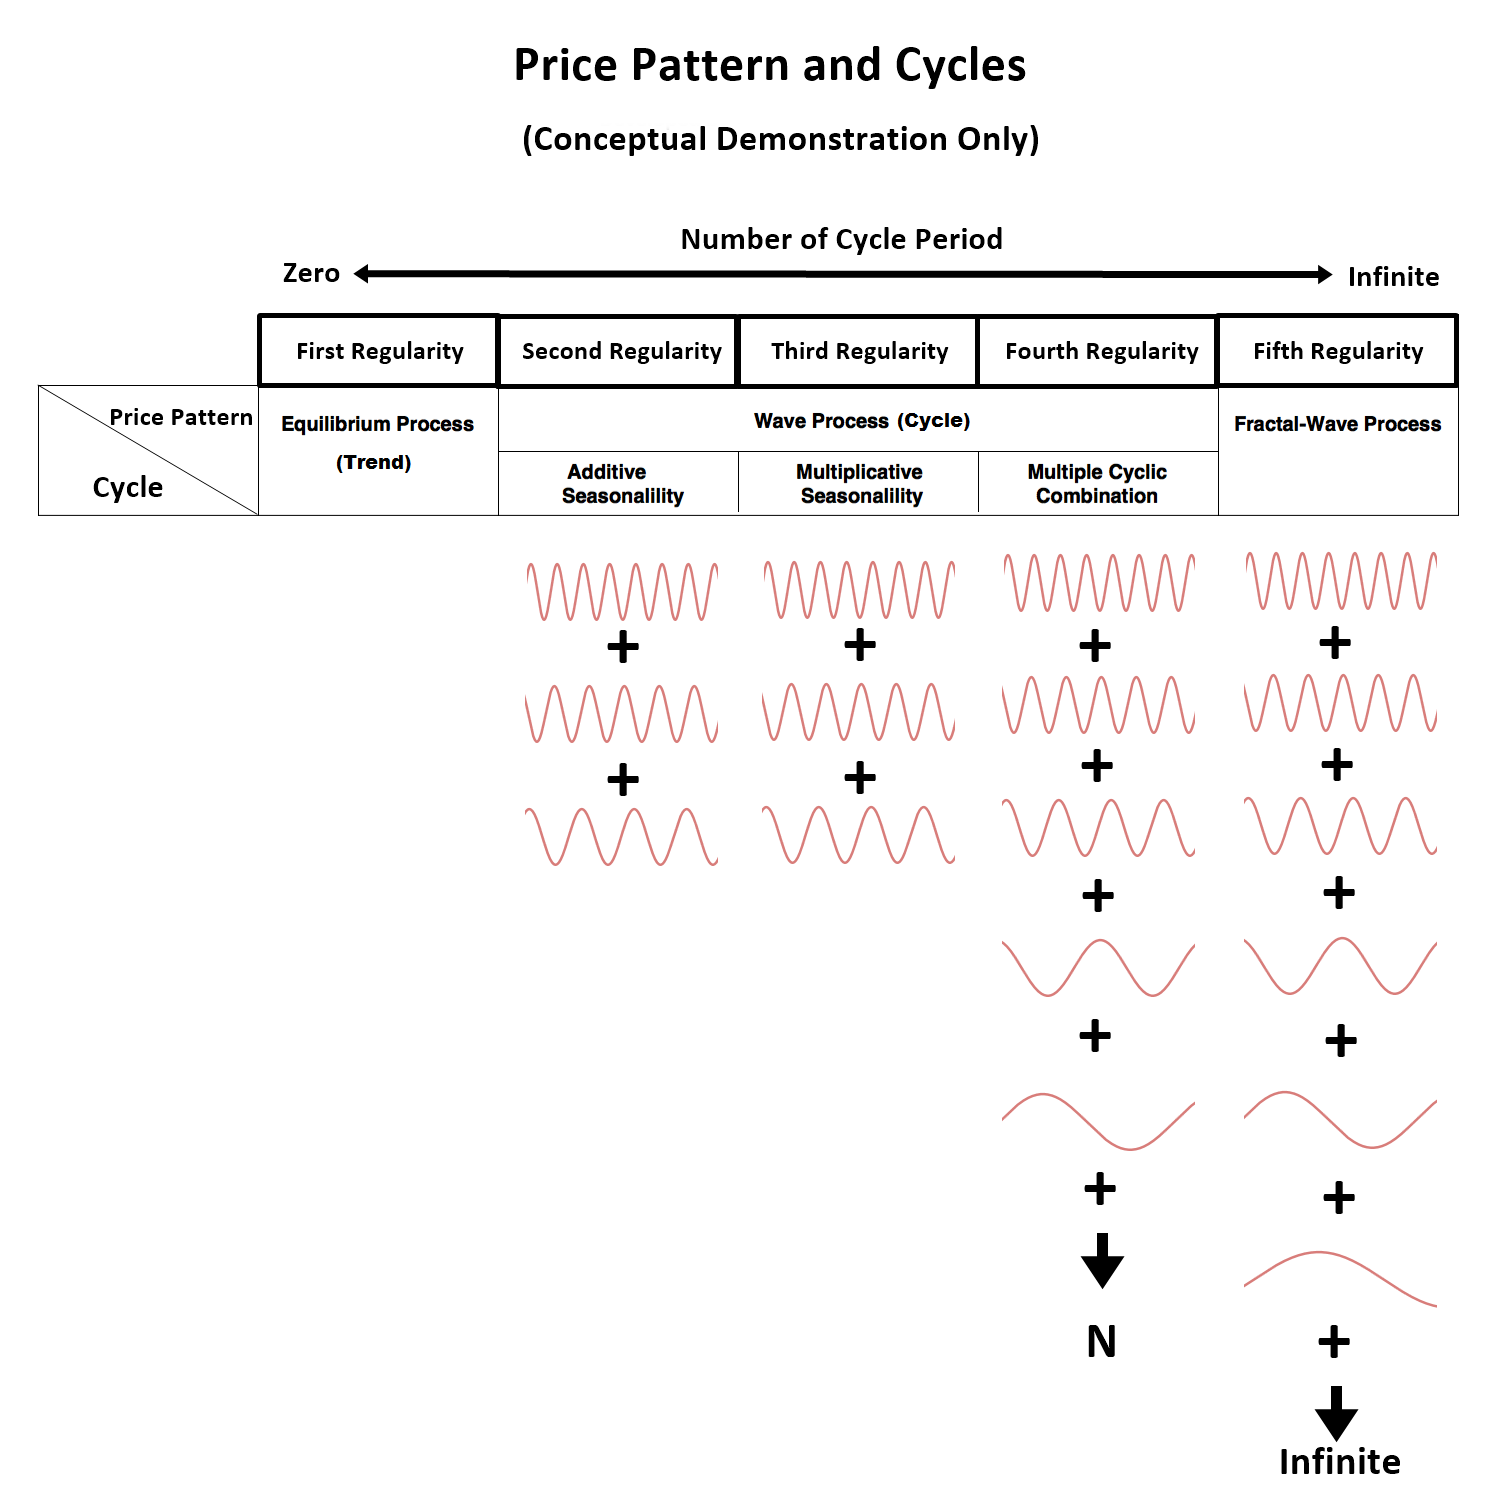
Figure 3-5: Visualizing number of cycle periods for the five regularities. Please note that this is only the conceptual demonstration and the number of cycles for second, third and fourth regularity can vary for different price series.
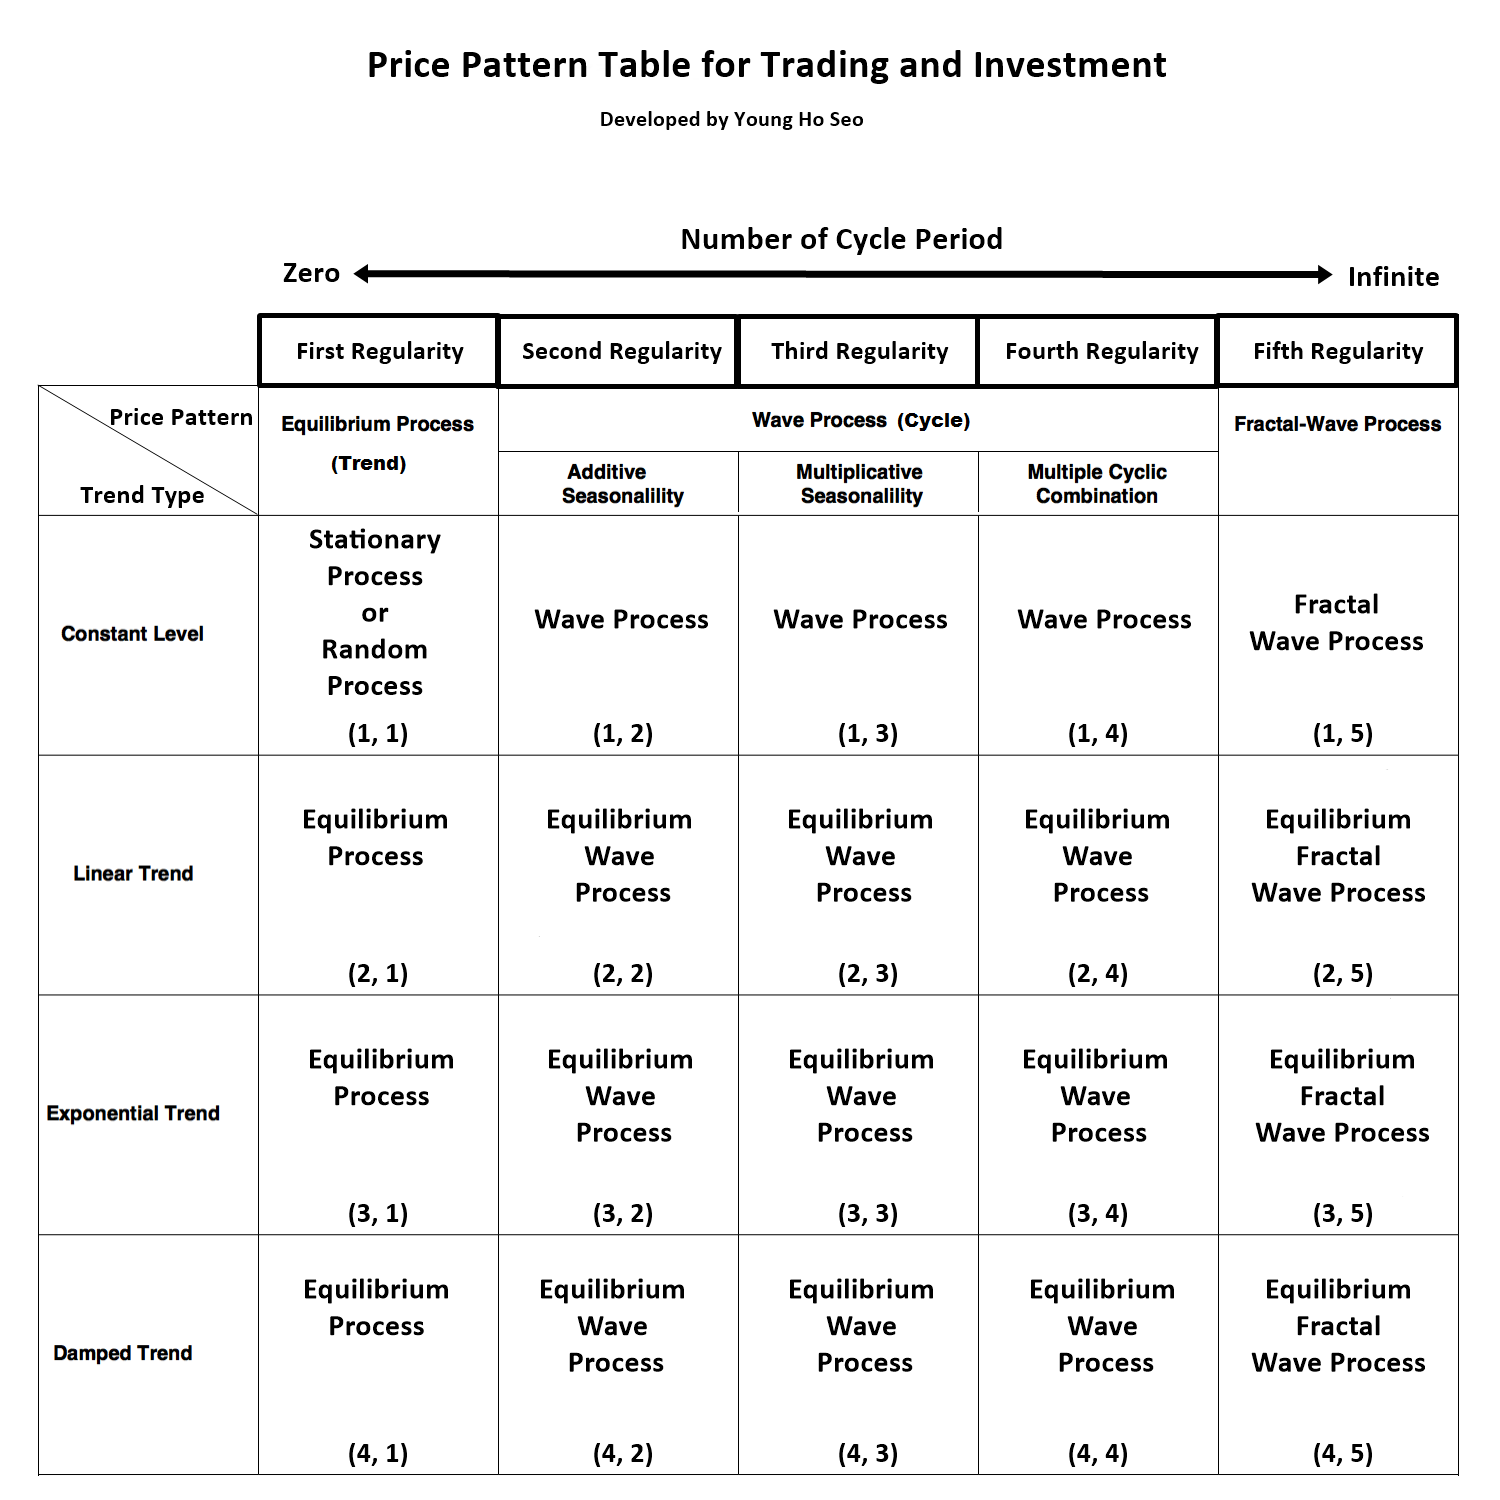
Figure 3-6: Five Regularities and their sub price pattern names.
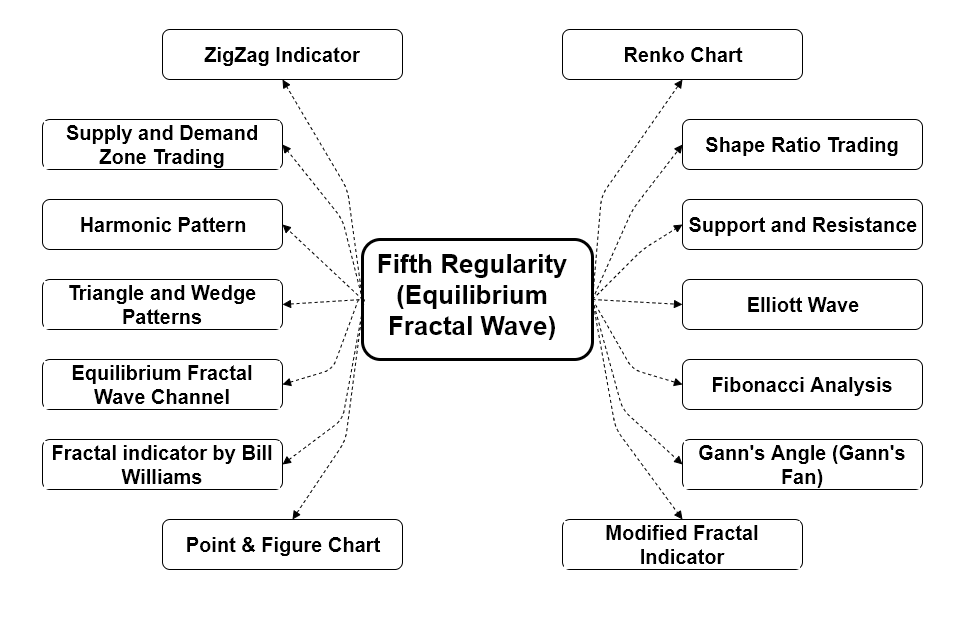
Figure 3-7: Trading strategies, indicators and charting techniques to deal with the fifth regularity.
Some More Tips about Five Regularities in Forex Trading
The “Five Regularities in Forex Trading” refer to common patterns or rules that traders often observe in the forex market. Understanding these regularities can help traders develop more effective strategies and improve their chances of success. Here are the five regularities:
- Market Trends and Cycles:
- Trend Identification: Forex markets often exhibit trends, where currency prices move consistently in one direction (up or down) over a period. Identifying these trends early can help traders align their positions with the market direction.
- Cycles and Patterns: Markets can also follow cyclical patterns influenced by economic cycles, political events, and other factors. Recognizing these cycles can aid in timing trades better.
- Support and Resistance Levels:
- Support Levels: A support level is a price point where a currency pair tends to stop falling and may start rising. This is because demand increases as prices fall to this level.
- Resistance Levels: Conversely, a resistance level is a price point where a currency pair tends to stop rising and may start falling, due to increased selling pressure.
- Breakouts: When prices break through these levels, significant price movements can occur, providing trading opportunities.
- Impact of Economic Indicators:
- News and Reports: Economic indicators, such as GDP, unemployment rates, and inflation, significantly impact currency prices. Traders monitor these indicators to predict market movements.
- Central Bank Policies: Interest rate decisions and monetary policies from central banks also influence forex markets. Traders need to stay informed about these policies and their potential effects.
- Market Sentiment and Speculation:
- Sentiment Analysis: Traders often gauge market sentiment, which reflects the overall attitude of investors toward a particular currency or the market in general. This can be bullish (optimistic) or bearish (pessimistic).
- Speculative Actions: Speculative trades, based on rumors or expectations, can drive significant short-term price movements. Understanding market sentiment can help traders anticipate these moves.
- Technical Analysis and Chart Patterns:
- Technical Indicators: Traders use various technical indicators (e.g., Moving Averages, RSI, MACD) to analyze price movements and identify trading opportunities.
- Chart Patterns: Patterns like Head and Shoulders, Double Top/Bottom, and Flags/Pennants can signal potential market reversals or continuations. Recognizing these patterns helps traders make informed decisions.
Practical Application
- Combining Regularities: Successful traders often combine these regularities to form a comprehensive trading strategy. For example, they might use technical analysis to identify entry and exit points, while also considering economic indicators and market sentiment.
- Risk Management: Alongside these regularities, effective risk management practices, such as setting stop-loss orders and position sizing, are crucial to mitigate potential losses.
- Continuous Learning: The forex market is dynamic, and ongoing education and adaptation to new market conditions are essential for long-term success.
By understanding and applying these regularities, forex traders can enhance their market analysis and improve their trading performance.
About this Article
This article is the part taken from the draft version of the Book: Scientific Guide To Price Action and Pattern Trading (Wisdom of Trend, Cycle, and Fractal Wave). This article is only draft and it will be not updated to the completed version on the release of the book. However, this article will serve you to gather the important knowledge in financial trading. This article is also recommended to read before using Price Breakout Pattern Scanner, Advanced Price Pattern Scanner, Elliott Wave Trend, EFW Analytics and Harmonic Pattern Plus, which is available for MetaTrader 4 and MetaTrader 5 platform.
Below is the landing page for Price Breakout Pattern Scanner, Advanced Price Pattern Scanner, Elliott Wave Trend, EFW Analytics and Harmonic Pattern Plus. All these products are also available from www.mql5.com too.
https://algotrading-investment.com/portfolio-item/price-breakout-pattern-scanner/
https://algotrading-investment.com/portfolio-item/advanced-price-pattern-scanner/
https://algotrading-investment.com/portfolio-item/elliott-wave-trend/
https://algotrading-investment.com/portfolio-item/equilibrium-fractal-wave-analytics/
https://algotrading-investment.com/portfolio-item/harmonic-pattern-plus/
Related Products


