Horizontal Support and Resistance
Support and resistance techniques are one of the most popular trading strategy for many day traders. Support is the price level at which buying is stronger than selling. Hence, the declining of the price below the support levels is often refused. Typically, support level is located below the current market price. Likewise, resistance is the price level at which selling is stronger than buying. Hence, the rising of the price above the resistance level is often refused. Typically, the resistance level is located above the current market price of the instrument. In fact, several support and resistance techniques are the direct pattern recognition techniques to deal with the equilibrium fractal waves in the price series. However, trader should note that not all the support resistance techniques are the valid tool to deal with the equilibrium fractal waves. For example, the pivot levels derived from the pivot analysis can be used as support and resistance for your trading. In fact, many textbook will introduce the pivot analysis as the kind of the support and resistance tool. However, consider how to derive the pivot levels from the standard pivot calculation equations below:
- Pivot Point (P) = (High + Low + Close)/3
- Support 1 (S1) = (P x 2) – High
- Support 2 (S2) = P – (High – Low)
- Resistance 1 (R1) = (P x 2) – Low
- Resistance 2 (R2) = P + (High – Low)
, where High, Low and Close are the High, Low and Close of the previous candle bar.
As you can see, the median price, Pivot Point, of the previous candle bar is calculated first. Then the median price is used to derive the support and resistance 1 and 2. We can clearly see that this pivot analysis have nothing to do with any pattern recognition from your chart. It rather uses the concept of averaging and volatility from the centre of the pivot point. One can extend the standard pivot analysis using Fibonacci ratio. However, the extended pivot analysis is still not the direct pattern recognition either.
When we say the support and resistance as in the direct pattern recognition, we are talking about creating support and resistance levels by connecting peak to peak and by connecting trough to trough in your chart. For example, Figure 2-1 shows the support example on GBPUSD H4 timeframe. By connecting three troughs in the chart, we could identify the important support level and we can project the level for the next point for our trading. When the price was approaching to the support level fourth time, the price made a reversal (turning point) movement on the support level. This is what happened at least on the surface. However, what is exactly going on behind the scene? In fact, the support levels are the manifest of the propagation of the Equilibrium Fractal Wave through the price. To demonstrate the propagation of the Equilibrium Fractal Wave, we have added the Zig Zag line on each trough in Figure 2-1. When the price touches the support level each time, new triangle is added to the price wave. The price can continue like this making few more touches on the support level. Sometimes, it is common to see the support with five or more touches. In general, when the vertexes of several non-overlapping triangles are aligned through a straight line below the market price, the straight line becomes the support level.
In our first support example (Figure 2-1), we have visualized the reversal price action around the support. However, it is possible that we can have the support predicting the breakout movement instead of the reversal. For example, the USDJPY in Figure 2-2 penetrated through the support making the breakout on its fourth touch. When the price breakout below the support level, we can see that the size of the last triangle was transformed to be bigger. This is the typical price action when the new equilibrium source is introduced to the market.
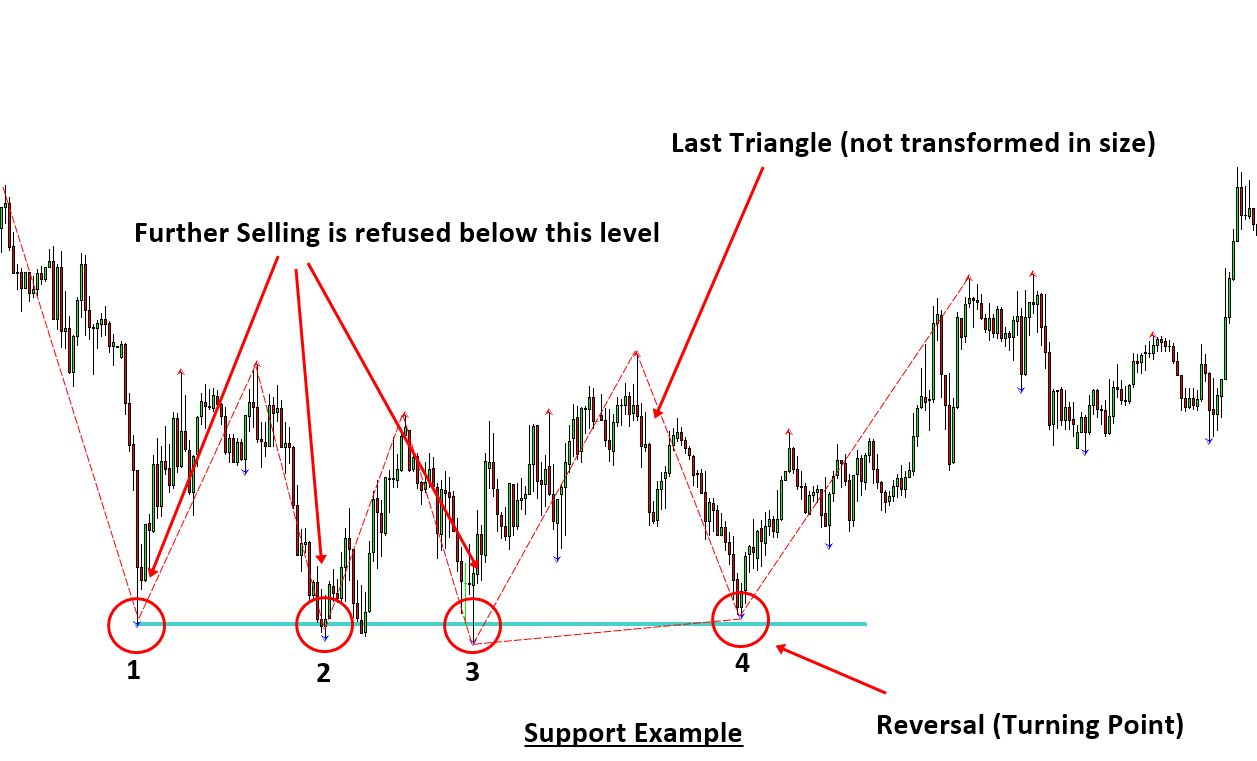
Figure 2-1: Support example as in the direct pattern recognition on GBPUSD H4 timeframe.
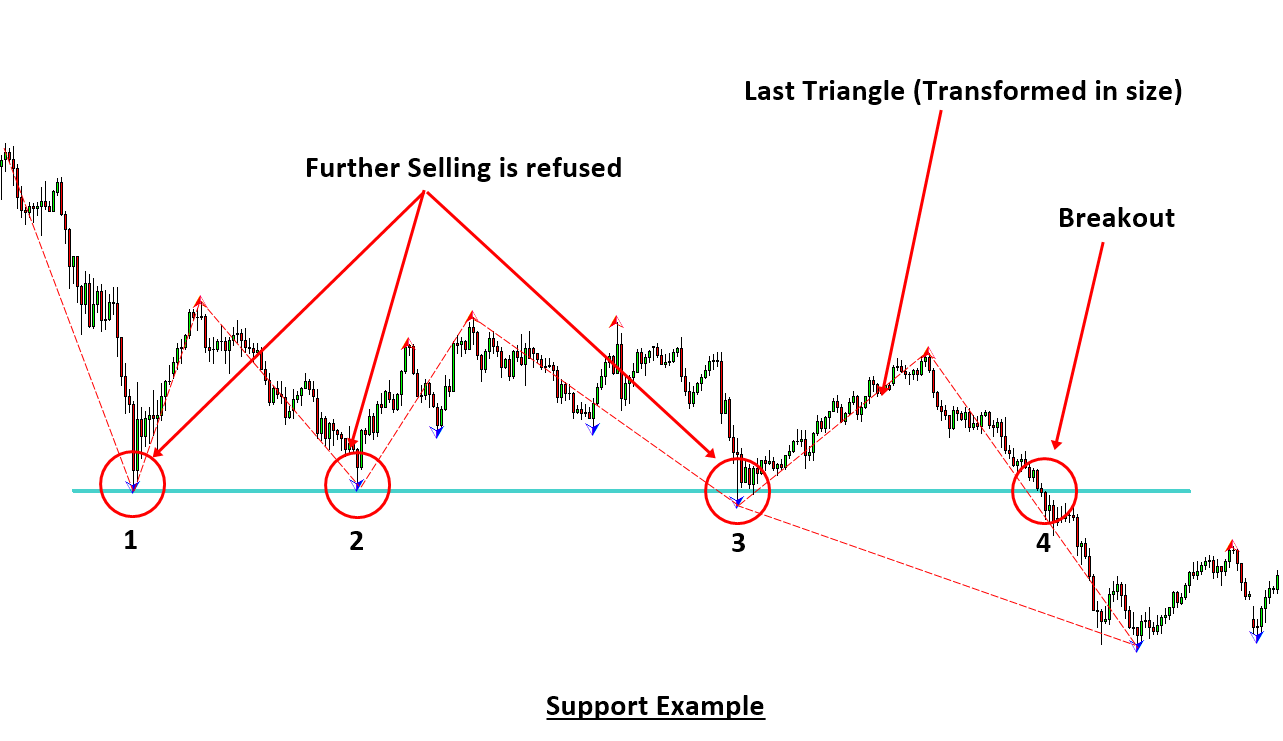
Figure 2-2: Support Example as in the direct pattern recognition on USDJPY H4 timeframe.
Now let us have a look at the resistance example. As before, we can identify the important resistance levels by connecting peak to peak. In Figure 2-3, we have connected three peaks to identify the resistance level. The price made a reversal (turning point) in its fourth touch on the resistance level. As in the support level, the resistance levels are formed when the vertexes of the several non-overlapping triangles are aligned near the same horizontal level. In this time, the horizontal levels will be located above the market price. As in the support example, it is possible to have a breakout through the resistance too. For example, the EURUSD in Figure 2-4 made a clean breakout on its seventh touch on the resistance level. In this example, the last triangle was transformed in its size as in the support example of Figure 2-2. By summarizing both support and resistances examples, we can identify four different horizontal support and resistance patterns for your trading as shown in Table 2-1.
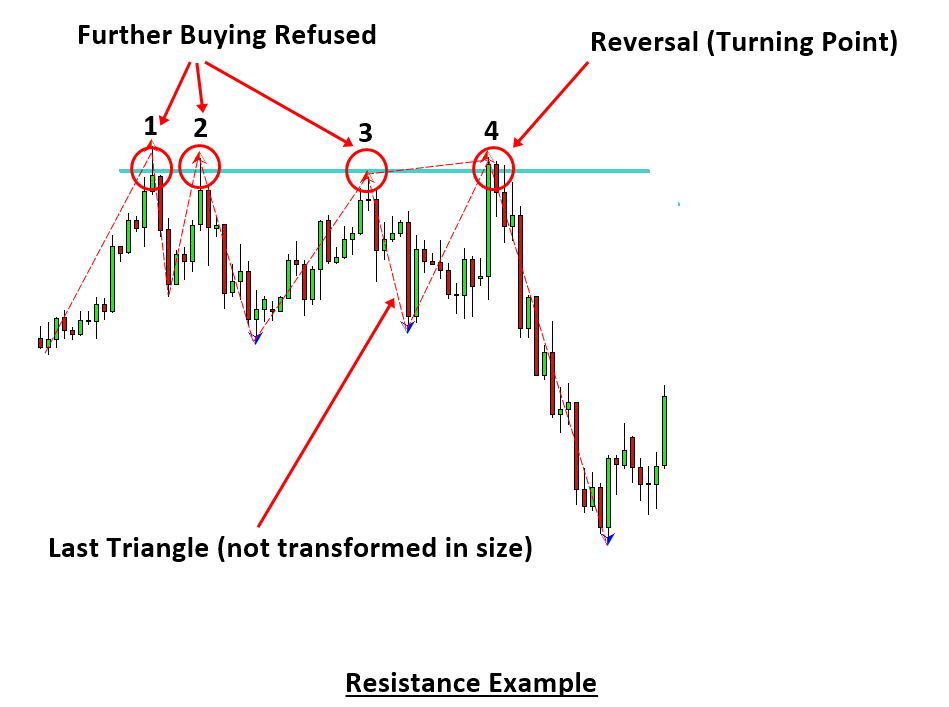
Figure 2-3: Resistance example as in the direct pattern recognition on GBPUSD H4 timeframe.
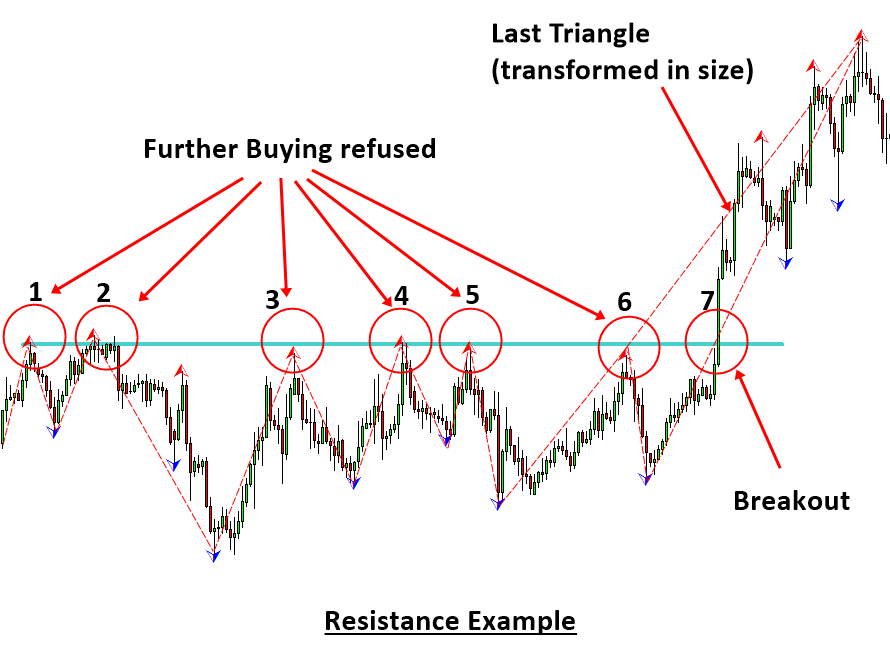
Figure 2-4: Resistance example as in the direct pattern recognition on EURUSD H4 timeframe.
| Support and resistance | Price Action | Direction | Example |
| Horizontal Support | Reversal | Buy | Figure 2-1 |
| Horizontal Support | Breakout | Sell | Figure 2-2 |
| Horizontal Resistance | Reversal | Sell | Figure 2-3 |
| Horizontal Resistance | Breakout | Buy | Figure 2-4 |
Table 2-1: List of horizontal support and resistance patterns for your trading.
What is the main catchy behind the above support and resistance examples for our trading? In the practical trading with support and resistance levels, we are betting on the transformation of the last triangle, equilibrium fractal wave in fact. In another words, we are betting on the size of the last triangle. When you are trading with support and resistance levels, you are literally asking the questions like: Would the last triangle will transform in its size to make the breakout move? Or Would the last triangle will not transform in its size to make the reversal move? In our practical trading, how the size of the last triangle will end is the matter for our profit. If we are not using any other supplementary techniques to trade, then we can set a threshold level to trigger for buy and sell entry as shown in Figure 2-5. Y Buy and Y Sell in Figure 2-5 is the price level to trigger the buy and sell entry respectively. If the last triangle is transformed in its size, then the price will penetrate the threshold level for sell. If the last triangle is not transformed in its size, then the price will reverse back through the threshold level for buy. To measure the distance Y Buy and Y Sell, we can use few different methods. Firstly, we can define Y Buy and Y Sell in proportion of the height of the last triangle (Y Height). For example, Y Buy and Y Sell can be expressed using the following formula for Figure 2-5:
Y Buy = Proportion (%) x Y Height and
Y Sell = Proportion (%) x Y Height, where Y Height = the height of the last triangle and Proportion is fraction of the height of the last triangle expressed in percentage.
The typical proportion to calculate Y Buy and Y Sell can range from 5% to 20%. When you choose the proportion, you might have to consider few points. If you choose to use small proportion, then you might experience the false signal frequently. In addition, you might be suffering from the price pull back due to the tight stop loss. If you choose to use large proportion, then you might be reducing your reward/risk ratio. Therefore, you have to win more frequently to maintain your profits.
Another method to set the buy and sell threshold level is using the Fibonacci ratio. Again, the Fibonacci threshold level will be calculated in terms of the height of the last triangle. For example, Y Buy and Y Sell can be expressed using the following formula for Figure 2-5:
Y Buy = Fibonacci Ratio x Y Height and
Y Sell = Fibonacci Ratio x Y Height, where Y Height = the height of the last triangle and Fibonacci ratio include the typical Fibonacci ratios like 0.236, 0.382, 0.500, and 0.618, etc.
Both the proportional threshold method and the Fibonacci threshold method are valid for your entry. You can pick up one between them according to your own preferences. Fibonacci threshold method tends to provide the entry with greater distance from the stop. Hence, it should be noted that the Fibonacci threshold method could reduce your rewards/risk ratio. However, if the size of the last triangle is too small, then you might prefer to use the Fibonacci threshold method because too tight stop loss can be hunted too easily. You can set your stop loss at the support or resistance level for your trading. However, it is possible that the price can come back to the support or resistance level for retesting. It is sensible to place your stop slightly greater than the support and resistance level. Hence, the support or resistance level can be only minimum stop for your trading. You should always set your stop loss slightly greater than the minimum stop level.
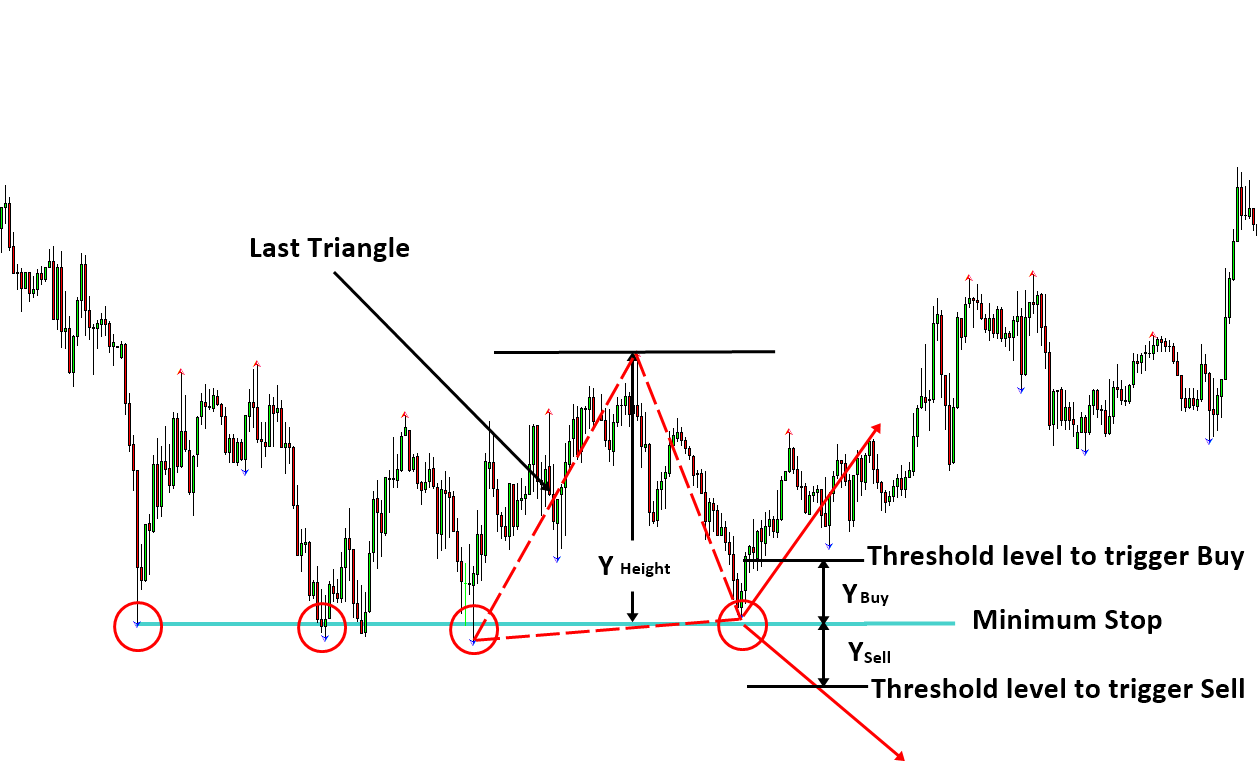
Figure 2-5: Support Trading example as in the direct pattern recognition on GBPUSD H4 timeframe.
Some More Tips about Horizontal Support and Resistance
Support and resistance levels are fundamental concepts in technical analysis. They represent price levels at which an asset (such as a stock, currency, or commodity) tends to reverse or pause its movement. Specifically:
- Support is a price level where a downtrend stops or slows down as buying pressure overcomes selling pressure.
- Resistance is a price level where an uptrend halts or reverses due to selling pressure overcoming buying pressure.
Understanding and correctly identifying horizontal support and resistance levels is key to analyzing and interpreting various chart patterns.
1. Identifying Horizontal Support and Resistance
- Horizontal Support: This is a level where the price has previously bounced upward multiple times. It shows that demand has consistently increased at this price, preventing the asset from falling further.
- Horizontal Resistance: This is a level where the price has reversed downward multiple times. It suggests that sellers enter the market at this price, creating excess supply and stopping the price from rising further.
Steps to Identify Horizontal Support and Resistance
- Look for Repeated Price Bounces: Support is identified when the price bounces upward from a certain level multiple times. Resistance is identified when the price falls from a level multiple times.
- Focus on Major Reversals: The most significant support and resistance levels are formed at points where large price reversals have occurred.
- Use Historical Data: Look at previous price movements to see where these horizontal lines have been respected in the past. Historical support and resistance levels often become important again in the future.
- Draw Horizontal Lines: Once you identify these levels, draw horizontal lines on your chart. This will help you visualize where support and resistance are likely to occur in the future.
2. Role of Support and Resistance in Chart Patterns
Many classic chart patterns are built around support and resistance levels. Here are a few examples:
a. Double Top and Double Bottom
- Double Top: A bearish reversal pattern that forms when the price hits a resistance level twice and fails to break above it. This suggests that sellers are stronger at that resistance level, and a downtrend is likely to follow.
- Double Bottom: A bullish reversal pattern that forms when the price hits a support level twice and fails to break below it. This indicates strong buying interest at the support level, and the price is likely to trend upward afterward.
b. Head and Shoulders / Inverse Head and Shoulders
- Head and Shoulders: This is a bearish reversal pattern that forms at the end of an uptrend. The price forms three peaks: the middle peak is the highest (the “head”), and the other two are lower (the “shoulders”). The neckline acts as horizontal support, and a break below this neckline signals a reversal to the downside.
- Inverse Head and Shoulders: This is a bullish reversal pattern at the end of a downtrend. It has the opposite structure to the Head and Shoulders, and the neckline is horizontal resistance. A break above the neckline indicates a reversal to the upside.
c. Rectangles
- Rectangle Patterns: These are continuation patterns that form when the price moves within a horizontal range between support and resistance. The asset may be in an uptrend or downtrend before the rectangle forms. Once the price breaks out of the rectangle, it continues in the original trend direction.
- Bullish Rectangle: The price is in an uptrend, consolidates between support and resistance, and breaks above the resistance to continue the uptrend.
- Bearish Rectangle: The price is in a downtrend, consolidates, and then breaks below the support to continue the downtrend.
d. Triangles (Ascending, Descending, and Symmetrical)
- Ascending Triangle: The price forms higher lows (upward sloping support) but hits a horizontal resistance level multiple times. A breakout above the resistance usually signals a continuation of the uptrend.
- Descending Triangle: The price forms lower highs (downward sloping resistance) but hits a horizontal support level multiple times. A breakdown below the support level signals a continuation of the downtrend.
- Symmetrical Triangle: Neither support nor resistance is horizontal. This pattern usually leads to a breakout in the direction of the prevailing trend (upward or downward).
3. Key Tips for Using Horizontal Support and Resistance
- Test Multiple Timeframes: Support and resistance levels on longer timeframes (e.g., daily, weekly charts) are usually more significant than those on shorter timeframes (e.g., 5-minute, 1-hour charts).
- Wait for Confirmation: Always wait for the price to confirm a breakout (or breakdown) beyond support or resistance levels. False breakouts are common, where the price temporarily moves past support/resistance before reversing.
- Volume Analysis: When the price breaks through a significant support or resistance level with high volume, it is more likely that the breakout is legitimate. Low volume breakouts are more prone to reversal.
4. Using Indicators to Enhance Horizontal Support and Resistance
- Moving Averages: Simple and exponential moving averages (e.g., the 50-day or 200-day moving averages) often act as dynamic support or resistance levels. Traders use them to identify potential price reversals.
- Fibonacci Retracement Levels: The Fibonacci retracement tool can help identify hidden horizontal support and resistance levels, especially in trending markets.
5. Practical Application in Trading
Once you identify horizontal support and resistance, you can use them for:
- Entry Points: Buy near support levels and sell near resistance levels.
- Exit Points: If you’re long, take profit at resistance levels; if you’re short, take profit at support levels.
- Stop-Loss Placement: Place stop-loss orders slightly below support levels (in case of buying) or slightly above resistance levels (in case of selling) to protect your trades from sudden reversals.
About this Article
This article is the part taken from the draft version of the Book: Scientific Guide to Price Action and Pattern Trading (Wisdom of Trend, Cycle, and Fractal Wave). Full version of the book can be found from the link below:
You can also use Ace Supply Demand Zone Indicator in MetaTrader to accomplish your support resistance analysis. Ace Supply Demand Zone indicator is non repainting and non lagging indicator with a lot of powerful features built on. Especially, you can use it like the horizontal support and resistance for your trading as well as the direction prediction trading strategy.
https://www.mql5.com/en/market/product/40076
https://www.mql5.com/en/market/product/40075
https://algotrading-investment.com/portfolio-item/ace-supply-demand-zone/
Turning Point Probability and Trend Probability can be measured with Fractal Pattern Scanner at every price action in your chart. The turning point probability can improve the accuracy of trading with horizontal support and resistance. You can watch this YouTube video how you can turn the support resistance into the killer strategy with the turning point probability in Fractal Pattern Scanner.
Below is the landing page to Fractal Pattern Scanner in MetaTrader 4 and MetaTrader 5.
https://www.mql5.com/en/market/product/49170
https://www.mql5.com/en/market/product/49169
https://algotrading-investment.com/portfolio-item/fractal-pattern-scanner/
Related Products


