Diagonal Support and Resistance
In the financial market, we can observe the diagonal price patterns frequently. Diagonal support and resistance are the typical price patterns we can observe as the results of the combined effect of Equilibrium and Fractal Wave process. Diagonal support and resistance are not different from the horizontal support and resistance. When the connected peaks and troughs provide the diagonal slope rather than the horizontal line, then that slope can be considered as the diagonal support and resistance. However, there can be more variations comparing to the horizontal case. Firstly, we can have the ascending diagonal support and resistance. Secondly, we can also have the descending diagonal support and resistance. For your convenience, we have listed all the possible diagonal support and resistance patterns in Table 2-2. We have also listed the corresponding example for each pattern from Figure 2-6 to Figure 2-13. How to trade diagonal support and resistance levels are the same as the horizontal support and resistance. You can apply the proportional threshold method and the Fibonacci threshold method for your entry for the case of diagonal support and resistance too. The trading example is shown in Figure 2-14. How to calculate the threshold level for Y Buy and Y Sell are identical to the case of horizontal support and resistance. As in the horizontal support and resistance, it is sensible to set your stop loss level greater than the minimum stop level.
| Support and resistance | Price Action | Direction | Example |
| Ascending Diagonal Support | Reversal | Buy | Figure 2-6 |
| Ascending Diagonal Support | Breakout | Sell | Figure 2-7 |
| Ascending Diagonal Resistance | Reversal | Sell | Figure 2-8 |
| Ascending Diagonal Resistance | Breakout | Buy | Figure 2-9 |
| Descending Diagonal Support | Reversal | Buy | Figure 2-10 |
| Descending Diagonal Support | Breakout | Sell | Figure 2-11 |
| Descending Diagonal Resistance | Reversal | Sell | Figure 2-12 |
| Descending Diagonal Resistance | Breakout | Buy | Figure 2-13 |
Table 2-2: List of diagonal support and resistance patterns for your trading.
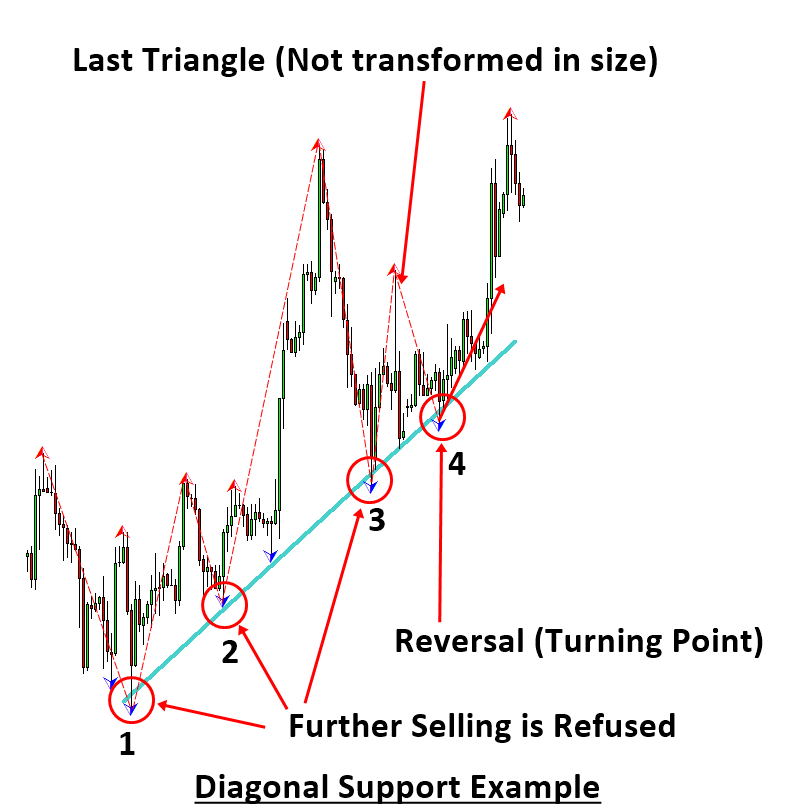
Figure 2-6: Support example as in the direct pattern recognition on EURUSD H4 timeframe.
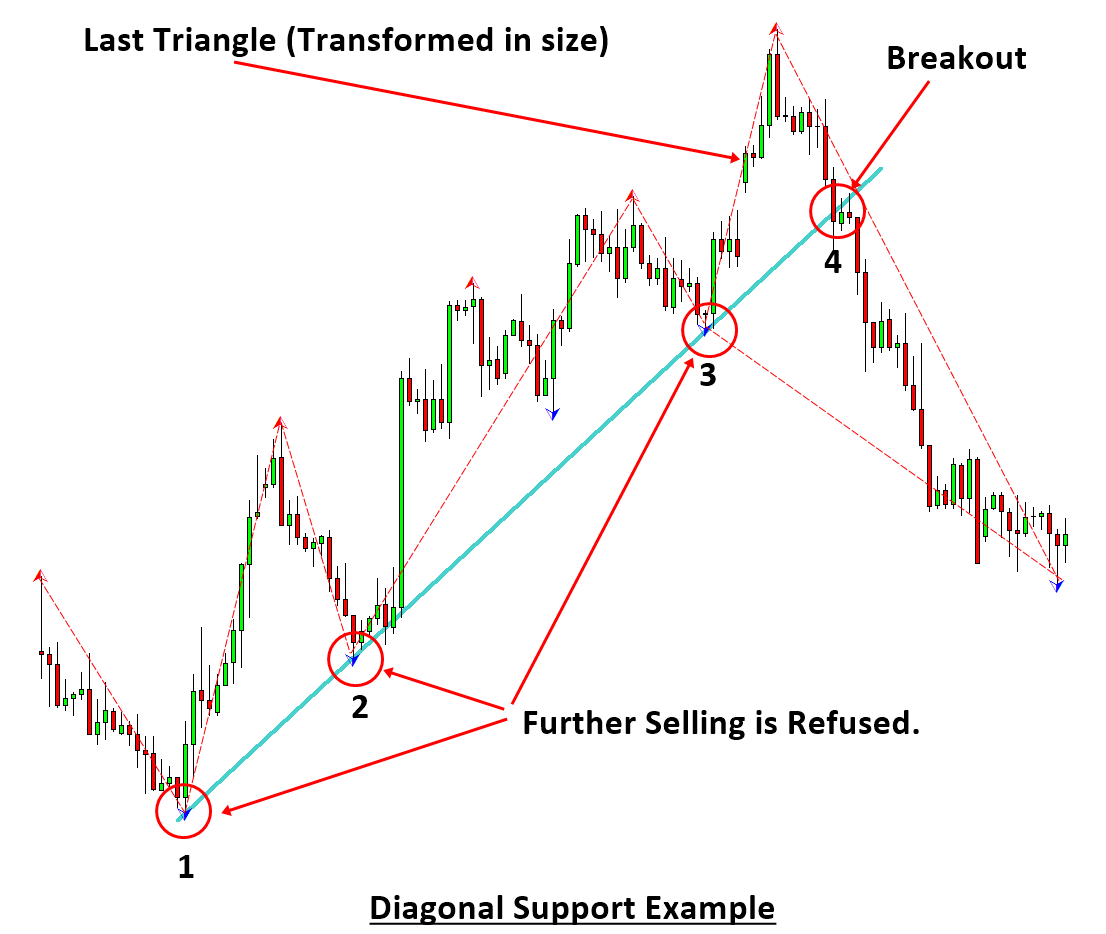
Figure 2-7: Support example as in the direct pattern recognition on EURUSD H4 timeframe.
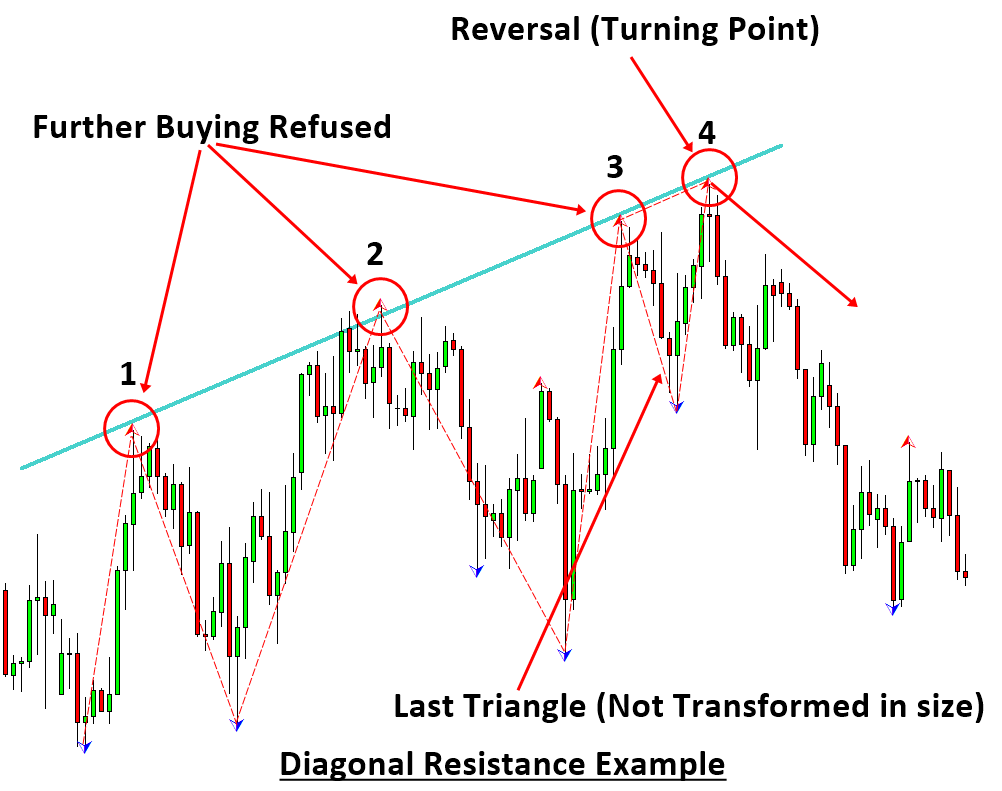
Figure 2-8: Resistance example as in the direct pattern recognition on EURUSD H4 timeframe.
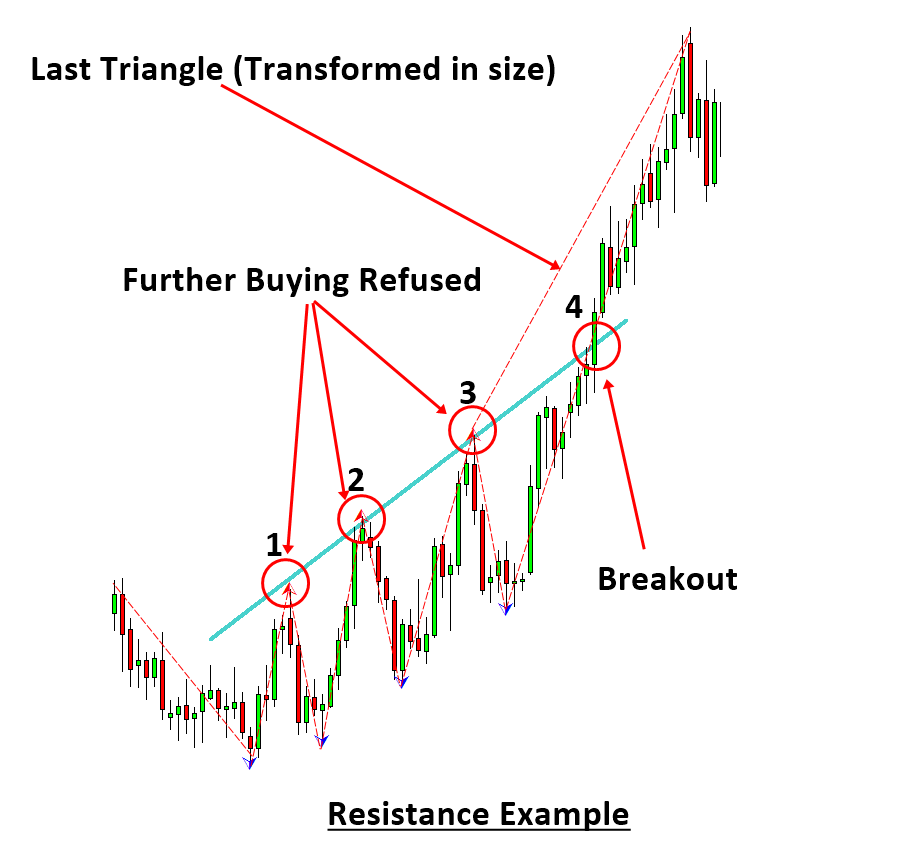
Figure 2-9: Resistance example as in the direct pattern recognition on EURUSD D1 timeframe.
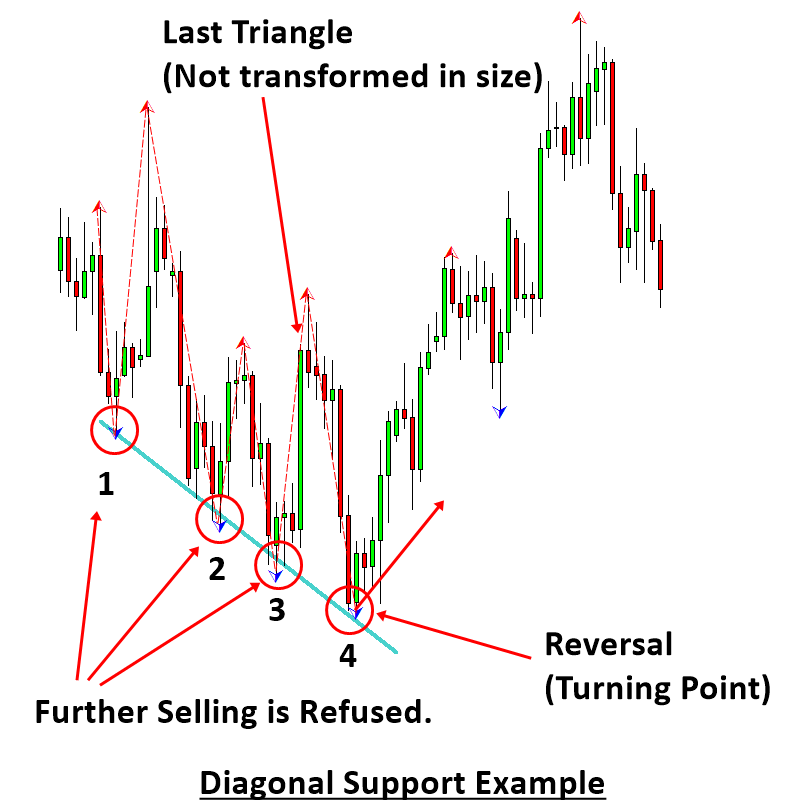
Figure 2-10: Support example as in the direct pattern recognition on EURUSD H4 Timeframe.

Figure 2-11: Support example as in the direct pattern recognition on EURUSD H4 Timeframe.
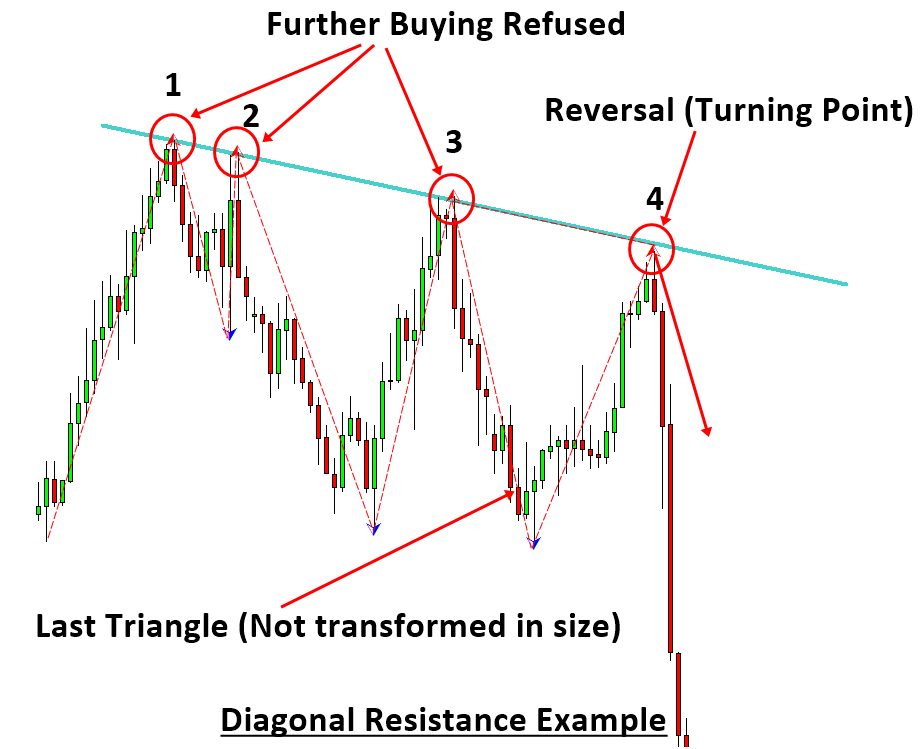
Figure 2-12: Resistance example as in the direct pattern recognition on EURUSD H4 timeframe.
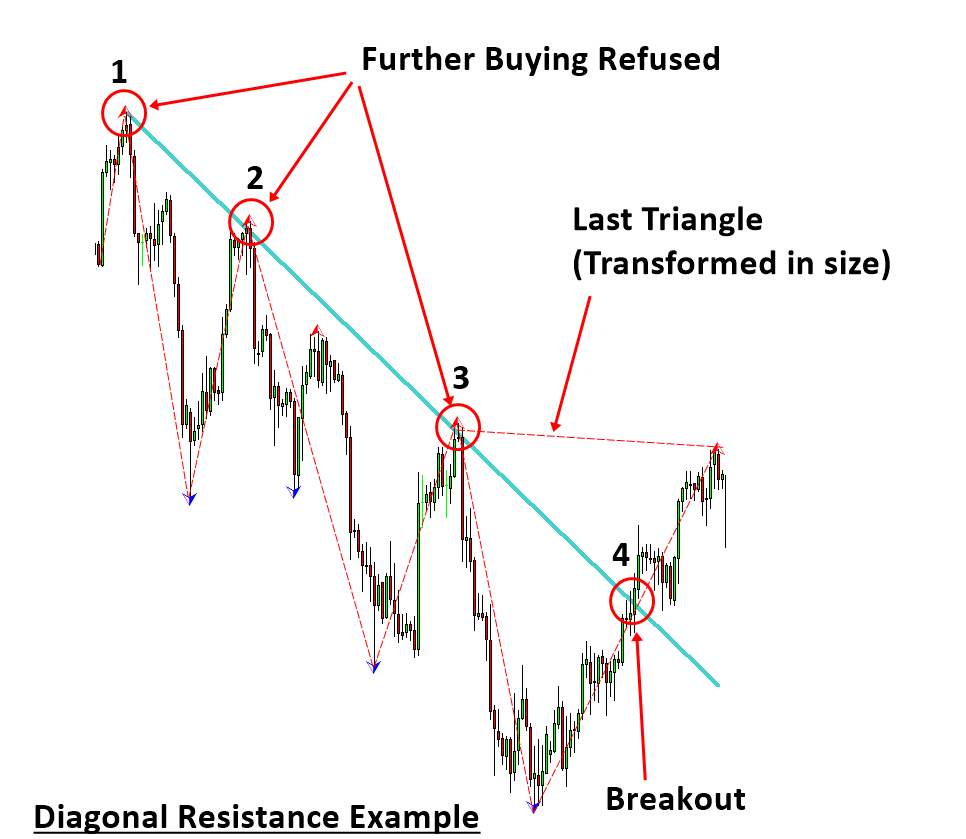
Figure 2-13: Resistance example as in the direct pattern recognition on GBPUSD H4 timeframe.
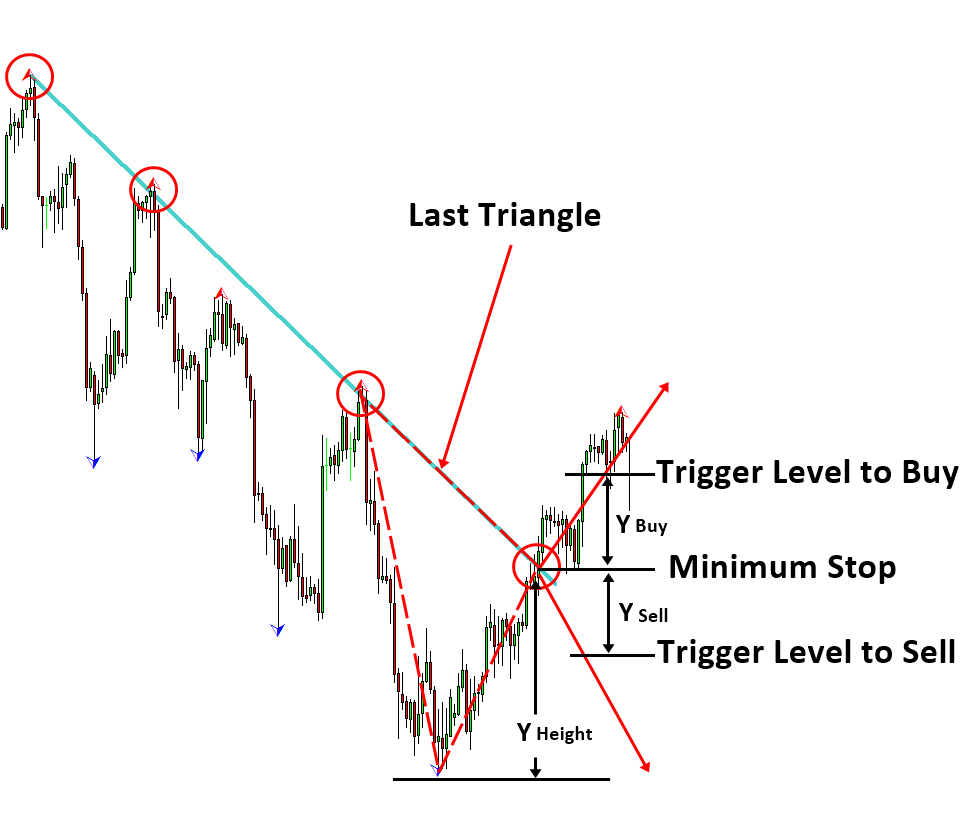
Figure 2-14: Resistance Trading example as in the direct pattern recognition on GBPUSD H4 timeframe.
Some More Tips about Diagonal Support and Resistance
Diagonal support and resistance are key concepts in technical analysis used in the Forex (foreign exchange) market. They refer to the dynamic levels of support and resistance that move in tandem with the price over time, forming an ascending or descending line rather than a horizontal line. These lines are crucial for identifying trends and potential reversal points in the market.
1. Understanding Diagonal Support and Resistance
- Diagonal Support: This is a trendline drawn underneath rising price action, connecting at least two or more higher lows. It represents a bullish trend where each subsequent low is higher than the previous one, indicating that buyers are stepping in at increasingly higher prices.
- Diagonal Resistance: This is a trendline drawn above declining price action, connecting at least two or more lower highs. It represents a bearish trend where each subsequent high is lower than the previous one, indicating that sellers are dominating at progressively lower prices.
2. How to Draw Diagonal Support and Resistance Lines
To draw diagonal support and resistance lines effectively:
- Identify the Trend: Determine whether the market is in an uptrend or a downtrend. This will help you decide if you should draw a support or resistance line.
- Connect Significant Highs and Lows:
- For support in an uptrend, connect the significant higher lows.
- For resistance in a downtrend, connect the significant lower highs.
- Extend the Line: Once drawn, extend the line to the right. This helps in predicting where the future support or resistance might occur.
3. Role of Diagonal Support and Resistance in Trading
Diagonal support and resistance are useful in identifying potential trade setups in the Forex market:
- Trend Confirmation: Diagonal lines help traders confirm the trend direction. For instance, in an uptrend, as long as the price remains above the diagonal support, the trend is considered intact.
- Reversal Signals: A break below diagonal support in an uptrend or above diagonal resistance in a downtrend can signal a potential trend reversal.
- Entry and Exit Points: Traders often use these lines to decide on entry and exit points. For example, in an uptrend, a trader might enter a long position when the price approaches the diagonal support, anticipating a bounce higher.
- Stop-Loss Placement: Diagonal support and resistance can also serve as guides for placing stop-loss orders. In a long position, a stop-loss might be placed slightly below the diagonal support to protect against a breakdown.
4. Common Patterns Involving Diagonal Support and Resistance
Several chart patterns involve diagonal support and resistance, including:
- Ascending and Descending Triangles: These patterns are characterized by a flat horizontal line (support or resistance) and a diagonal line (resistance or support). An ascending triangle has a rising diagonal support, while a descending triangle has a falling diagonal resistance.
- Channels: These are formed by drawing two parallel diagonal lines, one connecting higher lows and the other connecting lower highs. Channels can be ascending, descending, or horizontal and are used to identify price range and potential breakout points.
- Wedges: A wedge is formed when the price action becomes more compressed, with both diagonal support and resistance lines converging towards a point. An ascending wedge is bearish, while a descending wedge is bullish.
5. Importance of Diagonal Support and Resistance
- Flexibility with Market Movements: Unlike horizontal support and resistance, diagonal lines adjust with the market’s movement, providing more dynamic insights.
- Early Signal Detection: Diagonal lines often provide early signals of potential trend changes compared to horizontal lines, which are typically confirmed later.
- Combination with Other Indicators: Traders often combine diagonal support and resistance with other technical indicators (like moving averages, RSI, or MACD) to enhance their trading strategies.
6. Limitations of Diagonal Support and Resistance
- Subjectivity: Drawing diagonal lines can be somewhat subjective, as different traders may draw them slightly differently based on their analysis.
- False Breakouts: The Forex market can experience false breakouts where the price temporarily breaches a diagonal line before returning to its original trend.
- Market Volatility: High market volatility can lead to sharp price movements that might breach diagonal support or resistance, leading to potentially misleading signals.
Conclusion
Diagonal support and resistance are essential tools for Forex traders, helping them understand and predict market movements based on trends. By effectively identifying these lines, traders can better position themselves in the market, anticipate reversals, and make informed trading decisions. However, as with any tool in technical analysis, diagonal lines should be used in conjunction with other forms of analysis to confirm signals and reduce the risk of false breakouts.
About this Article
This article is the part taken from the draft version of the Book: Scientific Guide to Price Action and Pattern Trading (Wisdom of Trend, Cycle, and Fractal Wave). Full version of the book can be found from the link below:
Advanced Price Pattern Scanner is the non repainting pattern scanner designed for both MetaTrader 4 and MetaTrader 5. It can detect many important price patterns for your trading like rising wedge, falling wedge, head and shoulder patterns, Cup and Handle, etc. Here is an intro video for Advanced Price Pattern Scanner from YouTube. Please check the YouTube Video titled as “Intro Video to Advanced Price Pattern Scanner”. This video covers some basic operation with Advanced Price Pattern Scanner in MetaTrader.
Advanced Price Pattern Scanner YouTube Video: https://www.youtube.com/watch?v=A1-IUr6u5Tg
Here are the links for Advanced price Pattern Scanner for Metatrader 4 and MetaTrader 5.
https://algotrading-investment.com/portfolio-item/advanced-price-pattern-scanner/
https://www.mql5.com/en/market/product/24679
https://www.mql5.com/en/market/product/24678
Price Breakout Pattern Scanner is the popular Breakout Pattern Scanner with affordable price with many powerful features. It can detect Triangle, Falling Wedge, Rising Wedge pattern, Head and Shoulder Pattern, Double top and Double Bottom. As a added bonus, you have access to 52 Japanese candlestick pattern + Smart Renko. However, this scanner can repaint. It does not support multiple timeframe pattern scanning. Below are the links to Price breakout Pattern Scanner for MetaTrader 4 and MetaTrader 5.
https://www.mql5.com/en/market/product/4859
https://www.mql5.com/en/market/product/4858
https://algotrading-investment.com/portfolio-item/price-breakout-pattern-scanner/
The main difference is that Price Breakout Pattern Scanner is repainting pattern scanner whereas Advanced Price Pattern Scanner is non-repainting pattern scanner.
Related Products


