Introduction to EFW Index for trading
By definition, an equilibrium fractal wave is a triangle made up from two price movements in opposite direction. When the price is moving towards the equilibrium price, the equilibrium fractal waves propagate. In the financial market, various shapes of equilibrium fractal wave exist. They are often mixed and jagged to form more complex price patterns. The shape of each equilibrium wave can be described by their shape ratio. This shape ratio can be used to identify the shape of an individual equilibrium fractal wave in the complex price patterns. As you can tell from the equation, the shape ratio of equilibrium fractal wave is independent from their size.
The shape ratio of equilibrium fractal wave = current move in price units (Y2)/ previous move in price units (Y1).
Momentum ratio of equilibrium fractal wave = latest price move of current wave in price units (Y3)/ first movement of previous wave in price units (Y1) where Y3 and Y1 are in the same direction.
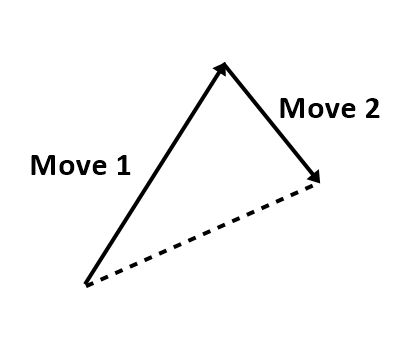
Figure 3-1: One unit cycle of Equilibrium Fractal Wave is a triangle made up from two price movements.
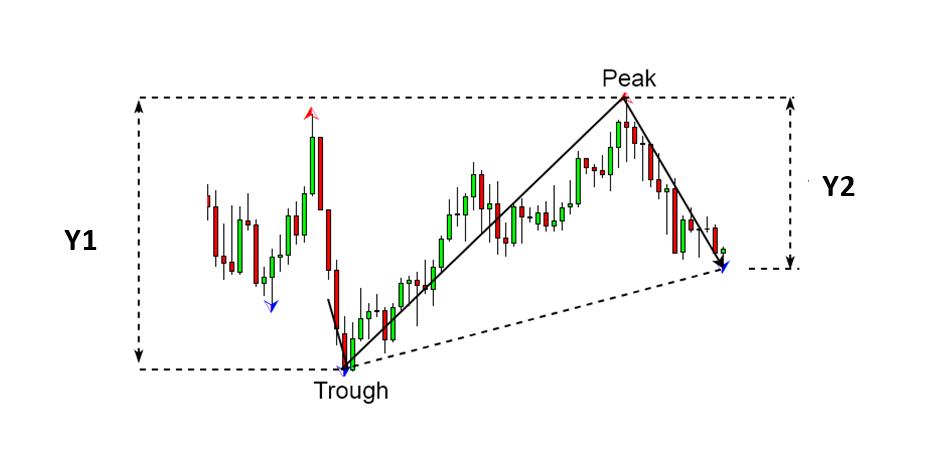
Figure 3-2: one unit cycle of an equilibrium fractal wave in the candlestick chart.
Two important shape classes for equilibrium fractal wave include Fibonacci based ratios and non-Fibonacci based ratios. Trader can trade both ratios if they wish. However, traders are required to have a knowledge on which shape of equilibrium fractal wave is more suitable for your trading. To find out the suitable EFW shape, you can simply use the “Equilibrium Fractal Wave (EFW) Index” to do a simple exploratory analysis. The EFW index can be calculated using following equation.
Shape Ratio index = number of the particular shape Ratio / number of peaks and troughs in the price series.
Momentum Ratio index = number of the particular Momentum ratio / number of peaks and troughs in the price series.
The very best part of equilibrium fractal wave trading is that it combines both the exploratory analysis and trading in one practice. In the exploratory analysis, you will build your trading logic. In the trading, you will use the logic to build the best outcome for your trading. In the exploratory analysis, you will use the EFW index exclusively. With the EFW index, you can answer the following questions:
- What particular shape of equilibrium fractal wave exists in the price series?
- Which particular shape of equilibrium fractal wave is dominating in the price series?
- How frequently have they occurred in the past?
- Which financial instruments like currency pairs and stocks prices are easier to trade than rest of the market?
- Is the fifth regularity the most dominating characteristics of this financial market?
For example, Figure 3-3 shows the Shape Ratio indices for EURUSD daily timeframe for the three ratios including 0.618, 0.500 and 0.382. We have shown the three indices over the time. From the chart, it is possible to figure out that 0.618 is the most dominating ratio for EURUSD followed by the ratio 0.500. Would this tendency hold the same for GBPUSD too? Let us check the Figure 3-4 for this. You can tell that the ratio 0.500 is more frequently occurring than the ratio 0.618. For GBPUSD and EURUSD, the ratio 0.382 is the least occurring shape of the equilibrium fractal wave. By inspecting the indices, we can tell that EURUSD and GBPUSD have a strong presence of equilibrium fractal wave. For this reason, we can use any trading analysis and strategies designed for the fifth regularity. To calculate the Shape Ratio index, we typically recommend using as much data as you can. For example, in Figure 3-3 and Figure 3-4, we have used more than 3000 bars (i.e. around 10 years long history) to calculate each EFW index. You might be able to use more data if you wish.
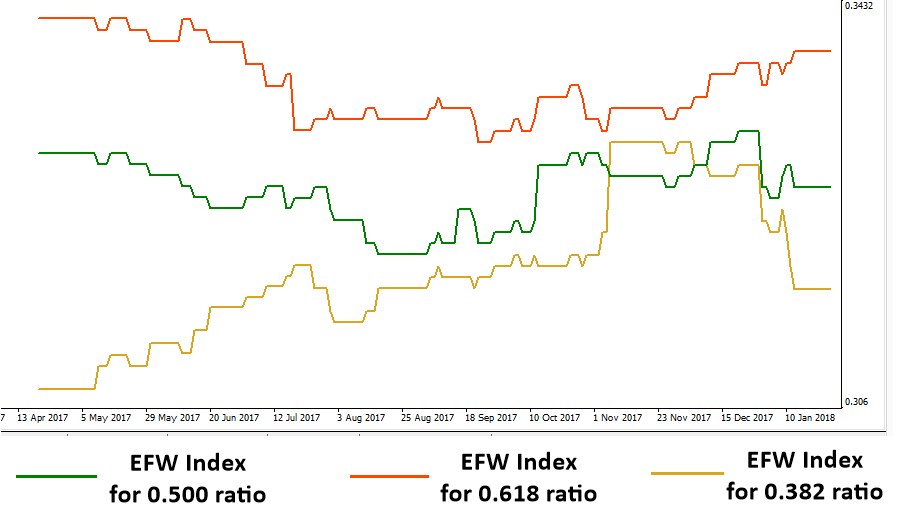
Figure 3-3: Shape Ratio index for EURUSD D1 timeframe from 2006 09 20 to 2018 01 20.
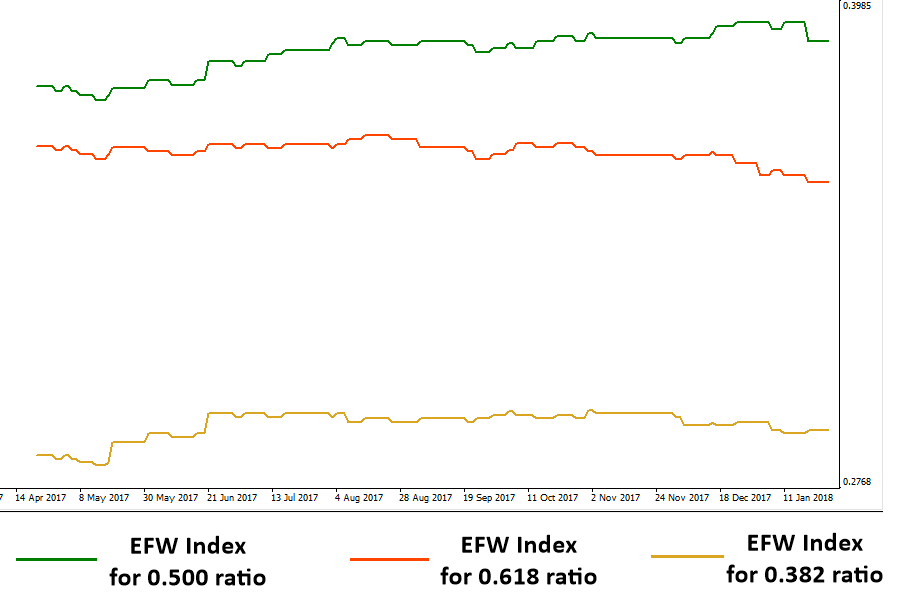
Figure 3-4: Shape Ratio index for GBPUSD D1 timeframe from 2007 01 04 to 2018 01 20.
About this Article
This article is the part taken from the draft version of the Book: Scientific Guide To Price Action and Pattern Trading (Wisdom of Trend, Cycle, and Fractal Wave). This article is only draft and it will be not updated to the completed version on the release of the book. However, this article will serve you to gather the important knowledge in financial trading. This article is also recommended to read before using Price Breakout Pattern Scanner, Advanced Price Pattern Scanner, Elliott Wave Trend, EFW Analytics and Harmonic Pattern Plus, which is available for MetaTrader 4 and MetaTrader 5 platform.
Below is the landing page for Price Breakout Pattern Scanner, Advanced Price Pattern Scanner, Elliott Wave Trend, EFW Analytics and Harmonic Pattern Plus. All these products are also available from www.mql5.com too.
https://algotrading-investment.com/portfolio-item/price-breakout-pattern-scanner/
https://algotrading-investment.com/portfolio-item/advanced-price-pattern-scanner/
https://algotrading-investment.com/portfolio-item/elliott-wave-trend/
https://algotrading-investment.com/portfolio-item/equilibrium-fractal-wave-analytics/
https://algotrading-investment.com/portfolio-item/harmonic-pattern-plus/
Related Products


