Trading with the Shape ratio of Equilibrium Fractal Wave
The simplest way to trade with a single equilibrium fractal wave is to trade with their shape ratio. The shape ratio is an identifier of the shape of individual equilibrium fractal wave in the financial market. Hence, each equilibrium fractal wave has one corresponding shape ratio. The way the shape ratio trading works is very similar to the Fibonacci retracement trading. In the Fibonacci retracement trading, we predict the potential reversal area by projecting 38.2%, 50% or 61.8% the retracement. Anyone understanding this simple Fibonacci retracement trading can readily understand the trading operation with the Shape Ratio too because they are similar in term of operation. However trading with shape ratio has several distinctive advantages against the Fibonacci retracement trading. Trader must thoroughly understand the difference between shape ratio trading and Fibonacci retracement trading to yield the better performance.
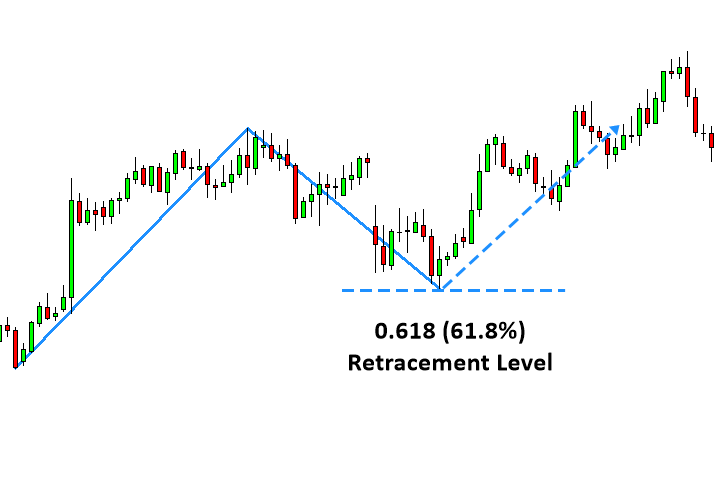
Figure 3-5: Fibonacci retracement trading example with ratio 0.618 on EURUSD daily timeframe.
Firstly, in the Shape Ratio trading, we do not limit our trading opportunity to Fibonacci ratios only. In the Fibonacci retracement trading, traders assume that the Fibonacci ratios like 0.382, 0.500 or 0.618 or some other Fibonacci ratios are only ratios they can trade. In the shape ratio trading, this assumption is not valid any more. Trader can trade with any shape ratios including the Fibonacci ratios and non-Fibonacci ratios. Since the EFW index tells us exactly which shape ratio is dominating in the particular financial market, it is possible we can pick up the shape ratio based on the EFW index. For example, trader can even trade the shape ratio 0.850 or 0.450 if the EFW index indicates the strong presence of the shape ratio 0.850 or 0.450 in the financial market. Of course, the ratio 0.850 and 0.450 are not the Fibonacci ratios. As we have shown in the previous chapter, it is possible to have the higher EFW index with non-Fibonacci ratios. For example, in EURUSD daily timeframe, the ratio 0.850 had much stronger presence than the golden ratio 0.618.
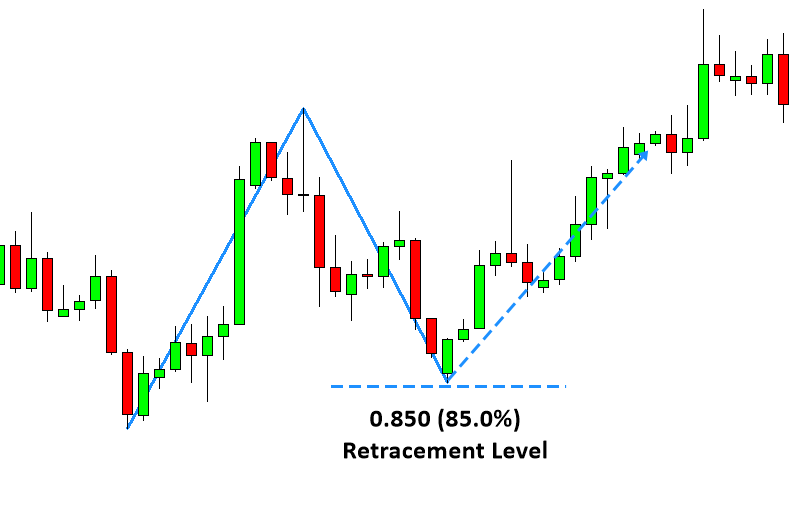
Figure 3-6: Shape ratio trading example with ratio 0.850 on EURUSD daily timeframe.
Secondly, in the shape ratio trading, we believe that some ratios will perform better than the other ratios. At the same time, we also believe that the same ratio can perform differently for other financial instrument. This is related to the loose self-similarity (heterogeneity) characteristic of equilibrium fractal waves. For this reason, we do not blindly apply any ratios for our trading even they are Fibonacci ratios or even golden ratios. We can get the guidance for choosing the ratios from the EFW index too. By applying the EFW index, we can get the good ideas on which shape ratios we should avoid and which ratios we should use for the particular financial market.
Thirdly, in the Fibonacci retracement trading, trader assumes that price will reverse at the projected level. In the shape ratio trading, we do not assume that the price will reverse at the projected level, but we are open to both reversal and breakout (expansion) trading. It is related to the extension (transformation) characteristic of equilibrium fractal waves. We have already covered that the last leg of equilibrium fractal wave can be extended to form the bigger equilibrium fractal wave. This extension can happen when new equilibrium source arrived to market including any economic data release or any significant market news release. The extension will never be able to break the fractal nature of the financial market because the extension creates merely another bigger equilibrium fractal wave (i.e. another bigger triangle). For this reason, in the shape ratio trading, we prefer to bet on the size of equilibrium fractal wave rather than assuming the reversal. How to trade is nearly identical to the support and resistance trading. We will take buy or sell action when the price enter the buy and sell trigger level around the projected level.
![]()
Figure 3-7: Illustration of price transformation (extension) from path 1 to path 2 to meet new equilibrium price due to an abrupt introduction of new equilibrium source in the financial market.
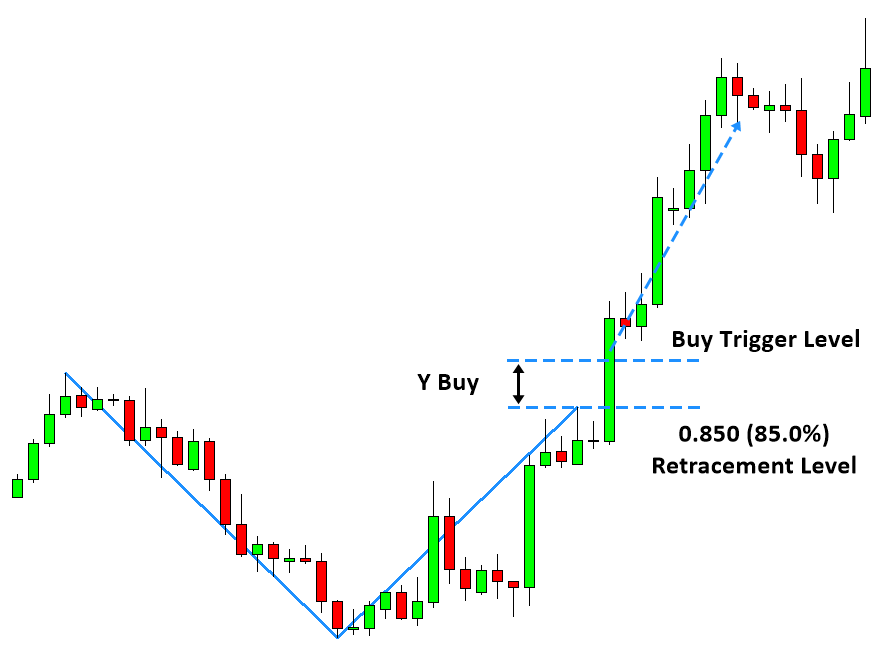
Figure 3-8: Shape ratio trading with breakout example on EURUSD H4 timeframe.
About this Article
This article is the part taken from the draft version of the Book: Scientific Guide To Price Action and Pattern Trading (Wisdom of Trend, Cycle, and Fractal Wave). This article is only draft and it will be not updated to the completed version on the release of the book. However, this article will serve you to gather the important knowledge in financial trading. This article is also recommended to read before using Price Breakout Pattern Scanner, Advanced Price Pattern Scanner, Elliott Wave Trend, EFW Analytics and Harmonic Pattern Plus, which is available for MetaTrader 4 and MetaTrader 5 platform.
Below is the landing page for Price Breakout Pattern Scanner, Advanced Price Pattern Scanner, Elliott Wave Trend, EFW Analytics and Harmonic Pattern Plus. All these products are also available from www.mql5.com too.
https://algotrading-investment.com/portfolio-item/price-breakout-pattern-scanner/
https://algotrading-investment.com/portfolio-item/advanced-price-pattern-scanner/
https://algotrading-investment.com/portfolio-item/elliott-wave-trend/
https://algotrading-investment.com/portfolio-item/equilibrium-fractal-wave-analytics/
https://algotrading-investment.com/portfolio-item/harmonic-pattern-plus/
Related Products


