Breakout Trading with Fractal Pattern
In this article, we introduce Breakout Trading with Fractal Pattern applicable in Forex and Stock Trading. Fractal Pattern is the ultimate tool to predict Fractal Wave in the financial market. We are not talking about the Fractal indicator by Bill Williams. Fractal indicator does not adapt the fractal wave since the indicator is not alternating peak and trough in turn. However, we are talking about more like Elliott Wave pattern or Fractal Wave pattern, which encompasses small waves inside bigger wave.
What is Fractal Pattern in Space or in Time ?
When the same or similar geometric shape is repeating infinitely in different scales, we call it “Fractal”. The self-similarity is the typical property of fractal. Fractal can be observed everywhere in the universe. In the space, tree, human anatomy, mountain, and, coast, we can observe fractal. For example, in the Romanesco Broccoli, the smaller piece, if they are broken off from the bigger piece, do look like the big piece. Like this, in Fractal, the same or similar patterns are occupying the entire structure of an object.
Another example of fractal in nature is a coastline. The coastline shows the similar details on different scales. The waves provide a steady force to shape the coastline over time. When the coastline is straighter, the waves will keep pounding until they become more fractal. This mechanism cut the straighter line of coastline more wobbly in the zigzag pattern. Then, the straighter line inside the zigzag line will be cut into the smaller zigzag pattern. As a result, the coastline will look similar whether you zoom in or zoom out in the map.
If you still found it difficult to understand fractal, then let us introduce more straightforward example. For example, Sierpinski triangle is good example of self-similarity and fractal. Sierpinski triangle is made up from identical shape, the triangle. In Sierpinski triangle, the triangle is continuously expanding to build the bigger triangle. As we magnify any part of Sierpinski triangle, we see the identical triangles. Hence, Sierpinski triangle is one of the good example to explain fractal.
Beside Sierpinski triangle, snowflake, heartbeat rate, structure of brain and, internal organs are another examples of fractal too. Fractals can be classified into few different types depending on the degree of the self-similarity. For example, when the repeating geometry is strictly identical like snowflake and Sierpinski triangle, we call them as the strict self-similarity. When the repeating geometry is similar but not identical like coastline and heartbeat rate, we call them as the loose self-similarity. This loose self-similarity is often referred to as the statistical self-similarity because we can observe the repetition in the degree of complexity within statistical range not the exact pattern.
What is Fractal Wave or Fractal Pattern in Time?
Fractal-Wave is the representation of the Fractal pattern in the time dimension. Fractal pattern is made from a repeating pattern at many different scales. To give you some idea on fractal wave in the financial market, let us have some real world example using currency pairs. Regardless of how long the market goes on, the market can be described with few equilibrium fractal waves. For example, the financial prices series with 20 years of history can be described using two equilibrium fractal waves. Likewise, the price series with 2 weeks historical data can be described using two equilibrium fractal waves too. As you can see, they looks very similar. The main difference is that there are more jagged triangles inside the financial price series for 20 years comparing to the two weeks data. By definition, the building block of fractal wave is equivalent to a triangle.
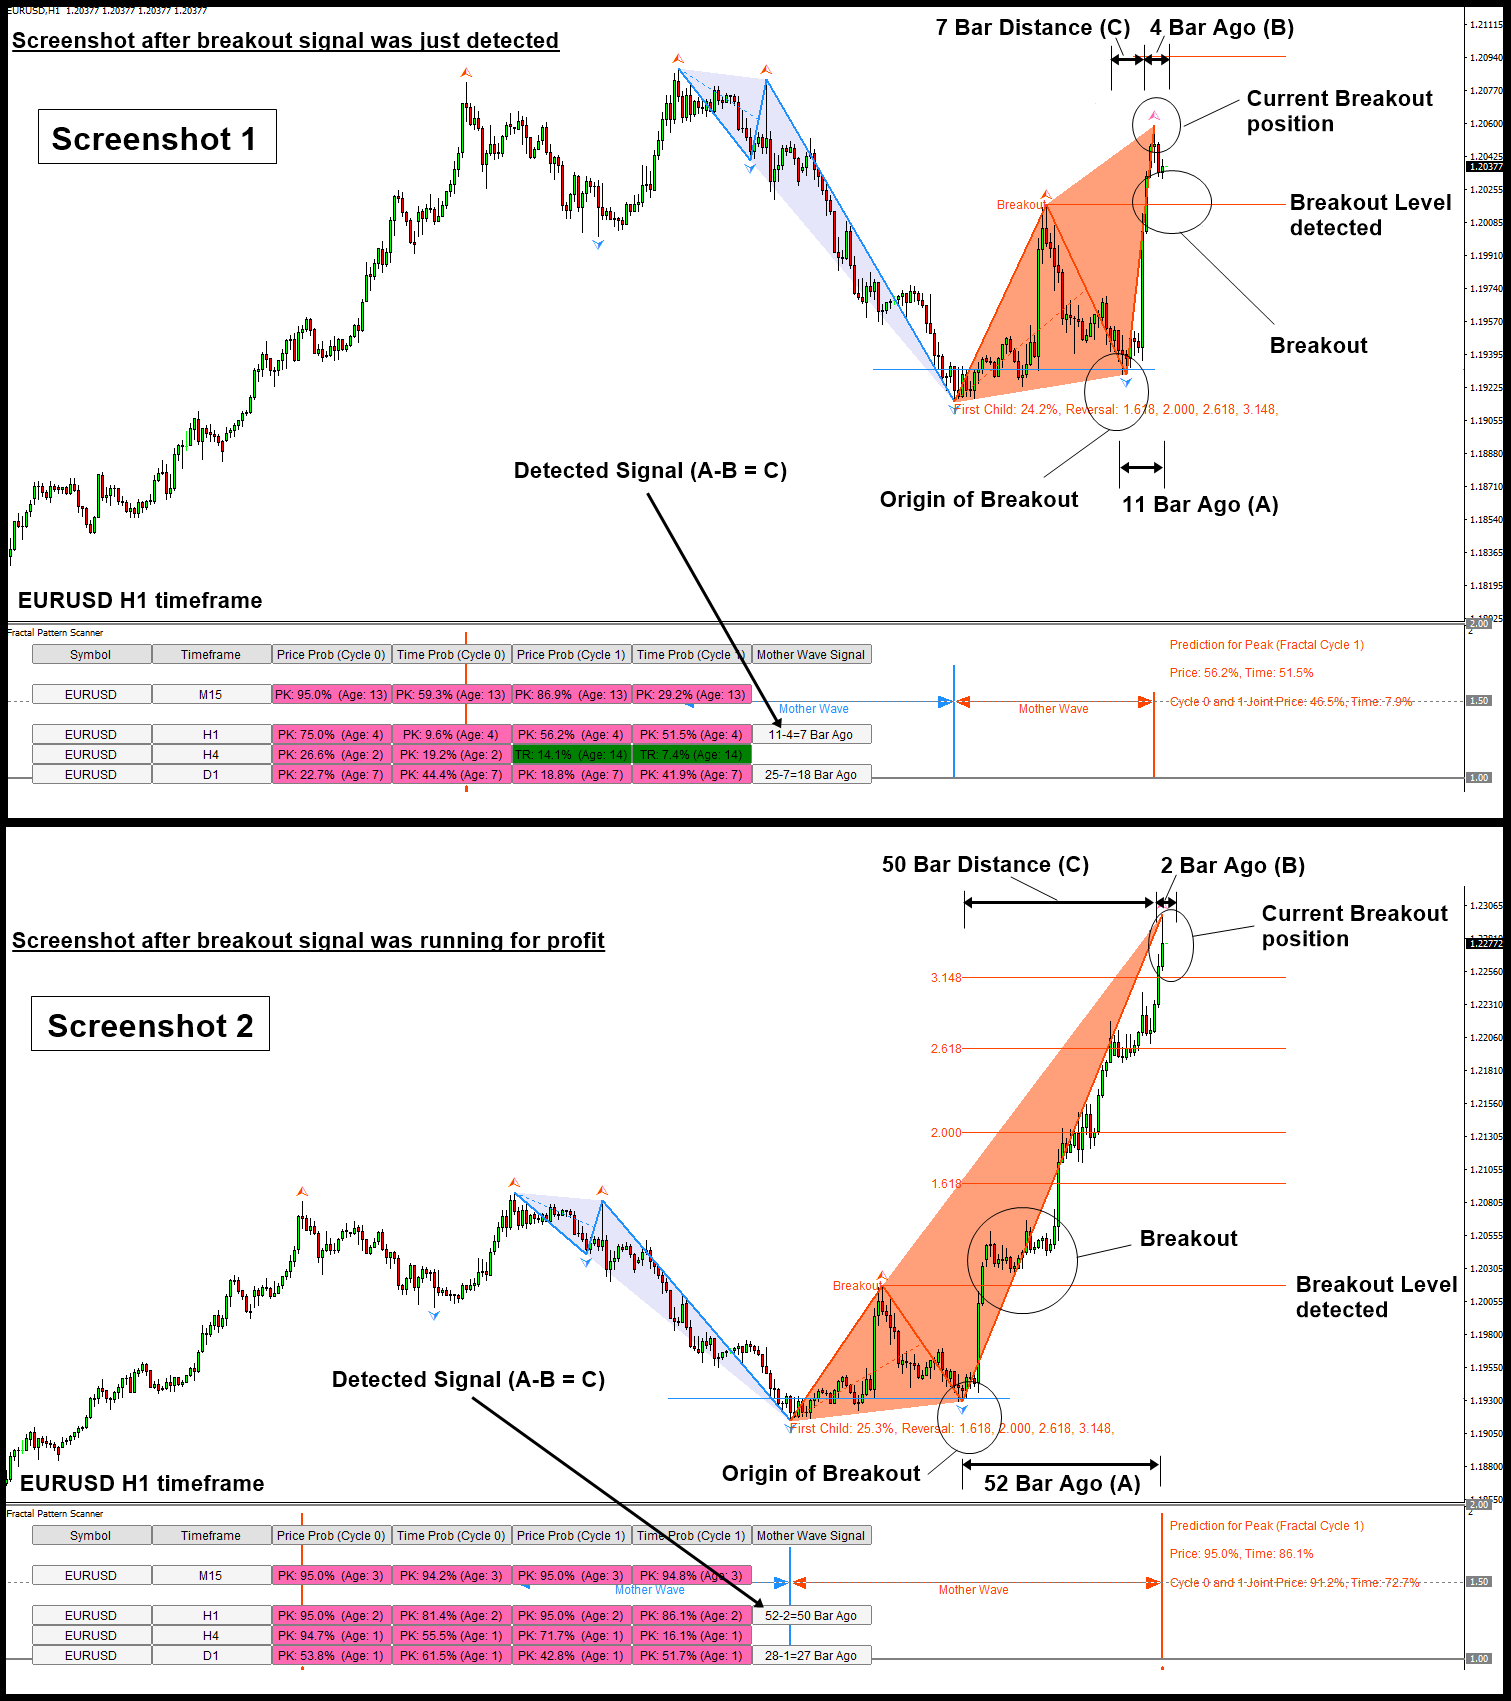
We call this big fractal wave made up from several mini waves as the Mother Wave. We call the mini waves inside the mother wave as child waves. In Fractal Pattern Scanner, detecting of highly probable breakout pattern is an automatic process. Hence, you will notified when the potential breakout pattern is detected. When the breakout pattern is detected, we need to understand what is the A, B, C to trade with breakout. A, B and C are all expressed as the number of bars for easy application in practice. We count the bars from the latest bar to backwards. For example, 2 bar ago in H1 timeframe means that it references the bar in 2 hours ago. Here is the brief description of A, B and C for trading breakout in terms of their time reference.
A: Position of the origin (peak or trough) of the breakout: This is the important reference for breakout because this is the first fixed reference position before breakout happens.
B: the current position of breakout (peak or trough) after the profit was running for sometime.
C: Distance between origin of breakout and current position of breakout ( A-B =C)
Hence, with A, B and C, we have the following relationship of A – B = C. A, B, C helps you to recognize if the signal is how fresh or mature for your trading. For example, if the distance C is small, it means that it is fresh and young opportunity to trade. If the distance C is large, it means that the breakout signal was running for some profit already.
For working example in H1 timeframe, 52 – 2 = 50 indicates that the origin of Breakout was 52 bar ago (i.e 52 hours ago) and current position of breakout is 2 bar ago (i.e. 2 hour ago). Hence, the distance C is 50 bar (50 hours.).
Up to this point, someone might question back why not using the actual breakout at the breakout level as the time reference ? Yes, it could be valid thinking. However, counting the actual breakout at the breakout level is fuzzy. Sometime, price might just touch the level, pull back for sometime and revisit the breakout level, etc. Around this area, all sort of things can happen. However, peak and trough before breakout happens provides the fixed reference point for the breakout.
We hope that with this simple article, you can understand how peak and trough analysis is connected to Breakout Trading. Please check the screenshot to find out ABC of breakout trading. The screenshot combines two screenshots. First screenshot shows when the breakout was just detected in EURUSD H1 timeframe. Second screenshot shows the breakout ran for profit for sometime in the same chart. You will find this is almost easy as ABC with the screenshot.
Here is the landing page to our Fractal Pattern Scanner. With Fractal Pattern Scanner, all the breakout trading opportunity detection is automatic.
https://www.mql5.com/en/market/product/49170
https://www.mql5.com/en/market/product/49169
https://algotrading-investment.com/portfolio-item/fractal-pattern-scanner/
Related Products


