Breakout Trading and Turning Point (i.e. reversal)
Breakout trading can be considered as momentum trading whereas turning point (i.e. reversal) strategycan be considered as mean reversion trading. To use these two trading strategy in more effective manner, we need to understand how Mean reversion and momentum trading work in Forex and Stock market. We will be cover these two important trading strategy in this short articles.
Mean reversion and momentum trading are the two dominating trading strategies used in the Forex and Stock Market. Most of trading strategy we can think of will fall under a category of mean reversion or momentum trading. These two trading strategies show completely different market timing. For example, momentum trading tries to take the entry when the price shows a strong directional movement. Momentum trading is often considered as the trend following strategy. On the other hand, mean reversion trading tries to take the entry when the price is far from the mean. Mean Reversion trading is often the core trading principle behind “Buy Low and Sell High” strategy like value investing. In momentum trading, the trader tries to pick trend whereas in the mean reversion trading, trader tries to pick the turning point.
Among the trading community, the preference between the mean reversion trading and momentum trading are completely different. Some trader uses the mean reversion trading better and some trader uses the momentum trading better. To find out which trading style you are good at with, you need to try both trading strategies. In fact, mean reversion and momentum trading can explain the water and fire elements of the human characteristics. Mean reversion trading explains the human characteristics of being “Cautious” or being “Realistic” like water. Momentum trading explains the human characteristics of “Impulsive behaviour” or “Heard Behaviour” like fire. However, the wise trader will not view these two trading strategy as two different subjects because one comes after the other. For example, mean reversion will come after momentum. Likewise, momentum will come after mean reversion. Therefore, the legendary trader like Jesse Livermore emphasized to observe the turning point, where the market shift its major direction. This does not mean that you have to trade against the large momentum in the financial market. This means that we need to buy the stock or currency as low price as possible near the turning point before another momentum is established. Once the momentum is established, it is not easy to ride on the momentum because the price move too fast. The heard or impulsive behaviour in the market can push the price in the shortest possible time. If you enter them too late, then you are likely to end up buying the stock or currency in high price. You will either make a thin profit or loss. For this reason, you need to find a way to enter the market between the turning point and the momentum. In doing so, you need to become familiar with the turning point as well as the trend. Therefore, you need to learn the methods of identifying the turning point and trend.
1.2 Market Timing of Turning Point and Trend
When you trade in the financial market, the first thing you need to understand is the turning point and trend. If you read many trading articles and books, you will find the diverse opinion over turning point and trend. Many people view turning point and trend as two separate subjects. However, it might be better to understand turning point and trend as one subject.
Let us try to understand the trend. To do so, let us take human as an analogical example. We are born, we grow up, we become mature, and then we die. During this process, we can observe that there are four main stages. These four stages are universal across many creatures and objects observable in the earth.
Birth – Growth – Maturity – Death
Trend also goes through these four stages. Let us take an example in the financial market. For example, if we hear that Apple Inc. has some temporary problem in their smartphone supply line, this could stir up the stock price of Samsung Electronics because the demand for Samsung’s smart phone will be increased. Once this news is spread on the financial market, the upward trend will be born for Samsung’s stock price. At the beginning, this news could be known by few people. Later, more and more people could hear this news. Hence, Samsung’s stock price can build up upward momentum. However, this momentum will not last forever. Once people start to recognize that price rallied too high and some people start taking the profit by selling the stocks, the upward momentum can slow down. Especially, if we hear that Apple recovered the temporary problem in their smartphone supply line, the trend could die completely. As shown in this example, Birth, Growth, Maturity, and Death are the life cycle of trend.
Now let us revisit the definition of turning point and trend. Turning point is the beginning of new trend after the death of an old trend. Hence, turning point strategy refers to the strategy that tries to pick up this new trend as early as possible. This sometimes involves picking up the turning point at the birth stage of the trend. In financial trading, trend strategy typically refers to the strategy that tries to pick up the trend during the growth stage. Hence, most of trend strategy we know is in fact momentum strategy. When the growth of trend is strong, many technical indicators are designed to react on this strong growth.
Therefore, most of trend strategy provides you entry at the growth stage not at the birth stage. For example, if you trade on the buy signal when 20 moving average line crosses over the 50 moving average line, you do need strong upwards movement to lift the 20 moving average line over the 50 moving average line.
In contrast to this, in the turning point strategy using the Fibonacci ratio analysis, Harmonic patterns, Elliott wave patterns and X3 patterns, we are looking for the newly born trend instead of the trend in growth stage. Hence, the main difference in turning point and trend strategy is when to enter during the life cycle of trend. Typically, we are seeking to enter near the birth of trend in the turning point strategy. In the trend strategy, we are seeking to enter at the growth stage of trend. You can probably see the difference between these two strategies.
In our example, we considered only one trend. In practice, situation is tougher because we will have many financial and political news released in 24/7 days. Hence, we have to deal with the collection of trends instead of one trend. Some trends will be cancelled off each other and some trends will be adding up to form bigger trend. As a result, sometimes, this collective trend can have a clear direction. However, sometimes, we may not see clear direction from this collective trend but just ranging movement. At the same time, we could have many short-lived trends confusing our entries. Therefore, our trading strategy is subjective to probability of success rate regardless of that you are using turning point strategy or trend strategy.
1.3 Trading with Turning Point and Trend
In the trend strategy, your entry will be at the strong trend movement during the growth phase. This might be good if our entry is not too late. However, if we are late, then we will encounter the loss from early enterers starting to materialize their profits. In the turning point strategy, we are trying to pick up the new trend as early as possible in their birth stage. Therefore, it gives you the opportunity to become the early enterer. Hence, the profitable range is longer than typical trend strategy. In addition, you can also quit your position much earlier than other trend strategy players can.
The longer profitable range means that we need fewer trades to achieve good profits. At the same time, there are some weaknesses of the turning point strategy too. For example, turning point strategy might signal buy or sell entry too early while the ongoing trend was not finished. Since both trend and turning point strategy have their own strength and weakness, it is possible that you can compromise between turning point strategy and trend strategy too. For example, you do not immediately trade at the turning point signal but you can wait until you observe that some price movement is following the new trend direction. Therefore, this becomes semi-turning point strategy. Many of good traders use semi-turning point strategy since they are the hybrid of turning point strategy and trend strategy. The fact is that skills to predict the turning point is important for the successful trading. Even though you are trading with trend strategy, it is still advantageous to have good skills in predicting turning point. Hence, the methodology of predicting turning point was sought after by many legendary traders in the financial market nearly 100 years. It is one clear piece of winning logic for successful trading helping “You act faster than other trader.”
1.4 Price Patterns to identify the Potential Turning Point and Trend
To understand the technical turning point, it is important to check its connection with economics. For example, in Stock market trading, the underlying value of a company can explain the occurrence of the major turning point in the market. Likewise, in the foreign exchange market, the strength and weakness of a currency is often influenced by the fundamental value of a country. The fundamental and economic data release can cause to change the direction of the current price movement. As a result, they often become the major driving force behind the bullish and bearish turning point. Hence, to understand why an important turning point occurs in the financial market, we recommend you to look at following three cases.
• Turning point in the Stock market with “Value investing”
• Turning point in the Forex market with “Fundamental analysis”
• Pairs Trading with turning point
When you understand the driving force of the turning point in connection with economics, it helps you to follow the flow of the smart money from the investment banks and hedge funds. Besides, the price pattern can also help you to predict the turning point technically. When you apply the price pattern together with the knowledge of the fundamental driving force of the turning point, you can increase your performance marginally. Therefore, it is important to understand the price patterns used by the trading community last 100 years. We list the important price patterns for your technical analysis below.
• Horizontal support and resistance
• Diagonal support and resistance (i.e. trend lines)
• Triangles and wedge patterns
• Fibonacci analysis
• Harmonic pattern
• Elliott wave theory
• X3 Chart Pattern
To apply these price patterns better in practice, we must understand the origin of these price patterns with the scientific view. Fractal and fractal wave can explain the scientific rational behind these price patterns. Hence, we will look at how these price patterns are connected with “Fractal” and “Fractal Wave”. The scientific knowledge around these price patterns will help you to understand the flow of the financial market as said by Mark Twain “History Doesn’t Repeat, But It Often Rhymes”. In addition, you will find out that “Fractal” and “Fractal Wave” is the powerful tool to overcome the limitation of the modern trend and cycle analysis. The price patterns are in fact the practical application of “Fractal” and “Fractal Wave” in the financial market. Furthermore, we will provide the universal pattern framework to help you understand these price patterns with one unified knowledge. Therefore, we will make use of the X3 Pattern Framework while educating these price patterns.
1.5 Breakout Trading and Reversal Trading with Fractal Pattern
Fractal Pattern scanner will do a lot of complicated calculation at the background. However, it provides really simple trading operation for you. Hence, here is some explanation.
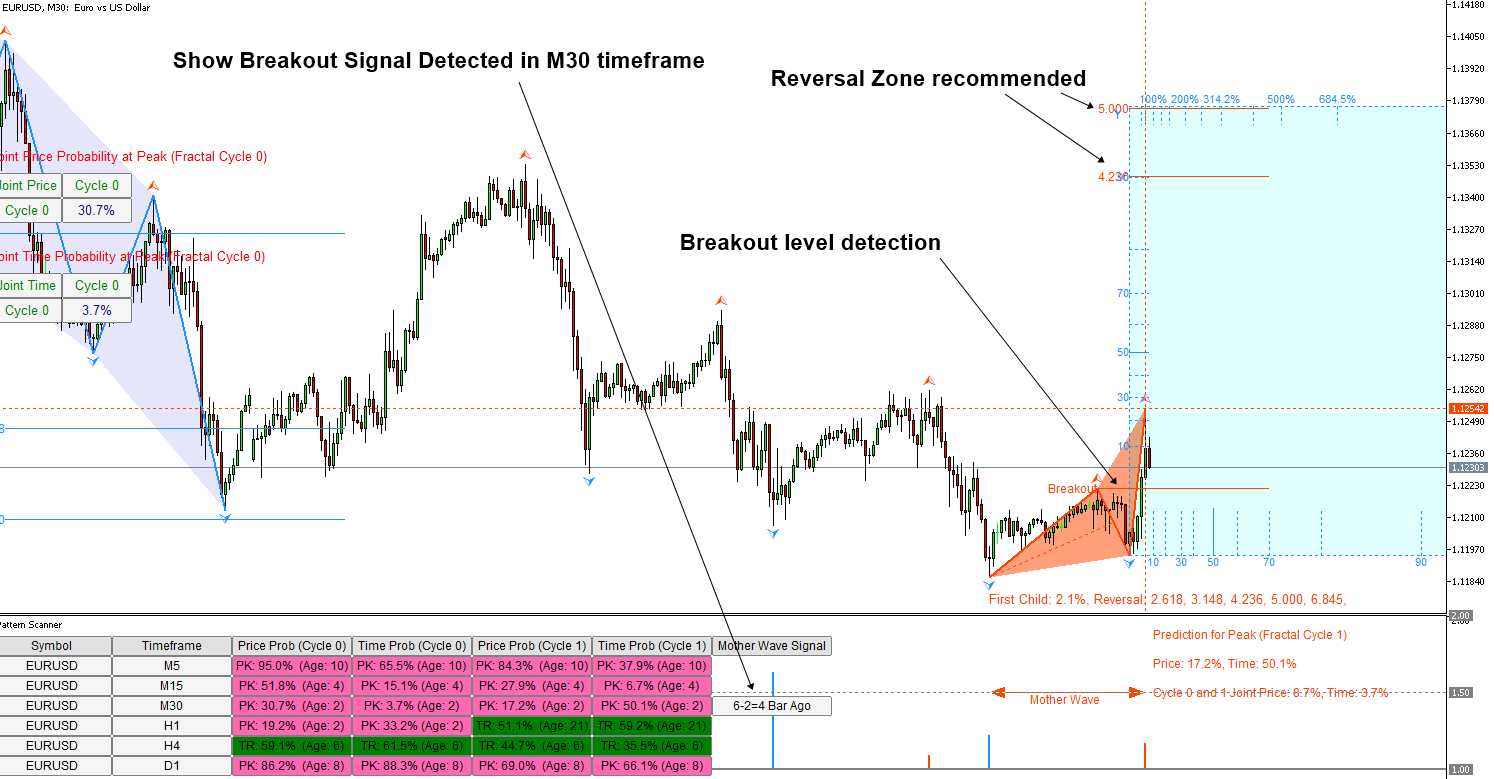
Firstly, the Mother Wave pattern (i.e. breakout patter) will provide you breakout trading opportunity. When the price crosses the breakout line, there is a good chance to catch profit from this breakout.
The good thing is that it also provides the potential reversal price level as soon as the breakout pattern is detected.
In summary, for your trading, you use breakout for the first profit opportunity, then you will use reversal for the second profit opportunity. However, if the market is too strong on breakout, then you can skip the second profit opportunity and just keep holding the first breakout opportunity.
That is it. Trading operation is simple. However, you can digest these articles for your trading. You could become the professional trader, who can pull the profit from Fractal Pattern and Fractal Wave. You understand the principles of nature and you make profits from them. It is awesome things to do in the this world.
https://algotrading-investment.com/2020/05/24/fractal-pattern-scanner-trading-operation-tips/
https://algotrading-investment.com/2020/05/31/breakout-trading-or-reversal-trading/
https://algotrading-investment.com/2020/06/11/abc-of-breakout-trading-with-fractal-pattern/
The turning point probability is a powerful tool that you can use it as both reversal trading or breakout trading within your technical analysis. You can watch this YouTube video titled as “Breakout Trading vs Reversal Trading (Turn Support & Resistance to Killer Strategy)” in this link below to get some hands on practice with breakout and reversal trading opportunity with Support and Resistance Technical Analysis.
YouTube Video Link: https://youtu.be/UbORmOacKIQ
Related Products


