Pairs Trading and Spread Analysis Guide
Pairs Trading and Spread Analysis is the efficient tool to monitor the unusual market event or market anomaly. The advantage of Pairs Trading and Spread Analysis comes from its sophisticated statistical analysis across different instruments. For Forex and Stock market trading, it works both. Many hedge fund manager and professional fund manager are using Pairs Trading and Spread Analysis to seek profits.
In Optimum Chart, we provide the automated solution for Pairs Trading and spread analysis. This sophisticated statistical analysis can be done in few button clicks. All you have to do is to apply the end results for your trading.
The good thing about Optimum Chart is that it provides the the complete statistical analysis across all time frame and all symbols. Then it would provide the powerful insight in one table for all available instruments.
In Optimum Chart, this powerful statistical analysis can be done in two steps.
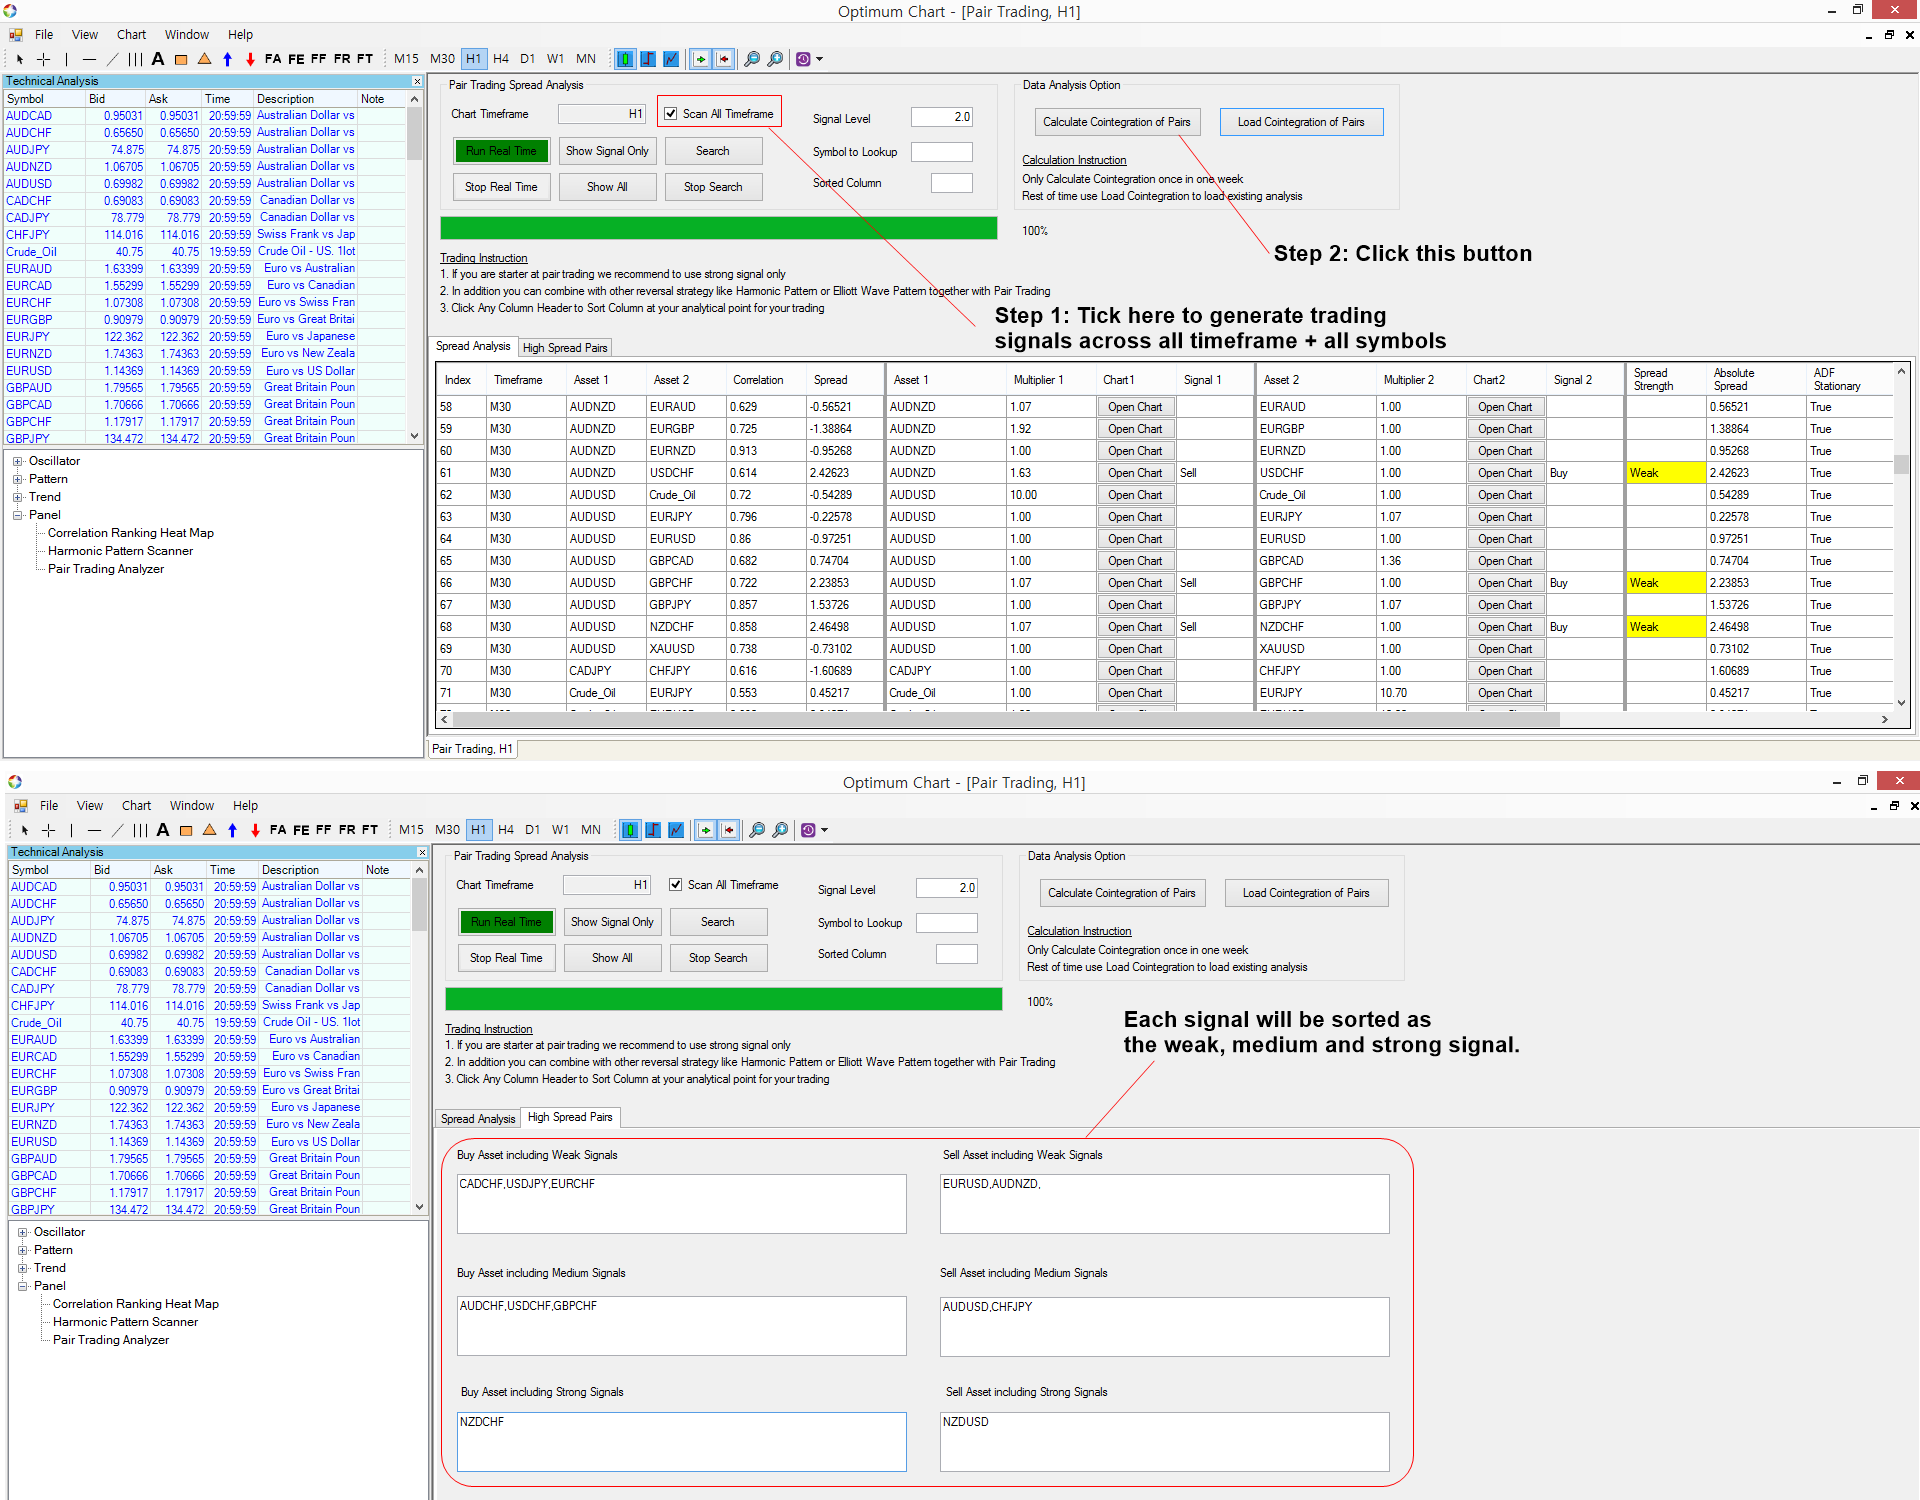
Step 1: Tick on Scan all timeframe box
Step 2: Click on Calculate Cointegration of Pairs
That is it. It is easy as ABC while the pairs trading and spread analysis is used by the sophisticated analyst in the fund management and hedge fund industry. After the button click, Optimum Chart would perform lots of calculation at background until it go through all the possible combination of different symbols across all timeframe. After that, it would provide you the buy and sell signals according to their spread strength. Hence, you will get weak, medium and strong signals according to the current spread.
The signals are simply determined by the magnitude of spread. In default signal setting, Weak signal are produced if the spread is between 2 and 3. Medium signals are produced if the spread is between 3 and 4. Strong signals are produced if the spread is over 4. Optimum Chart will also provide the lot size multiplier after the computation is done. The lot size multiplier is determined by their tick value. Typical Forex market tick values are applied for Forex market. You can find the tick values of each Forex symbol in the link below.
https://algotrading-investment.com/2020/07/19/optimum-chart-forex-symbol-tick-values/
For the Stock market, the multiplier is simply the price ratio of two instruments. Multiplier helps you to determine how big the contract size (i.e. lot size or number of shares) for the pairs (i.e. for asset 1 and asset 2).
This video below can explain more about Pairs Trading and Spread Analysis with Optimum Chart.
YouTube Video Link: https://www.youtube.com/watch?v=gHL9MI6yysw
Landing page for our Optimum Chart can be found at below.
https://algotrading-investment.com/2019/07/23/optimum-chart/
Related Products


