Tutorial for Chart Patterns
To help your understanding with the chart patterns in Forex and Stock market, we provide the “Chart Patterns Tutorial” application. This “Chart Patterns Tutorial” application provides the chart pattern simulator to visualize the shape of the different chart patterns. The chart pattern simulator can visualize the shape of the following chart patterns:
- Price Patterns, recognized from Fibonacci analysis including Golden ratio
- Harmonic Pattern with simple and complex ratios
- Elliott Waves
- X3 Chart Patterns
- Triangle pattern, Rising Wedge pattern, Falling Wedge pattern and so on
On top of above five functionalities related to the chart pattern simulation, Chart Pattern Tutorial application also provides some additional functionalities related to the Fibonacci ratio and Pivot Point calculator. With these functionalities, user can use this tool as the calculator to project various Fibonacci ratios and pivot levels for your trading.
- Fibonacci Retracement calculator
- Fibonacci Expansion calculator
- Pivot Point calculator
In this tutorial, we will explain the five functionalities related to the chart pattern simulation first. Then we will cover how to use the calculator for the Fibonacci Retracement, Fibonacci Expansion, and Pivot point later.
Let us start with Chart Pattern Simulator first. The chart pattern simulator can be used by any level of trader for several different purposes. Firstly, the chart pattern simulator can be used to self-educate the trader with the different chart patterns. Secondly, the chart pattern simulator can be used to visualize or to modify the structure of the chart patterns that you want to trade. Thirdly, you can use the chart pattern simulator to find out the property of specific chart patterns. Direct Download for this “Chart Patterns Tutorial” application is available from the link below:
www.algotrading-investment.com/FreeDownload/ChartPatternsTutorial.zip
(Current Chart Patterns Tutorial Version 3.6)
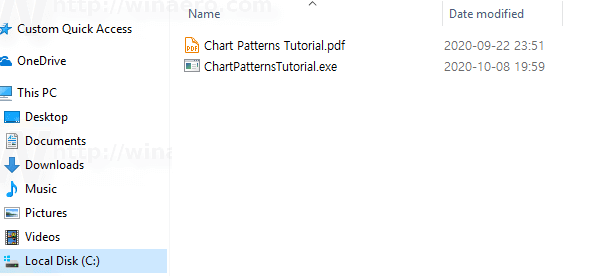
Figure 15-1: Contents inside the unzipped file
Once you have unzipped the download, you will find ChartPatternsTutorial.exe file inside the Folder. You need to know few things about the application. Firstly, the application was built from Dot Net Framework 4.5 for the time being. Hence, you need to have the Windows OS with Dot Net Framework 4.5 or later version installed. For your information, we do not have much knowledge on how this Dot Net Framework can run on other OS like Mac or Linux. Secondly, I can swear that there is no harmful virus inside this light application. However, some antivirus software can always cause some false positive alert (i.e. wrong alert) since many antivirus software are not so friendly toward the Dot Net Framework Application. Antivirus software Vendors ask contacting them in the case of false positive alert. However, there are literally thousands of antivirus software vendors and we cannot contact all of them to release one free software. Hence, when you get the false positive alert, you can ignore them. In the recent false positive turmoil, everyone is affected by this false positive issue to some extent. For example, many of our favourite games, favourite web browsers, and favourite free software are now flagged as virus due to the inaccurate virus detection algorithm in our antivirus software. This simply can not be changed by one person’s effort but it rather requires the efforts of the entire industry. This application is safe to use for sure. However, if you do not feel like to use it, then do not use it. Thirdly, this is the free software. Hence, there is no restriction on the usage. You are free to use and free to share on online. When you use this free application for trading, use it at your own risk.
This “Chart Patterns Tutorial” application is light and simple to use. We will start with covering the user interface of the chart pattern simulator. When you run the ChartPatternsTutorial.exe in your Windows, it will open a user form. On the top of the form, you will see the three text boxes. In this three text boxes, you can enter the Pattern Name, Pattern Structure, and Pattern Ideal Ratios. In the Pattern Name box, you can enter any descriptive name for your pattern. In the Pattern Structure box, you will be specifying the number of Fractal triangles in your pattern structure. Additionally, you can specify the closing retracement ratio and the factored expansion ratio in the same box. In the Pattern Ideal Ratio box, you can specify the individual ratios for each fractal triangles. As we have already covered in the Chapter “Defining profitable patterns”, you will use R to specify the retracement ratio and E to specify expansion ratio.
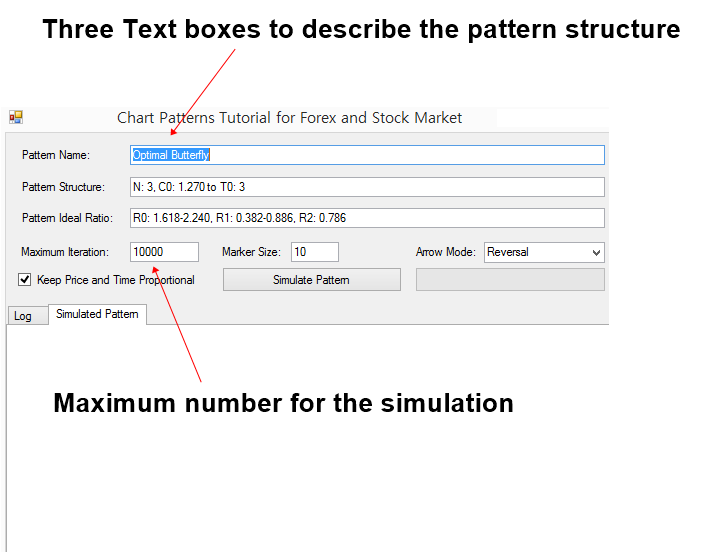
Figure 15-2: User interface of the Chart Patterns Tutorial Application
The application uses the computer simulation to visualize the chart patterns. The process is very similar to the Monte Carlo simulation or other computer simulation used in the financial market. The application will attempt to generate the price data that behaves like Fractal waves repeatedly. Maximum iteration specifies the maximum number of simulation to generate the price data. For your information, the generated price data are synthetic and unique in each generation. Although this Fractal wave simulation technique might be used to study many interesting properties of the financial market, we limit its application for the pattern visualization in this book.
Maximum iteration can be changed to smaller or bigger number. You need to know few things about Maximum iteration input. If you set the Maximum iteration with the small number like 10 or 20, then the simulation can be ended fast but without detecting the pattern structure. If you set the Maximum iteration with the big number like 100000 or 1000000 and so on, then the simulation can take too long. In another words, the workload for your computer is high. However, the chance to detect the patterns can increase. Then when you need to use small iteration and when you need to use large iteration? When you want to visualize simple patterns, then you can use small number of iterations. When you want to visualize complex patterns, then you might need to use large number of iterations.
Now let us start with some example. The simplest pattern that we have taught in this book is the patterns that are recognized from Fibonacci Ratio analysis except support and resistance. Let us simulate one Fibonacci retracement pattern with the Golden Ratio 0.618 for an example. This type of Fibonacci retracement pattern is one of the most popular chart patterns used by the Fibonacci Ratio analyst because they are simple. Enter the following inputs to the application.
Pattern Name: My First Chart Pattern
Pattern Structure: N1
Pattern Ideal Ratio: R0: 0.618
Once you have entered above details in the three boxes, click on “Simulate Pattern” button. Then the application will generate both bearish and bullish pattern that meet the structure and the ratios. Here is what you need to understand. Pattern generated through the simulation is unique every time. The ratio of the pattern would be near the ideal ratio but it will not be the dead accurate to the ratio always. For example, although we have set the ideal ratio 0.618 for the first fractal triangle, the generated pattern will not provide the dead accurate ratio to 0.618. In our example, the pattern provides the ratio of 0.628. In your simulation, the ratio would be different. It is the same in real life trading. We will never have the dead accurate pattern for our trading but they are just near the ratios. In fact, this simulation mimics what is happening in the real world and it tries to provide you some meaningful experience before you go to live trading.
As we have mentioned earlier, the simulation generates the synthetic price data that behaves like Fractal waves. In this application, it was set to generate the values between 0 and 100 because it is easy to count by everyone. In the real world Forex and Stock market, you can have all sort of scales from decimals to millions.
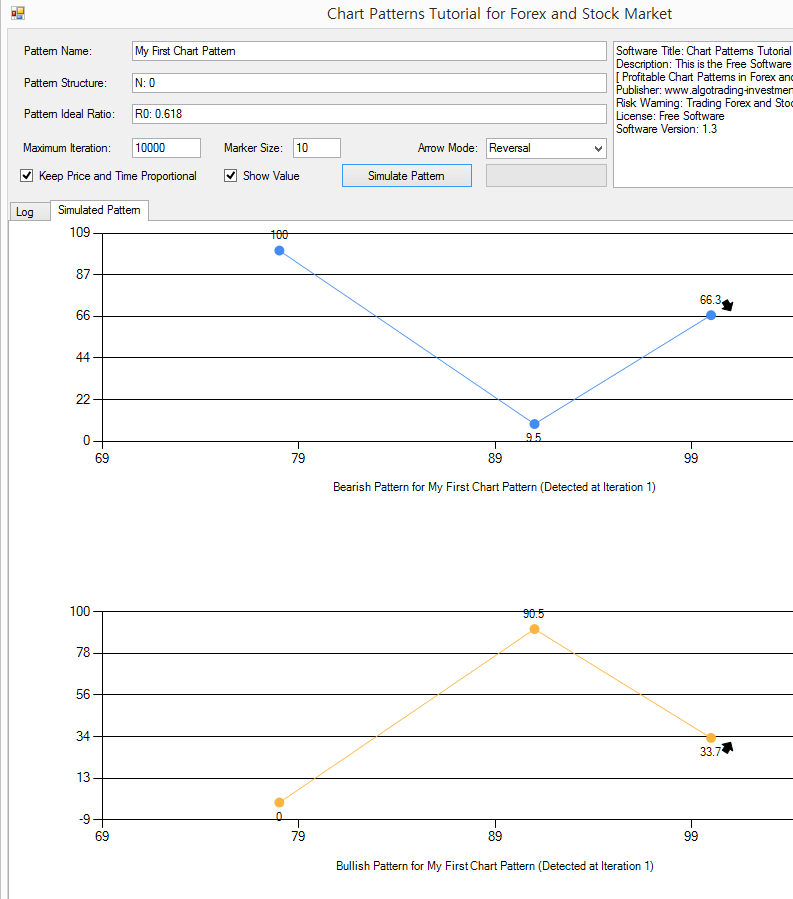
Figure 15-3: Simulating the chart pattern with Fibonacci Retracement Ratio 0.618
Let us do some more experiments. Now, we will keep the ideal ratio the same but we will change the number of Fractal triangles to 2. Change N1 to N2 in the Pattern Structure like below.
Pattern Name: My First Chart Pattern
Pattern Structure: N2
Pattern Ideal Ratio: R0: 0.618
Click on “Simulate Pattern” button again. Now you will see four points instead of three points. Number of points and number of Fractal triangles have the following relationship.
Number of points = Number of Fractal triangles + 2
Or
Number of Fractal triangles = Number of points – 2
Since we have set the number of Fractal triangles to 2, we have four points in our chart. First three points is corresponding to R0: 0.618. Last three points is not bound to any ratio. Hence, when you click on “Simulate Pattern” button repeatedly, you will see that last point in left keeps changing its position. This is the same in the real world trading. When we trade with the Golden ratio 0.618, the position of the trailing price data in left can be different for each pattern. If you are curious, then try the simulation with the number of Fractal triangles to 3 or 4.
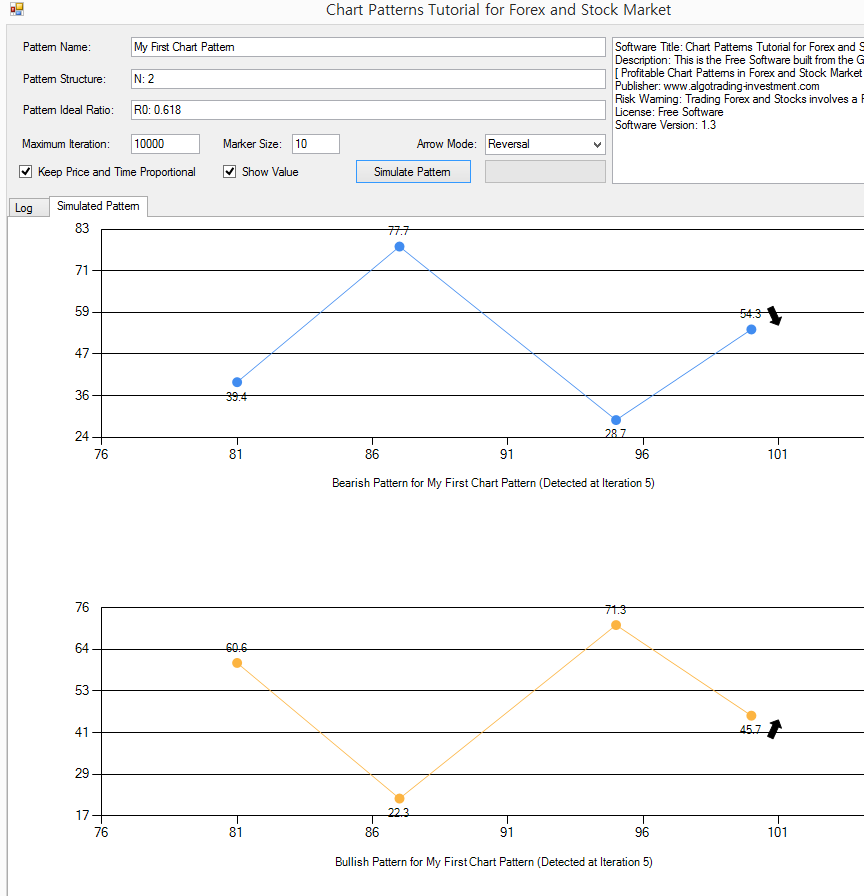
Figure 15-4: Simulating the chart pattern with Fibonacci Retracement Ratio 0.618 with two Fractal triangles
Let us go for the second chart pattern example. In the second chart pattern, we will be using Fibonacci Expansion ratio. This is another popular pattern, derived from Fibonacci Analysis. As we have covered the structure in the book, Expansion ratio is another popular chart pattern used by Fibonacci trader. To simulate the Fibonacci Expansion pattern with the ratio 0.618, enter the following details to the application.
Pattern Name: My Second Chart Pattern
Pattern Structure: N2
Pattern Ideal Ratio: E0: 0.618
For one expansion ratio, the pattern requires two Fractal triangles (i.e. four points). Hence, you need to specify N2. Even if you enter N1, the simulation might work. However, the correct number of Fractal triangles should be entered to avoid any bad simulation. Click on “Simulate Pattern” button. Often, the pattern structure of E0: 0.618 will look like AB=CD pattern. However, this is not always case. As long as the right swing / left swing meet the ratio, the pattern will be detected.
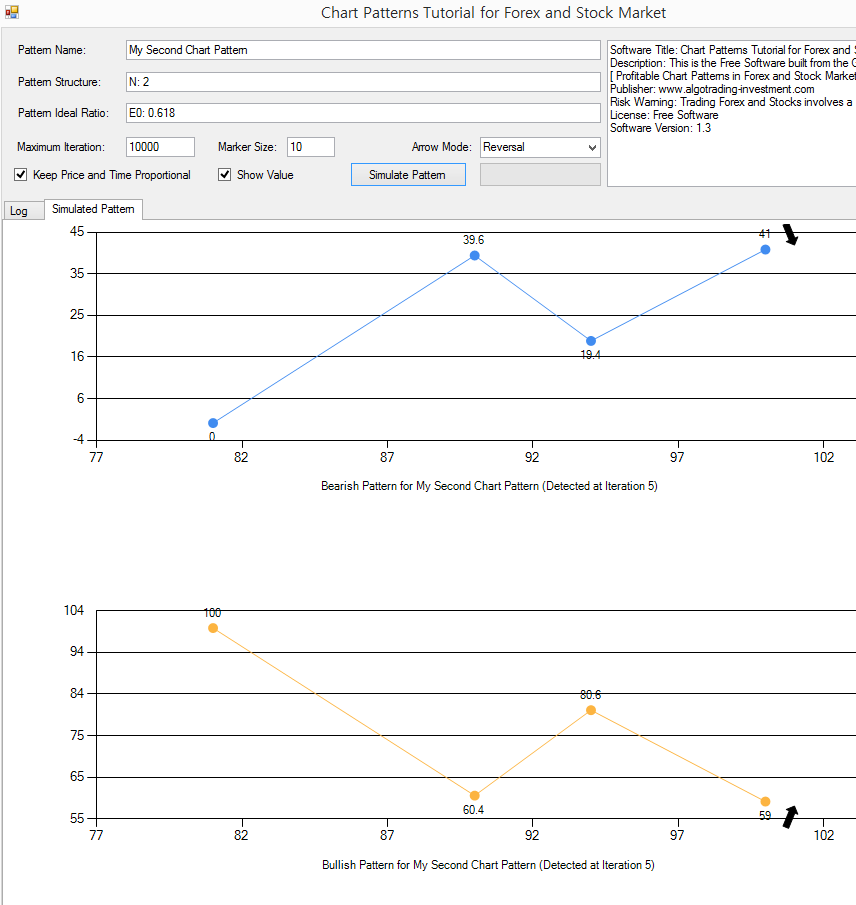
Figure 15-5: Simulating the chart pattern with Fibonacci Expansion Ratio 0.618
Let us go for the third chart pattern example. In the third chart pattern, we will be simulating the simple AB=CD pattern. AB=CD pattern is the popular chart patterns that are used by the trading community of Fibonacci Analysis and Harmonic Pattern. In terms of ratios, there are several variations of AB=CD pattern. We will be simulating the AB=CD pattern with Golden ratios.
Enter the pattern structure like below.
Pattern Name: AB=CD Simple
Pattern Structure: N2
Pattern Ideal Ratio: R0: 1.618, R1: 0.618
Now, pay attention to the number of iteration when the pattern is detected. In our case, the iteration jumps to 104. This is big jump comparing to the previous two patterns. In the previous two patterns, we often detected patterns at the iteration below 20. The reason behind the sudden jump in the iteration is that the complexity of pattern structure is increased.
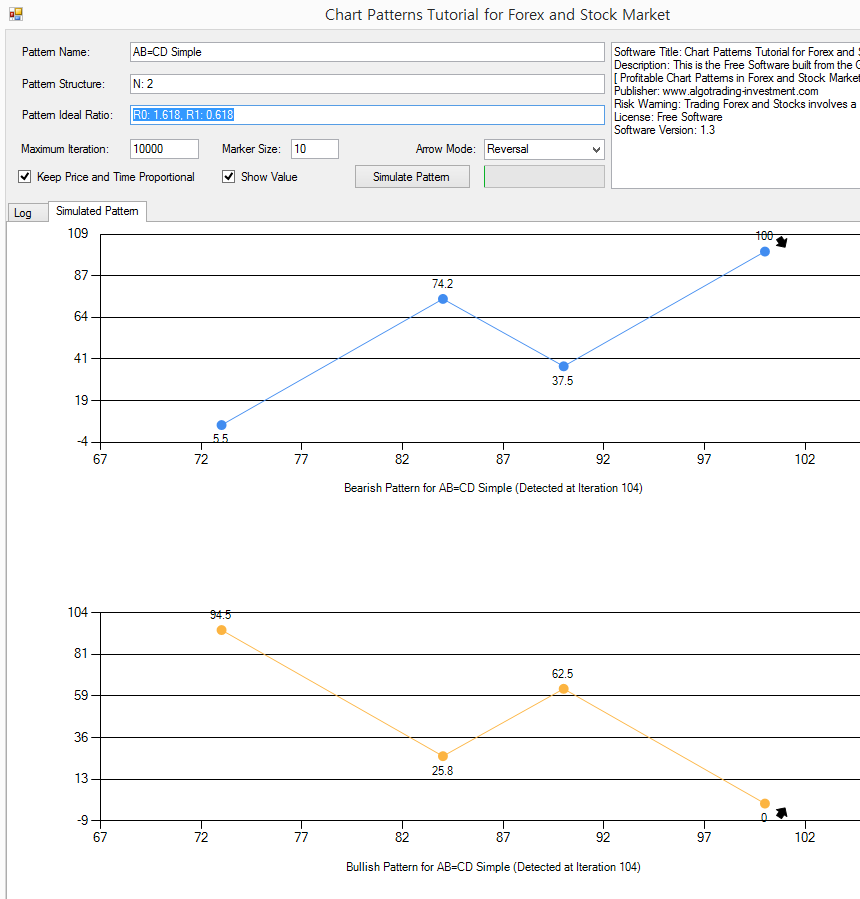
Figure 15-6: Simulating the chart pattern for the simple AB=CD structure
With the simple AB=CD pattern, let us see what is happening if we do not keep the price and time proportional. Untick on “Keep Price and Time Proportional” and click on “Simulate Pattern” button. Now, you will found that the simulated pattern looks quite different to the simulated pattern with Price and Time Proportional property. Question yourself. In the financial market, should the price and time be proportional? The answer is no in the real world financial market. Price can move a lot in short period of time. Sometimes, price can move little only in long period. We will not have nice proportional relationship between price and time in the financial market. Rather, the price and time are tied up under the probabilistic relationship. This is called “Volatility” in the financial trading. In our book: Predicting Forex and Stock market with Fractal Pattern, we have extended the volatility concept further using the turning point probability in the Fractal wave context. If you are interested this topic, then you can read the book.
What the simulation says here is that it is normal to see the price and time does not come in proportional relationship. Hence, you will often see the AB=CD pattern looking like this.
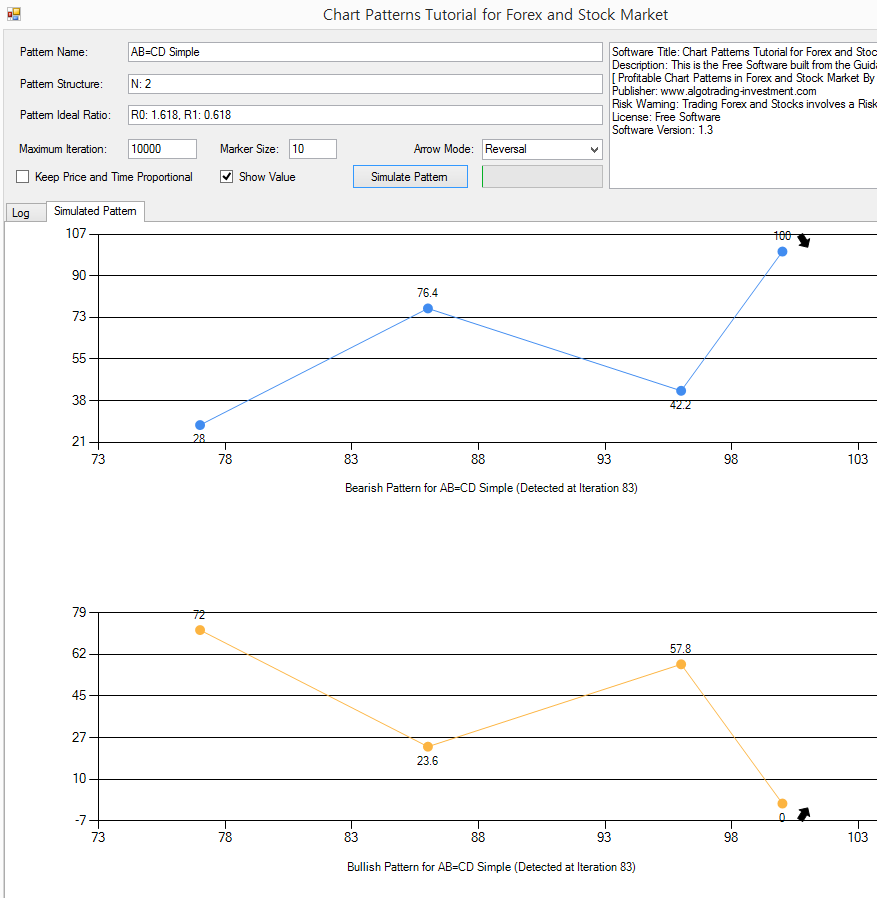
Figure 15-7: Simulating the chart pattern for the simple AB=CD structure while price and time is not proportional
In the fourth chart pattern example, we will be simulating more complex chart pattern. We can use Gartley pattern. The structure of Gartley pattern is more complex than the previous chart patterns. In fact, Gartley “222” pattern is nearly 90 years old. It is one of the oldest chart pattern still actively used by the trading community of Fibonacci Analysis and Harmonic Pattern. Often the Gartley pattern is the first Harmonic pattern that is learnt by Harmonic Pattern Trader because this pattern is classic. Since this is an old pattern, there are several variations of Gartley pattern. We will simulate one of the variation of the Gartley pattern. Enter the following details to the application to simulate the Gartley pattern.
Pattern Name: Optimal Gartley
Pattern Structure: N: 3, C0: 0.618 to T0: 3
Pattern Ideal Ratio: R0: 1.272, R1: 0.382 -0.886, R2: 0.618
Once again, you will find that we need more number of iterations to simulate Gartley pattern because this pattern is more complex than previous three patterns. The difference is that we are starting to use the closing retracement ratio. C0: 0.618 to T0: 3 indicates that first three Fractal triangles make up the bigger Fractal triangle with ratio of 0.618. You can detect the Gartley pattern without the closing retracement ratio too. For example, the following pattern structure can simulate the Gartley pattern too. This pattern is simpler. Since the closing retracement ratio is not used, the simulated pattern might look slightly different to the case of using the closing retracement ratio.
Pattern Name: Optimal Gartley
Pattern Structure: N: 3
Pattern Ideal Ratio: R0: 1.272, R1: 0.382 -0.886, R2: 0.618
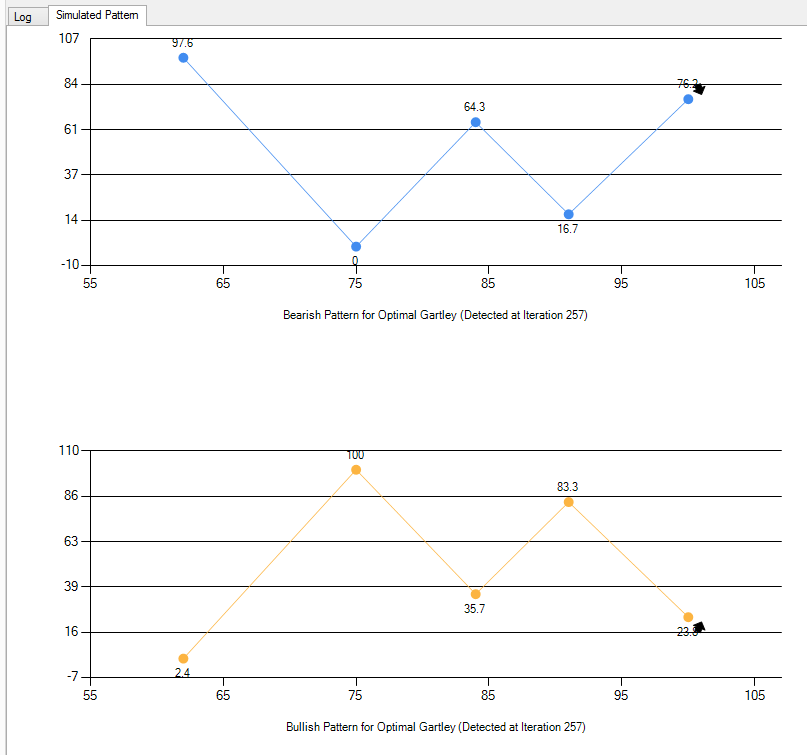
Figure 15-8: Simulating the Gartley pattern
You should always go beyond the patterns taught on the textbook. Often the variations and new patterns can perform better than old patterns. The idea behind using the computer simulation is that you can visualize and tune the patterns according to your needs for your trading. Hence, try to do many experiments with different ratio set. The idea of tuning is applicable to the Gartley pattern. In addition, they can be applicable to other Harmonic patterns like Butterfly pattern, BAT patterns, Shark patterns, and so on.
Let us go for even more complex chart pattern. In the fifth chart pattern, we will simulate the Elliott Wave pattern. Elliott wave is as old as Gartley pattern. The structure of Elliott wave is based on the Wave principle by Ralph Nelson Elliott. Elliott wave pattern is used by many renowned trader. You will found that the publication towards Elliott wave on the internet is overwhelming each year. Elliott wave can be used for both short and long-range prediction in the financial market. Once you can master it, it is helpful to decide good market entry and exit. The disadvantage is that it is complex to learn and to visualize. In that aspect, this application can be a great help. With this application, you can visualize any Elliott wave patterns to self-educate yourself. We will be simulating one pattern structure of Elliott wave. Enter the following pattern details to the application.
Pattern Name: Elliott Wave .12345ABC Pattern
Pattern Structure: N: 7, C0: 0.618 to T0: 7
Pattern Ideal Ratio: R0: 1.618, R1: 0.618, R2, R3: 1.618-2.618, R4: 0.382, R5: 1.618-3.000, R6: 0.618
You can tell that this Elliott wave pattern is highly complex. Click on “Simulate Pattern” button. In our example, the pattern was detected after 8103 iterations of the simulations. Sometimes, you will come across the message saying, “Pattern was not found after the maximum iteration of simulation. Please try to simulate again.” Literarily, when you specify the too complex pattern, there is a chance that the pattern might be not detected within the Maximum iteration. In that case, there is a chance that you will not often detect such a pattern in the real world trading too. The simulation can tell you this in advance.
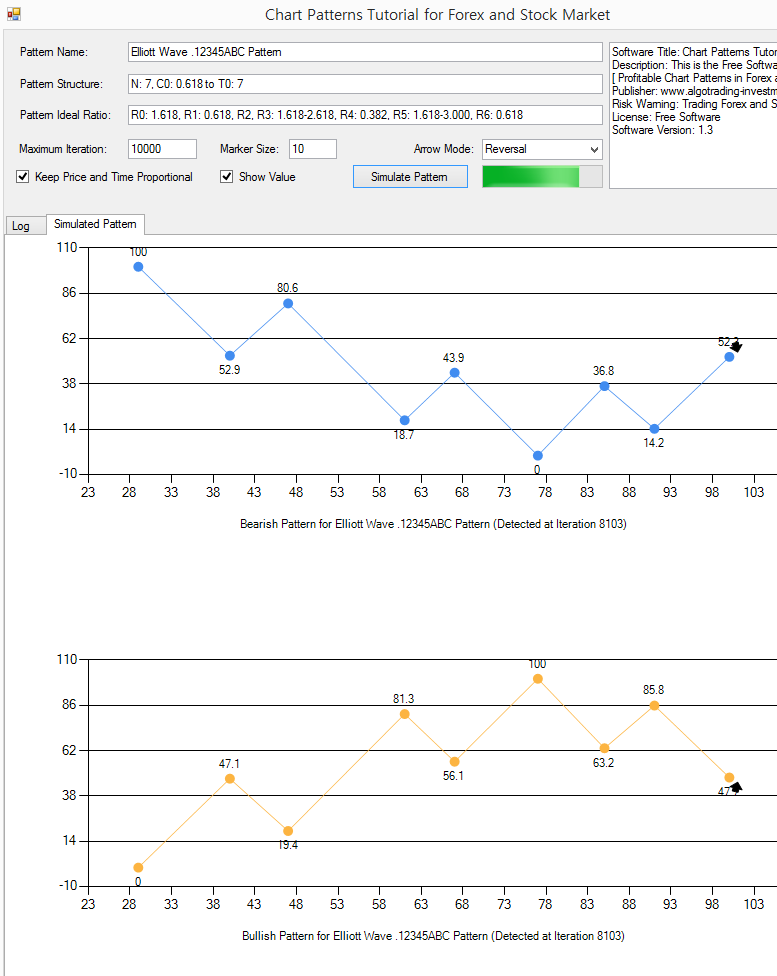
Figure 15-9: Simulating the Elliott Wave 12345ABC Pattern
So far, we have covered Fibonacci price pattern, Harmonic Pattern, and Elliott Wave pattern. In fact, there are other chart patterns that are used often beside above the chart patterns. For example, Triangle pattern, Falling Wedge Pattern, and Rising Wedge pattern, double top, double bottom, and so on. X3 Chart Pattern Framework can work with Triangle pattern, Falling Wedge Pattern, Rising Wedge pattern, double top, double bottom, and so on if you can set the ratio correctly. For example, the discovery of the Eagle pattern was inspired from double top and double bottom pattern.
C0: 1.000 to T0: 3,
R0: 1.272-1.618, R1: 0.382 – 0.886, R3: 0.618
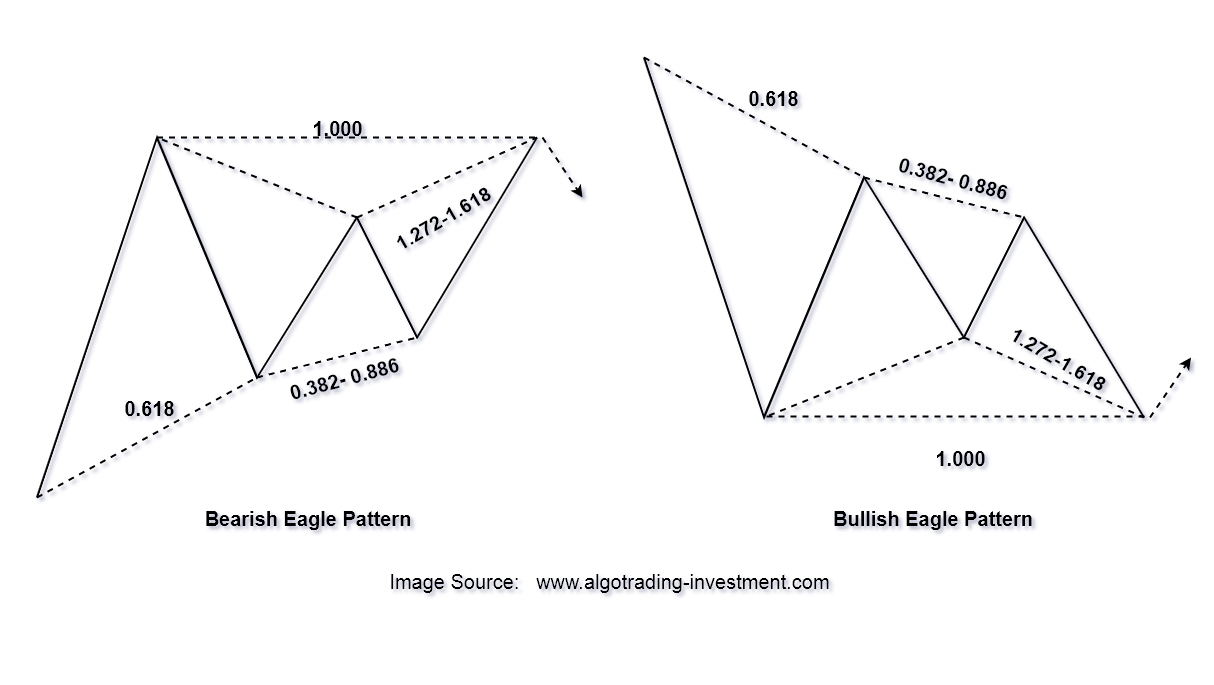
Figure 15-10: Structure of Eagle pattern (i.e. double top and double bottom)
Since we have covered the Eagle pattern structure in detail inside the book, we will be simulating the triangle pattern for the demonstration here. For example, enter the following pattern structure to simulate the simple triangle pattern.
Pattern Name: My Simple Triangle
Pattern Structure: N: 3
Pattern Ideal Ratio: R0: 0.8, R1: 0.382 -0.886, R2: 0.800
With the pattern structure with three Fractal triangles, you can simulate a simple triangle pattern. Since the triangle is often used as breakout trading, we have set the arrow mode to none. Then we have added the outline of the triangle by adding the triangle chart object from the right mouse click. You can even create the triangle pattern with four Fractal triangles too. Just try it as part of the exercise. However, the triangle pattern structures with four Fractal triangles are definitely more complex. In real world trading, you might see them less. With this application, you can transfer any of your trading ideas into the chart patterns. Once, you find the working patterns, the profitable chart patterns are your valuable asset. They can be always incorporated in your trading portfolio through your trading operation.
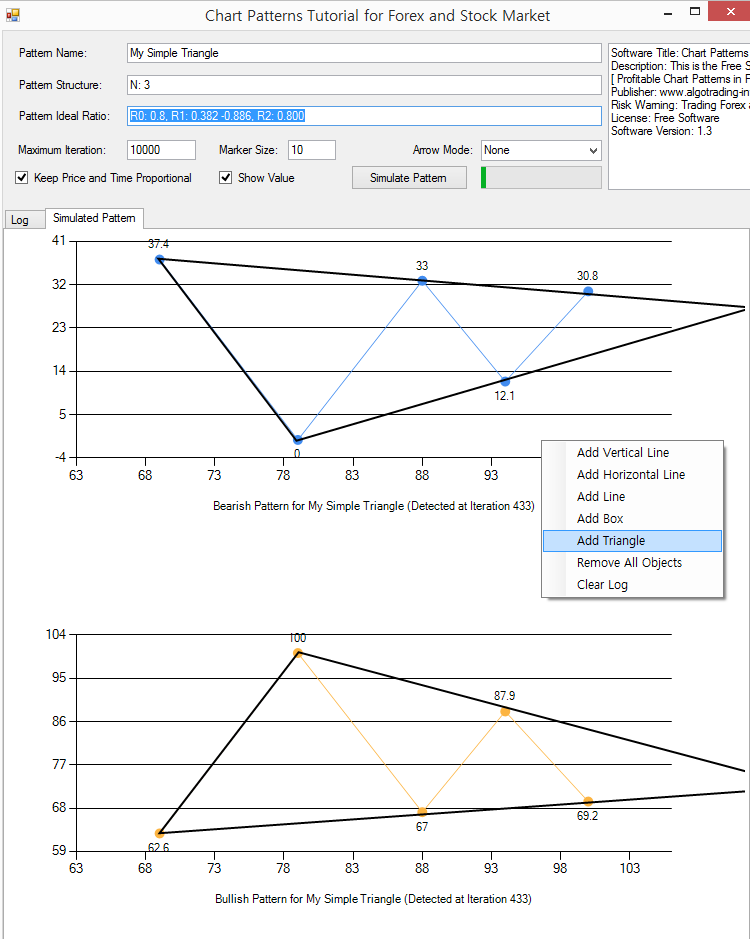

Figure 15-11: Simulating the triangle pattern structure
In summary, this “Chart Patterns Tutorial” application is a great free tool to help your understanding with many powerful chart patterns used by the trading community. In this tutorial, we have covered Fibonacci Price pattern, Harmonic Pattern, Elliott Wave and X3 Chart Pattern. You can use the chart pattern simulation in this application for the following purposes.
- Visualize the chart patterns for the self-education
- Check or modify the ratios for the existing chart patterns to make it even more profitable
- Create new chart patterns that works for your trading
There are some limitations for this “Chart Patterns Tutorial” application too. For example, you can only specify one closing retracement ratio or one factored expansion ratio. In the Pattern Structure box, we recommend you to keep only one condition using either one closing retracement ratio or one factored expansion ratio or none. It is because the complexity of the simulation machine increases too fast with multiple closing retracement ratio or multiple factored expansion ratio. In addition, you can enter up to seven ratios in the Pattern Ideal Ratio box.
It might be the minor point. In the application, you can switch on and off some of the labels in the simulated chart patterns. You can do this by tick or untick the check boxes. Here is the brief description about the check boxes.
- Show Value: switch on and off price value in the pattern
- Show Price Index (P): show or hide the labels of P0, P1, P2, etc
- Show Ratio Index (R): show or hide the labels of R0, R1, R2, etc
- Connect prices: show or hide the connecting lines between prices.
Here is another additional tip. Sometimes the pattern might look stretched in width, for example in time dimension. If you want to prevent this, you can resize the user form by dragging the right end of the user form to left. I often use this trick to have the pattern look more symmetry in price and time. However, this is still minor point though. It does not affect the structure of the simulated pattern in term of their price and time coordinates.
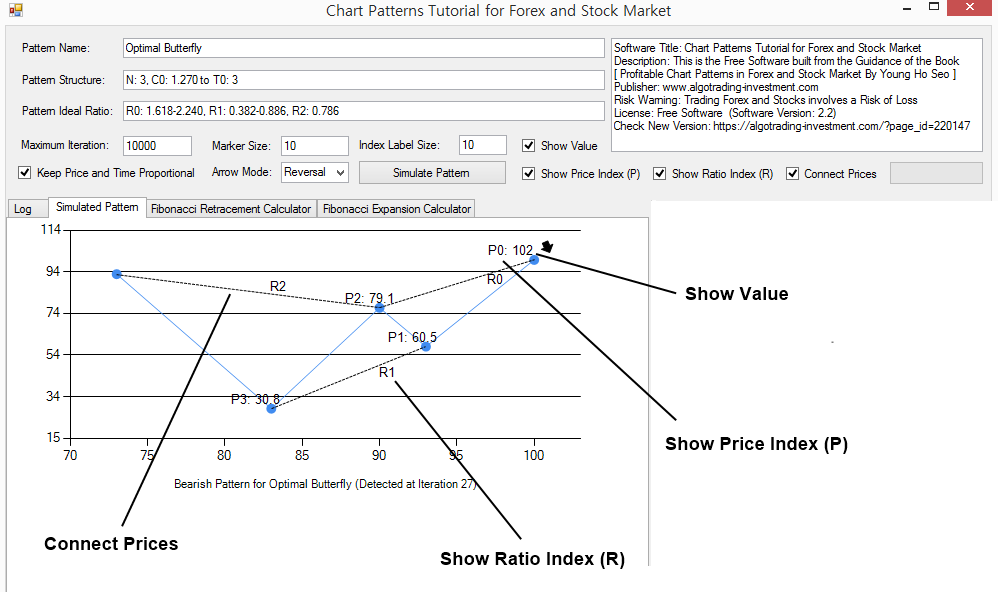
Figure 15-12: Labels in the simulated chart patterns
Now we will start to talk about the Fibonacci Retracement calculator and Fibonacci Expansion calculator built in this application. These calculators are useful in both uptrend and downtrend market. You can use these calculators to find out the potential turning point in Forex and Stock market. You can access the calculator by clicking the tab.
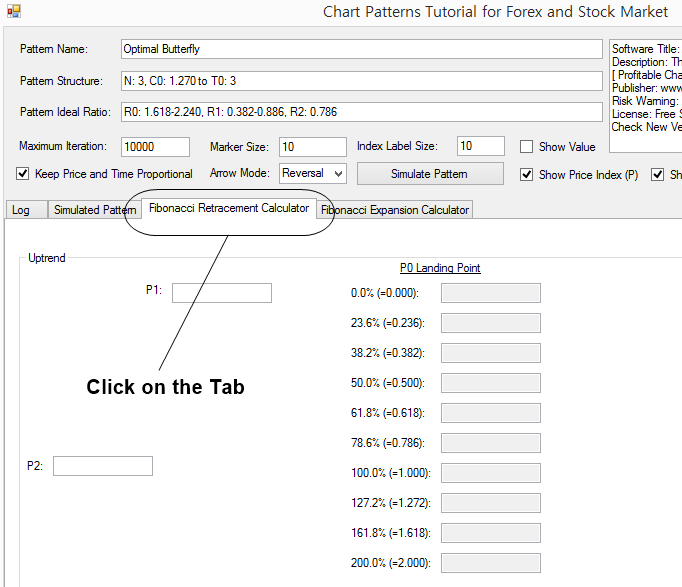
Figure 15-13: Click the tab to access Fibonacci Retracement calculator and Fibonacci Expansion calculator
In the Fibonacci Retracement calculator, user needs to input Price 1 (P1) and Price 2 (P2) to get the Price projection at Price 0. The calculations are done separately for uptrend and downtrend cases. Depending on the current market trend, you can choose the right calculator. The zigzag diagram on right side indicates how uptrend and downtrend looks in your chart. We have also placed the P0, P1, and P2 input boxes as intuitive as we can to make your input and calculation clearer. Use the zigzag diagram on the right side to find out the right box to enter P1 and P2 value.
For an example, to calculate Fibonacci retracement levels in downtrend. We need to take two price readings from the chart. Say that they are 1.17598 and 1.17938 respectively for P1 and P2 in EURUSD H1 timeframe chart. Enter the two numbers in the input boxes. Then click on Calculate Fibonacci Retracement button. The calculator will project the various Fibonacci retracement levels to help you to spot the possible turning point. Since we are dealing with many numbers, it is good to have some consistent decimal places. You can control the number of decimal places by specifying the decimal places number in the input box. In default, it is set to 4. Change this to any number you wish. For Forex market, you might need to set this to 3 or 5. For Stock market, you might need to set this to 1 or 2.
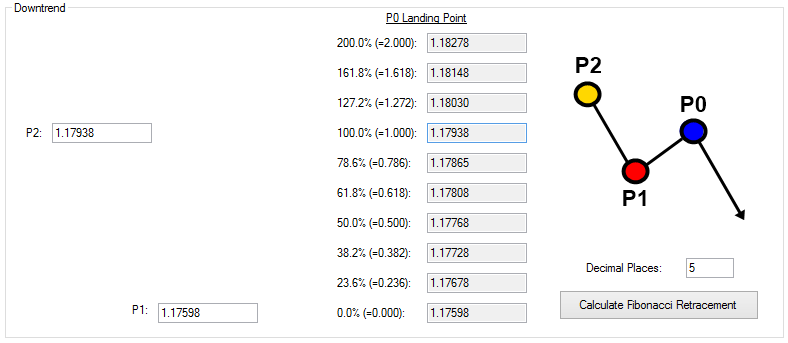
Figure 15-14: Example Fibonacci Retracement calculation with price values taken from EURUSD H1 timeframe
Fibonacci Expansion calculator works the same as Fibonacci Retracement calculator. This application provides the separate entry to calculate them for uptrend and downtrend cases. The only difference here is that you need to input three price values instead of two price values. Hence, before calculating Fibonacci Expansion, you need to get the reading of three price values from your chart for P1, P2, and P3. Use the zigzag diagram on the right side to find out the right box to enter P1, P2 and P3 value. In this example, say that price values are 1.17032, 1.17938, and 1.17599 respective for the place of P3, P2, and P1 from EURUSD H1 chart. Once three price values are entered, click on Calculate Fibonacci Expansion button. The calculator will project the Fibonacci Expansion levels to predict the potential turning point. As before, you can specify the decimal places number according to your preference. Although we have shown the examples with EURUSD data, you can apply the Stock market data in the same way as the Forex market data.
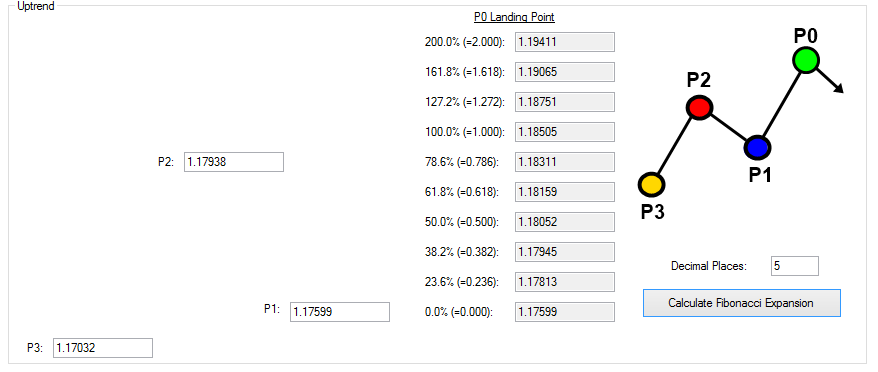
Figure 15-15: Example Fibonacci Expansion calculation with price values taken from EURUSD H1 timeframe chart
One might be curious how these Fibonacci ratios are derived in the calculator. In fact, all these Fibonacci ratios are derived from the Golden ratio 1.618. In the book, we provide the Fibonacci ratio table for both prime and secondary Fibonacci ratios with detailed explanation.
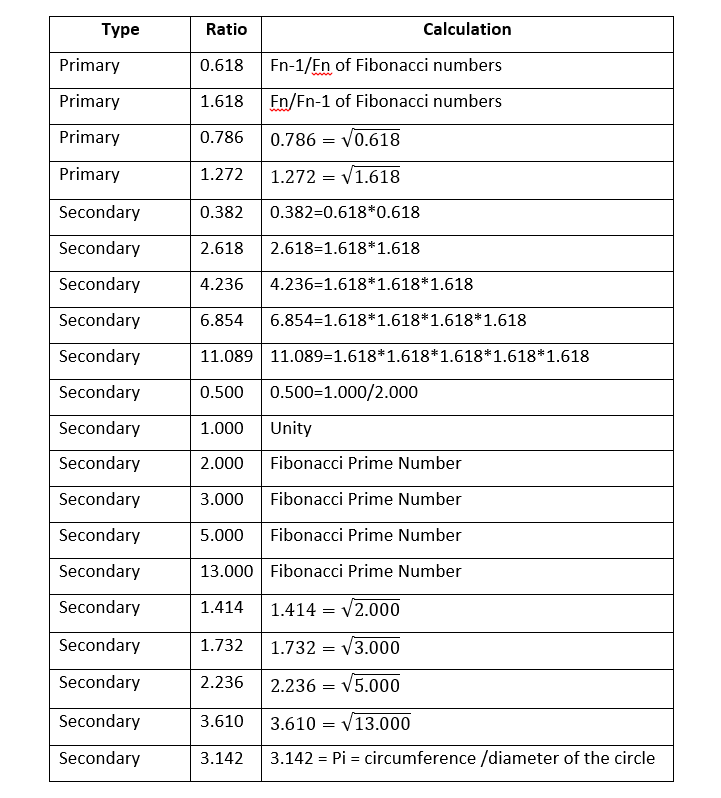
Figure 15-16: List of Fibonacci ratios
Finally, you can access the pivot point calculator with this Chart Pattern Tutorial application too. Pivot point analysis is simple but useful technical analysis for your trading. The pivot point is calculated with the simple average of high, low, and close price of the previous trading day. You can consider the pivot point as the median price level for your trading. From this median price level, we can generate several support and resistance levels. These support and resistance levels are typically denoted as S1, S2, S3, S4 and R1, R2, R3, R4 respectively in the pivot point analysis. Supports are located below the pivot point. S1 is the nearest support level to the pivot point and S4 is the lowest support level. Resistance are located above the pivot point. R1 is the nearest resistance level to the pivot point and R4 is the highest resistance level. The calculation of these support and resistance are based on the arithmetic equation consisting of addition, subtraction, multiplication, and division. You need to understand the difference between the pivot point analysis and other geometric patterns covered in the simulation exercise. For example, Fibonacci retracement, Fibonacci expansion, Harmonic pattern, Elliott Wave, and X3 Chart patterns are all geometric patterns. The shape of these geometric patterns is directly taken from the price path in the chart. However, pivot point analysis is not a geometric pattern and it is rather numerically calculated support and resistance. Technically speaking, the support and resistance in the pivot point analysis is not the derived pattern from Fractal wave.
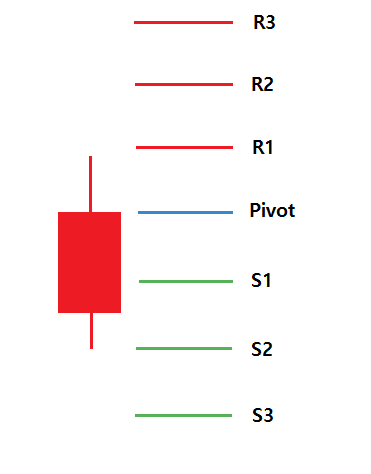
Figure 15-17: Location of pivot point, support, and resistance in the daily candlestick
Here are some important points about using the pivot point analysis for your trading.
- If the price is trading above the pivot point, it indicates the day is bullish
- If the price is trading below the pivot point, it indicates the day is bearish
- Resistance (R1, R2, R3, and R4) may cause reversals. However, they may also be used to confirm the uptrend. For example, if the price moves above R1, it can help to confirm the uptrend. It could be a possible signal for the continuation to R2.
- Support (S1, S2, S3, and S3) may cause reversals. However, they may also be used to confirm the downtrend. For example, if price moves below S1, it can help to confirm the downtrend. It could be a possible signal for the continuation to S2.
To access the pivot point calculator in the application, you need to click the tab. After that, you will need two steps. In the first step, enter open, high, low, and close price of previous trading day. In the second step, click on “Calculate Pivot Point” button. The calculator can generate four different pivot point analysis. They include the Classic pivot point, Woodie’s pivot point, Camarilla pivot point, and Fibonacci pivot point. These four methods are popular between the Forex and Stock trading community.
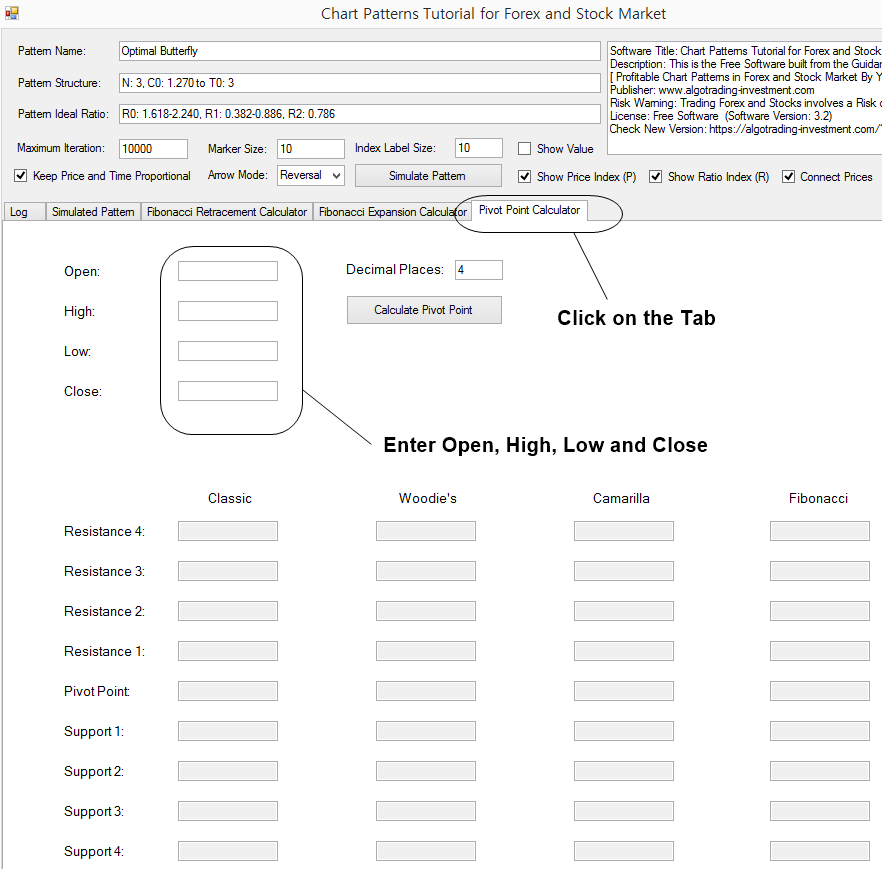
Figure 15-18: Access pivot point calculator from the Chart Pattern Tutorial application
For example, if you want to calculate the pivot point, support and resistance for Microsoft Stock price, then enter the open, high, low, and close price of previous trading day. Say that it was 222.26, 224.36, 218.03, and 223.72 respectively. Set the decimal places to 2. Then click on “Calculate Pivot Point” button. The calculator will generate the pivot point, support, and resistance for the four methods. For your information, the number of support and resistance are different for each method as they are calculated using the different equation. For example, in classic pivot point analysis, the calculator will generate S1, S2, S3, R1, R2, and R3. In Woodie’s pivot point analysis, the calculator will generate only S1, S2, R1, and R2.
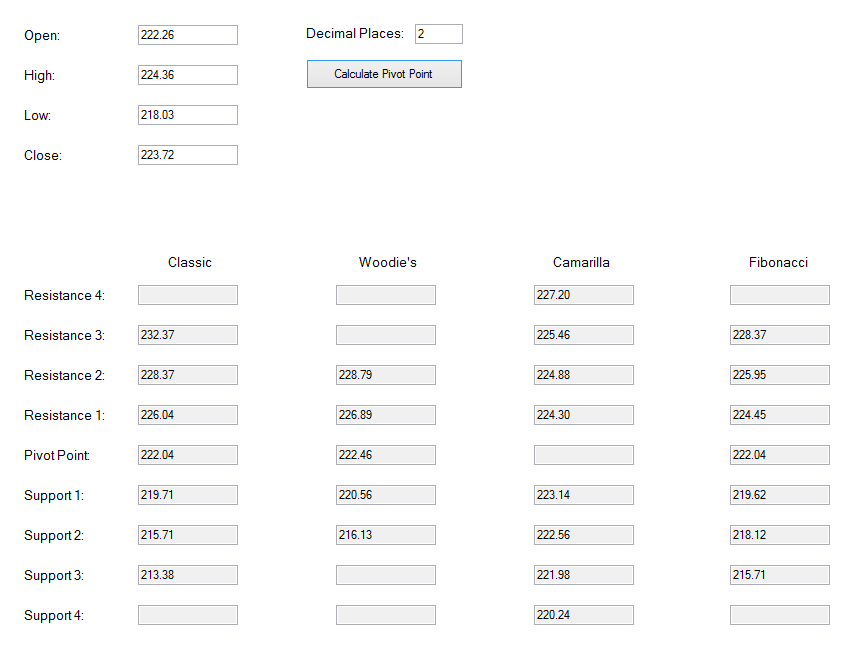
Figure 15-19: Example pivot point calculation with Microsoft Stock price
About this Article
This article is the part taken from the draft version of the Book: Profitable Chart Patterns in Forex and Stock Market (Fibonacci Analysis, Harmonic Pattern, Elliott Wave, and X3 Chart Pattern). This article on this website is only draft and it will be not updated to the completed version on the release of the book. However, this article will serve you to gather the important knowledge in financial trading. This article is also recommended to read before using Harmonic Pattern Plus, Harmonic Pattern Scenario Planner and Profitable Pattern Scanner, which is available for MetaTrader or Optimum Chart.
Below is the landing page for Harmonic Pattern Plus, Harmonic Pattern Scenario Planner and X3 Chart Pattern Scanner in MetaTrader. All these products are also available from www.mql5.com too.
https://algotrading-investment.com/portfolio-item/harmonic-pattern-plus/
https://algotrading-investment.com/portfolio-item/harmonic-pattern-scenario-planner/
https://algotrading-investment.com/portfolio-item/profitable-pattern-scanner/
Below is the landing page for Optimum Chart (Standalone Charting and Analytical Platform).
https://algotrading-investment.com/2019/07/23/optimum-chart/
Related Products


