Tutorial Using Excessive Momentum and Fibonacci Ratio Analysis
With Excessive Momentum Indicator, you can access to the automatic Fibonacci Ratio Analysis. Combining these two powerful trading system are the excellent ways to trade in Forex market. In this article, we will show you how to combine both with step by step guide.
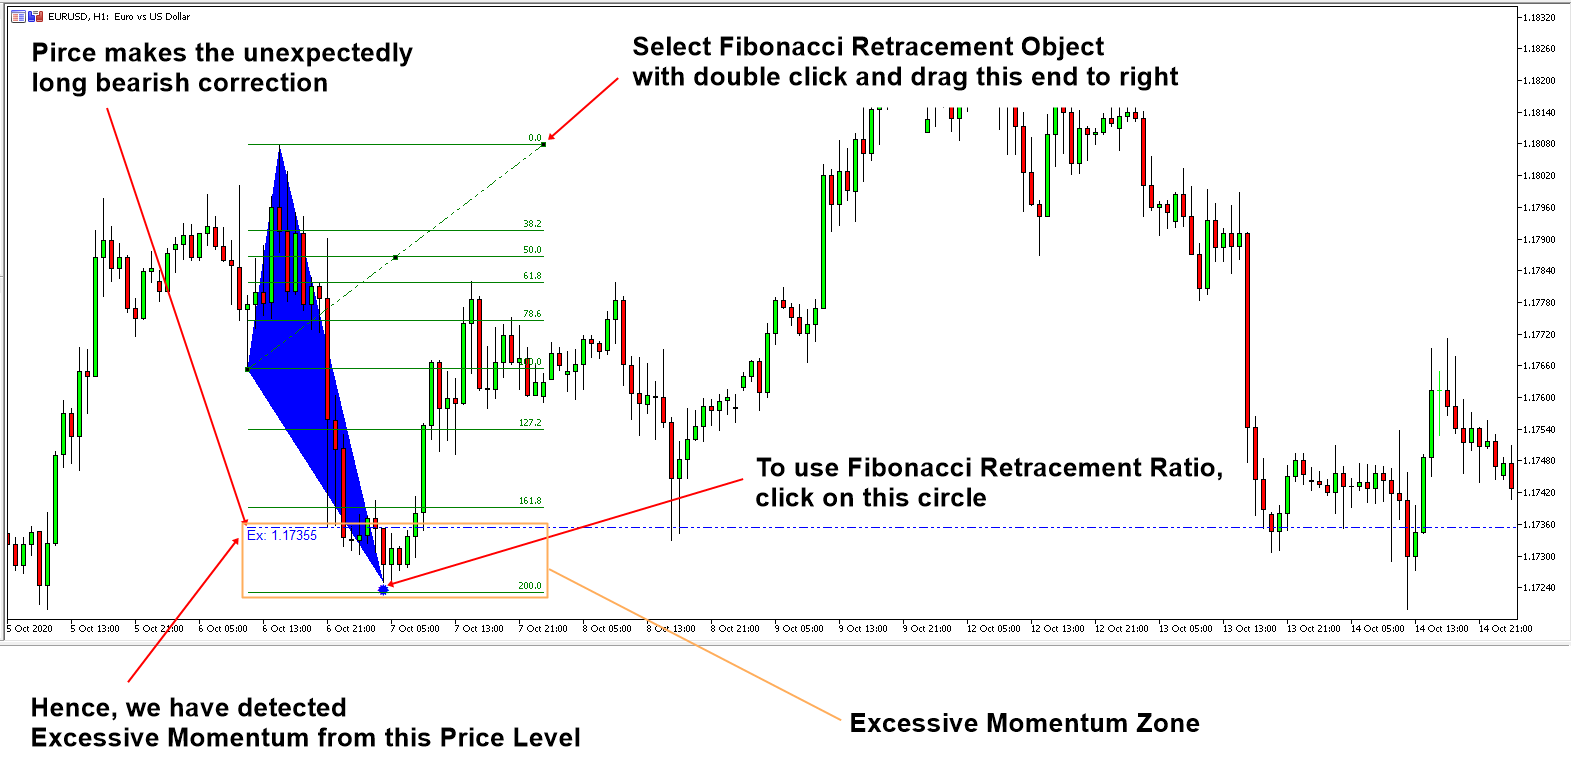
When there is an unexpectedly long bearish and bullish price movement, the indicator will detect these excessive momentum area for your trading. This excessive momentum zone are often the true accumulation and distribution area in the Volume Spread Analysis. What does this mean for your trading ?This means that entry around this excessive momentum area can provide you the great advantage that favors your Reward and Risk for your trading whether they are breakout trading or reversal trading. The indicator provides such a great opportunity automatically.
In addition, Fibonacci retracement level can provide further idea about when the price can move according to our expectation. To call the Fibonacci retracement level automatically, simply click on the circle at the Excessive Momentum Zone. Then it will place the Fibonacci retracement level automatically in your chart. The thing is that the placed Fibonacci Retracement level might be too short in its width. Sometime, you want to project the Fibonacci Retracement level far right to see the price action around the retracement level. It is doable too.
To do so, double click on the Fibonacci retracement object in your chart. Then you will see the three anchor points in the retracement object. Drag the right anchor point to the right. You can drag them as far as you want to cover the chart area at your interest. Please check the screenshot attached to complete this tutorial.
This Excessive Momentum Zone can be considered as either Accumulation or Distribution area in the Volume Spread Analysis. You can further find the symptoms of accumulation and distribution area using our Volume Spread Pattern Indicator (Paid and Advanced version) or Volume Spread Pattern Detector (Free and Light version). You can watch the YouTube videos to find more about the Excessive Momentum Indicator.
YouTube Video Momentum Indicator: https://youtu.be/oztARcXsAVA
===========================================================================
Here is link to Excessive Momentum Indicator.
https://algotrading-investment.com/portfolio-item/excessive-momentum-indicator/
https://www.mql5.com/en/market/product/30641
https://www.mql5.com/en/market/product/30621
With Excessive Momentum indicator, you can use our Free Volume Spread Pattern Detector. Volume Spread Pattern Detector is a great free tool to complete your Volume Spread Analysis to detect Accumulation and Distribution. Or even you can use them to detect important support and resistance for your trading too. Here is the link to the free Volume Spread Pattern Detector.
https://www.mql5.com/en/market/product/28438
https://www.mql5.com/en/market/product/28439
https://algotrading-investment.com/portfolio-item/volume-spread-pattern-detector/
In addition, Volume Spread Pattern Indicator is the more advanced version of Volume Spread Pattern Detector. If you want to improve your trading performance even more, then we recommend using Volume Spread Pattern Indicator. This is not free indicator but it is affordable. Here is the link to the Advanced Volume Spread Analysis indicator.
https://www.mql5.com/en/market/product/32961
https://www.mql5.com/en/market/product/32960
https://algotrading-investment.com/portfolio-item/volume-spread-pattern-indicator/
Related Products


