Trading Chart Patterns
Chart patterns are a crucial part of technical analysis in Forex trading as well as Stock trading. Chart patterns are formed by price fluctuations and represent chart figures with their own meanings. There are two main types of Chart patterns depending on how to use them. Two types include Continuation chart patterns and Reversal chart patterns. Continuation patterns are expected to continue the current price trend, causing a fresh new impulse in the same direction. Reversal chart patterns refer to patterns where the price direction reverses, causing a fresh new impulse in the other direction. To trade chart patterns, you can place an order above or below the formation, however, how to place an order can vary from chart pattern to chart pattern. In this article, we will explain some common chart patterns mostly used by the Forex and Stock trader. As explained before, with these chart patterns in this article, you can perform either continuation or reversal trading. Chart patterns used in Forex and Stock market are based on historical price action, and their outcomes can vary depending on market conditions. Before we go to about trading chart patterns in detail, let us cover some basics of chart patterns used by the technical analyst like support and resistance, channel pattern, triangle pattern, head and shoulder, double top and double bottom, etc.
1. Support and Resistance
Support represents a level on a price chart where buyers’ willingness to buy overcomes selling pressure. It’s the point where a downtrend is expected to pause due to an accumulation of demand. Resistance is the opposite of support. It occurs where an uptrend is expected to pause temporarily due to an excess of supply over demand.
2. Ascending and Descending Channels
These are fundamental chart patterns that highlight trends. In an ascending channel, the market moves upward, hitting higher highs and higher lows. It represents a bullish trend, and traders often consider going long. Dips in the trend can be buying opportunities. Conversely, a descending channel occurs when the market forms lower lows and lower highs. This indicates a downtrend, and traders may look for short-selling opportunities during mini rallies against the bearish run.
3. Ascending and Descending Triangle
An ascending triangle forms when a horizontal line of highs intersects an upward-sloping line of lows. The upper line acts as resistance, and the lower line is support. This pattern is a continuation pattern, typically appearing after an uptrend. It suggests that the bullish momentum may persist. A descending triangle occurs when there is a horizontal support line (formed by swing lows) and a downward-sloping resistance line (formed by swing highs). The two lines create a triangle.
4. Head and Shoulders
The head and shoulders pattern is a reversal pattern. It occurs after an uptrend and signals a potential trend reversal. It consists of three peaks: a central peak (the head) flanked by two smaller peaks (the shoulders). When the neckline (a support line) is broken, it indicates a shift from bullish to bearish sentiment.
5. Double Top and Double Bottom
These are also reversal patterns. A double top forms after an uptrend and indicates a potential reversal. It consists of two peaks at approximately the same price level. A double bottom occurs after a downtrend and suggests a shift to bullish sentiment. It consists of two troughs at similar price levels.
6. Cup and Handle
The cup and handle pattern is a bullish continuation pattern. Cup and Handle pattern resembles a cup (formed by a rounded bottom) followed by a smaller handle (a consolidation phase). When the price breaks out from the handle, it often continues the upward trend.
Chart Patterns in Forex and Stock Market
Technical analysis is a discipline to evaluate and identify trading opportunity and risk by analysing the market data, such as price and volume. Is the technical analysis necessary for the financial trading or investment? To get the answer, do you buy a cloth, car, and house without looking at the price tag? If you check the price tag, it often helps you to avoid picking the overpriced item. Some savvy shopper will use the unit price and historical price on top of the price tag to make a better buying decision. Analysing price is the important activity to understand the value of something. Likewise, in Forex and Stock market, the technical analysis uses the price analysis to make better buying and selling decision. In fact, we recommend using at least some technical analysis to avoid any subjective decision making.
Peak trough analysis is the starting point of any technical analysis to predict Forex and Stock market. In addition, understanding the peak trough analysis provides the shortcut to learn all the important technical analysis because many of them are directly built on the peak trough analysis. For your information, we provide a list of technical analysis that make use of peak trough analysis. In the list, some of them were around 100 years whereas others are only around few decades. This is not the exhausted list. However, there are many other technical analysis not on this short list too. You can have a look at the list. You will find that some of them are familiar if you are already in the trading business. Here we will explain some of these technical analysis in brief to provide you some basis before we go on to the supply and demand analysis.
• Support and Resistance (Horizontally drawn lines)
• Support and Resistance (Diagonally drawn lines, also known as trend line)
• Fibonacci Ratio analysis
• Harmonic Pattern
• Elliott Wave Theory
• X3 Chart Pattern Framework
• Symmetrical Triangle
• Ascending Triangle Pattern
• Descending Triangle Pattern
• Falling Wedge Pattern
• Rising Wedge Pattern
• Channel
• Renko Chart
• Supply and Demand Zone
• Point & Figure Chart
• Double Top
• Double Bottom
• Triple Top
• Triple Bottom
• Head and Shoulder pattern
• Reverse Head and Shoulder pattern
• Many Swing Trading Strategies
• ABC or 123 pattern
• Turning Point Probability and Trend Probability
• And many more
Process of the technical analysis in the list can be explained either by point connecting exercise or by ratio measurement exercise. For example, you can draw a support line in your chart by connecting more than two points in a straight line. The points refer to the peak or trough in your chart. To draw more conservative support line, you can connect more than three points in a straight line.
Drawing a support line is simple. However, it often provides a good clue about the future price movement. Typically, around support, we can expect high energy. Due to this high energy, the support line is a good place to set up the reversal trading or breakout trading. When the support line is used alone, you can use the reactive trading strategy. For example, when the price arrives near the support line, the traders tend to trade in the direction which the asset is getting pushed by the crowd. If the price is getting pushed upward from the support line, then we will buy. If the price is getting pushed downward from the support line, then we will sell. However, the reactive trading strategy is not the only trading strategy you can use with the support. For example, you can use the support line by combining it with other technical analysis, which predict the market direction.
You can draw a resistance line in your chart by connecting more than two points in a straight line. The points refer to the peak or trough in your chart. To draw more conservative resistance line, you can connect more than three points in a straight line.
Drawing a resistance line is simple. However, it often provides a good clue about the future price movement. Typically, around resistance, we can expect high energy. Due to this high energy, the resistance line is a good place to set up the reversal trading or breakout trading. When the resistance line is used alone, you can use the reactive trading strategy. For example, when the price arrives near the resistance line, the traders tend to trade in the direction which the asset is getting pushed by the crowd. If the price is getting pushed upward from the resistance line, then we will buy. If the price is getting pushed downward from the resistance line, then we will sell. However, the reactive trading strategy is not the only trading strategy you can use with the resistance. For example, you can use the resistance line by combining it with other technical analysis, which predict the market direction.
So far, we have shown the example of support and resistance lines drawn horizontally. However, you can also draw the support and resistance lines diagonally too. The diagonally drawn support and resistance lines are sometimes called as the trend line too. Drawing the diagonal support and resistance lines are exactly the same as drawing the horizontal support and resistance. We just need to connect more than two or three points in our chart.
In general, the beginners found that using the horizontal support and resistance is easier than using the diagonal support and resistance. However, trading with diagonal support and resistance are not different from horizontal support and resistance. These diagonal support and resistance lines can provide a good place to set up the reversal trading or breakout trading. You can use this diagonal support and resistance as the reactive trading strategy as it was explained in the horizontal support and resistance. However, it is a good trading strategy to combine the diagonal support and resistance with other technical analysis, which predict the market direction.
Support and resistance is a useful tool for our trading. However, there are some weakness too. One possible problem of using the support and resistance is that the trader can experience the false breakout movement around the price level. For example, in false breakout around the support line, it looks like the price will breakout by crossing the level but then it quickly reverses.
To avoid this sort of false breakout, it is important to look at the price height of the latest fractal triangle. Based on the height of the fractal triangle, you can set some price margin to trigger the breakout entry. For example, you can use the 10% or 20% height of the fractal triangle to set the breakout entry price. In addition, to avoid the false breakout, we can combine the support and resistance with other technical analysis. There could be several ways to do this. However, one possible and straight forward way is to combine the support and resistance level with the turning point probability. We will show you how to reduce the losing trades with the false breakout using the help of the turning point probability at the end of this chapter.
As we have mentioned before, support and resistance provide the basis for more advanced technical analysis. For example, if we combine one support and one resistance line, then it is possible to detect triangle pattern. Especially, the triangle pattern represents the gradually decreasing volatility. The triangle pattern often provides the good breakout trading opportunity. The tip of the triangle pattern might be seen within the chart or not. However, before setting up the breakout trading, make sure that the triangle pattern provides sufficiently narrow ranging movement. Otherwise, they are more suitable for reversal trading than breakout trading.
In addition, the idea of constructing rising wedge pattern and falling wedge pattern is similar to construct the triangle pattern. We just need to combine one support and one resistance. We provide the schematic diagram for all these price patterns that can be detected by combining one support and one resistance.
In addition, we can use peak trough analysis for the ratio measurement exercise too. The simplest ratio based technical analysis is the Fibonacci analysis. With Fibonacci analysis, we can detect Fibonacci retracement or Fibonacci expansion. In Fibonacci retracement, we concerns three points that are peak or through in your chart. Hence, we need to deal with one fractal triangle to detect the Fibonacci retracement. Fibonacci retracement is identified when the right swing retrace back 38.2%, 50% or 61.8% to left swing. Fibonacci retracement is often used to predict the depth of correction in the trendy market. It is simple but powerful tool for reversal trading setup.
In Fibonacci expansion, we concerns four points that are peak or through in your chart. Hence, we need to deal with two fractal triangles to detect the Fibonacci expansion. Fibonacci expansion is identified when the right swing expands to 61.8%, 100%, 161.8% or 261.8% to left swing. Fibonacci expansion is often used to identify the end of trend phase in the market. It is simple but powerful tool for reversal trading setup.
Just like support and resistance provide the foundation for the price patterns like triangle, rising wedge, falling wedge and so on, Fibonacci analysis also provides the foundation for other advanced technical analysis too. For example, Harmonic pattern, Elliott Wave pattern, and X3 Chart pattern can be considered as the advanced Fibonacci analysis. To help your understanding, consider the Gartley Harmonic pattern. To detect Gartley Harmonic pattern, we need five points that are either peak or trough in your chart. These five points are typically denoted as XABCD points.
Firstly, we check if the ratios for the fractal triangle XAB, ABC, and BCD are respectively near 61.8%, 88.6%, 113%. Then we check if the ratio of the fractal triangle XAD is near 78.6%. The ratio can not be dead accurate most of time. We identify the pattern if the ratio is within the acceptable range. This task to detect Harmonic pattern is more complicated involving to check ratios for several fractal triangles. However, it is still the extension of the Fibonacci analysis. Likewise, identifying Elliott Wave pattern or X3 Chart pattern is more or less similar.
For your information, we have summarized how to perform some important technical analysis. Most of technical analysis requires either the point connecting exercise or ratio measuring exercise. For some technical analysis, you need both point connecting exercise and ratio measuring exercise.
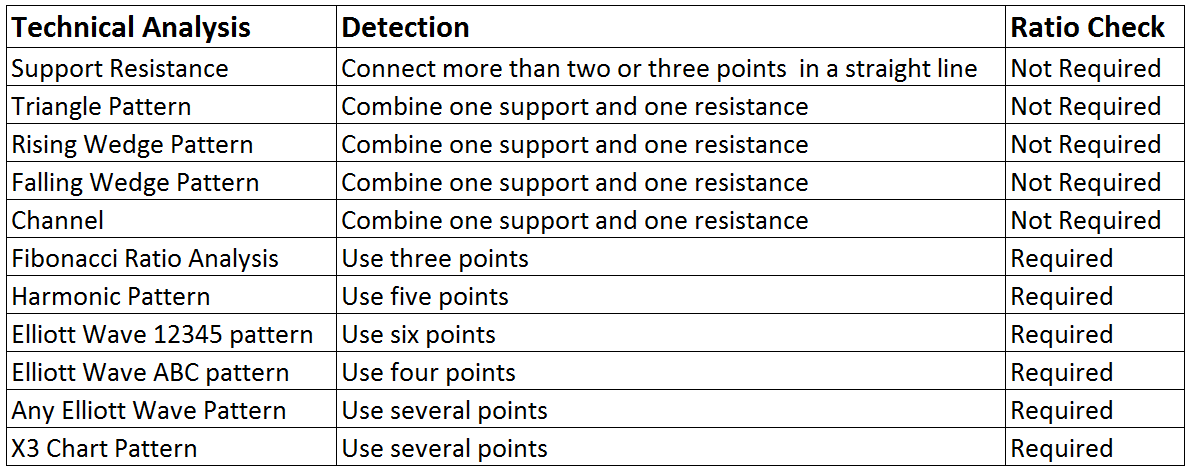
Chart Pattern as Technical Analysis
Chart patterns are the essential price analysis for Forex and Stock market trading as the price is the single most important variable in the market. You can not miss to study the price, even it is very basic one. No one would attempt to trade without seeing the price itself. When you use the chart patterns wisely as the timing tool, it will often reward you more than people who does not use them. Chart patterns include support, resistance, Fibonacci Analysis, harmonic pattern, Elliott Wave, X3 Chart pattern, triangles, rising wedge, falling wedge pattern, channels and many more. Your next question would be why they are so important for our trading and how to use them in our trading. This is rather not short story to be packed in this single article. We can only tell where you can find such a guidance using the chart patterns in Forex and Stock market. The book: Science Of Support, Resistance, Fibonacci Analysis, Harmonic Pattern, Elliott Wave and X3 Chart Pattern (In Forex and Stock Market Trading) is exactly the book dedicated for this topic. This book will provide the scientific rational for chart patterns, connection with economics, chart pattern detection examples, how to use them and how to improve them in Forex and Stock market.
The book can be found in all the major book distributors in the world. Please choose the best book distributor you like from the link below including amazon.com, Google Play Book, scribd.com, Apple Book and so on.
Learning the geometric shape of the price patterns might be not sufficient to apply them well in the financial market. If we understand why the price patterns exist in the financial market, we can use them more accurately. Hence, it is important to understand the underlying science behind the price patterns. In doing so, we need to understand the trend and cycle. Then we need to see the connection of fractal wave with trend and cycle. Finally, when we recognize the fractal wave as the superior analytical method to the existing methods, we will understand why price patterns were used in the financial market over 100 years. With understanding of the turning point in connection with economics, this can advance your knowledge and practice for your day trading and investing.
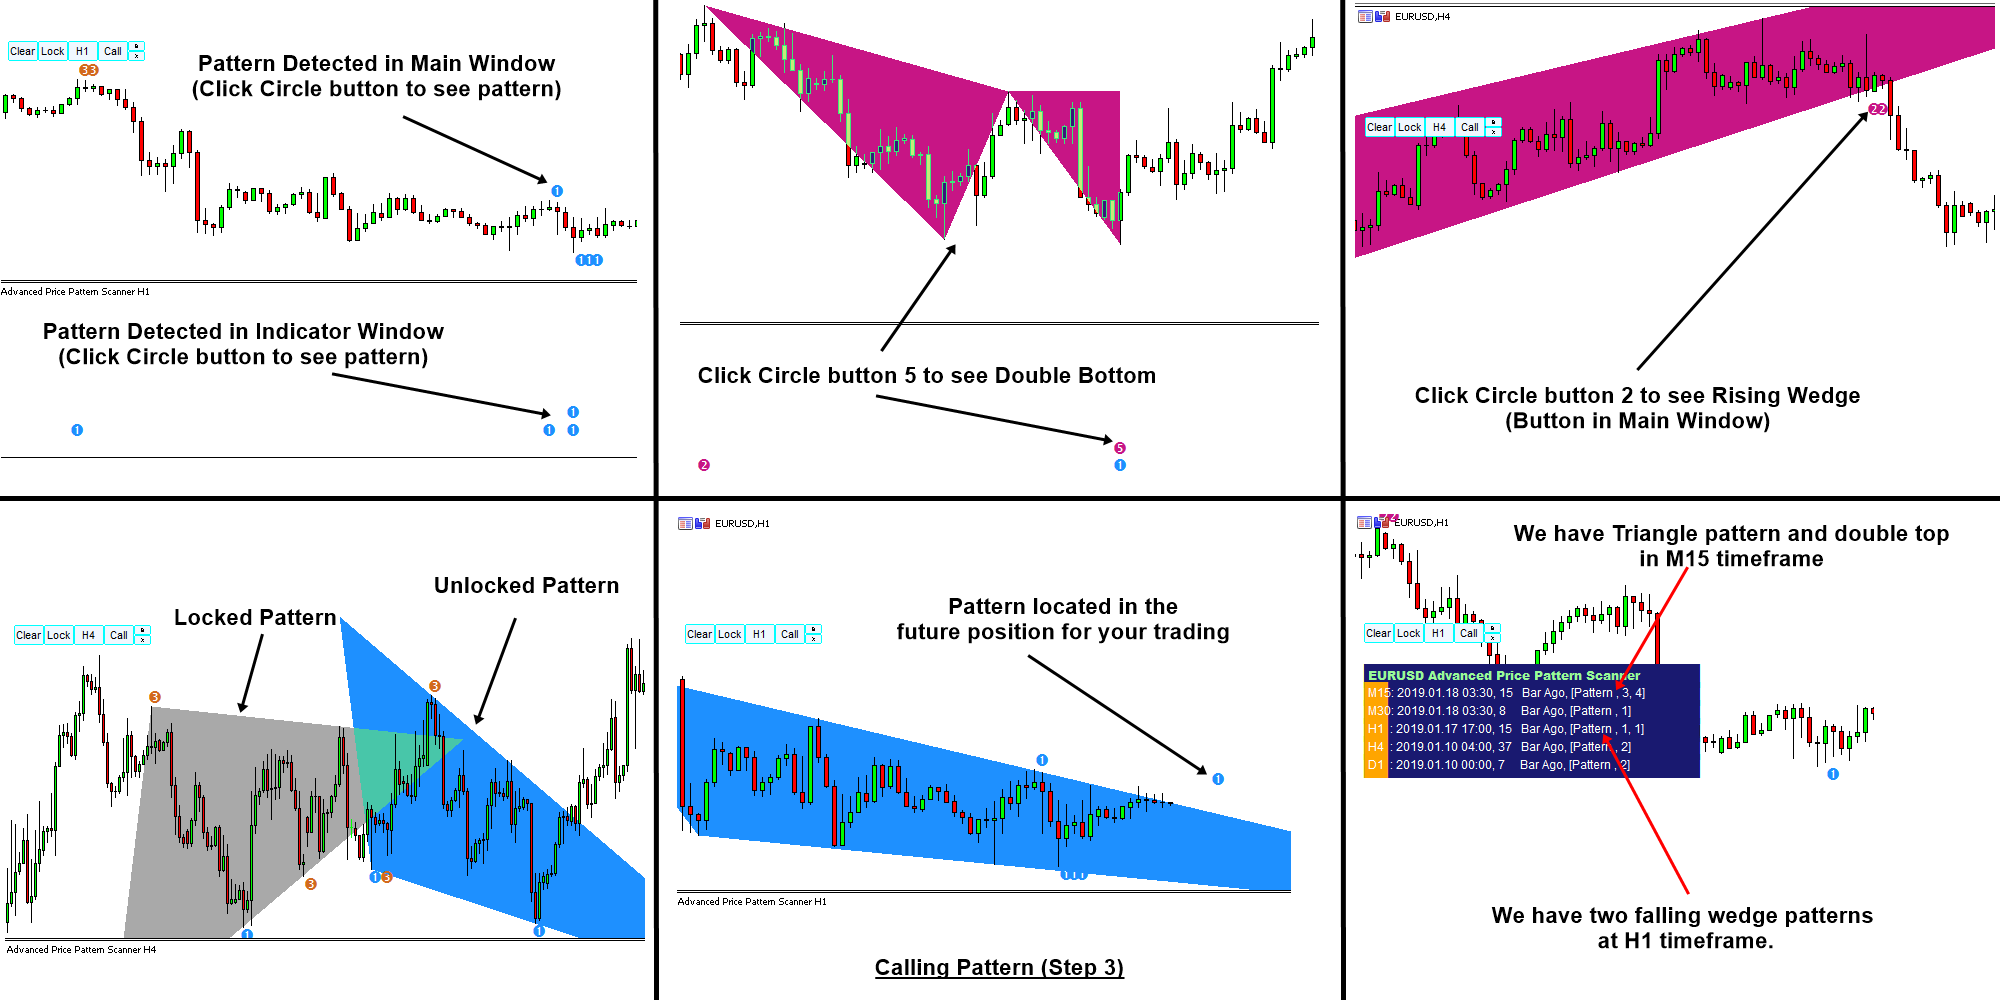
In addition, we provide the automated chart pattern scanner for the harmonic patterns, triangle and wedge patterns respectively. The automated chart pattern scanner helps you to detect some repeating chart patterns automatically. They are the convenient tool to use after you have understood how the chart patterns works for your trading.
1. Advanced Chart Pattern Scanner (Triangle + Wedge patterns + others)
Advanced Chart Pattern Scanner is the non repainting pattern scanner designed for both MetaTrader 4 and MetaTrader 5. It can detects many important price patterns for your trading like rising wedge, falling wedge, head and shoulder patterns, Cup and Handle, etc. Here is an intro video for Advanced Price Pattern Scanner from YouTube. Please check it out.
https://algotrading-investment.com/portfolio-item/advanced-price-pattern-scanner/
https://www.mql5.com/en/market/product/84567
https://www.mql5.com/en/market/product/84568
1. X3 Chart Pattern Scanner (Harmonic Pattern + X3 Chart Pattern)
X3 Chart Pattern Scanner is next generation tools to trade with X3 price patterns in Forex market. With non repainting and non lagging algorithm, this tool can detect with advanced Harmonic Pattern, Elliott Wave Pattern, X3 Pattern structure for your trading. As a bonus, it provides your Japanese candlestick patterns too. X3 Chart Pattern Scanner is type 4 harmonic pattern indicator, which means that you can fine tune your strategy using historical patterns while you are trading the same patterns on live trading.
https://www.mql5.com/en/market/product/41993
https://www.mql5.com/en/market/product/41992
https://algotrading-investment.com/portfolio-item/profitable-pattern-scanner/
For your information, the attached screenshot shows the advanced price pattern scanner.
Related Products


